Abstract
In this paper, we present the detailed life-time dosimetry analysis for rodents exposed in the reverberation exposure system designed for the two-year cancer bioassay study conducted by the National Toxicology Program of the National Institute of Environmental Health Sciences. The study required the well-controlled and characterized exposure of individually housed, unrestrained mice at 1900 MHz and rats at 900 MHz, frequencies chosen to give best uniformity exposure of organs and tissues. The wbSAR, the peak spatial SAR and the organ specific SAR as well as the uncertainty and variation due to the exposure environment, differences in the growth rates, and animal posture were assessed. Compared to the wbSAR, the average exposure of the high-water-content tissues (blood, heart, lung) were higher by ~4 dB, while the low-loss tissues (bone and fat) were less by ~9 dB. The maximum uncertainty over the exposure period for the SAR was estimated to be <49% (k=2) for the rodents whereas the relative uncertainty between the group was <14% (k=1). The instantaneous variation (averaged over 1 min) was <13% (k=1), which is small compared to other long term exposure research projects. These detailed dosimetric results empowers comparison with other studies and provides a reference for studies of long-term biological effects of exposure of rodents to RF energy.
Index Terms: dosimetry, RF exposure, reverberation chamber, Specific Absorption Rate (SAR)
I. Introduction
Over the years, the potential risk of toxicity or carcinogenicity related to long term radio frequency (RF) exposure has attracted special attention due to the increasing use of wireless devices such as mobile phones. In 2011, the World Health Organization (WHO) International Agency for Research on Cancer (IARC) classified RF electromagnetic fields (EMF) as possibly carcinogenic to humans [1]. However, current RF safety guidelines are mainly based on protection from thermal injury due to acute exposure, and information about effects of long term exposures is lacking or incomplete [1], [2]. To fill these gaps in knowledge, the National Toxicology Program (NTP) of the National Institute of Environmental Health Sciences (NIEHS) initiated a major study in 2006 to investigate the potential toxicity and carcinogenicity of long term cell phone RF radiation in rodents [3].
The study aims to test the health effects of uplink cell phone signals by exposing both rats (n=1568) and mice (n=1512) to RF EMF modulated with CDMA (Code Division Multiple Access) and GSM (Global System for Mobile Communications) channel access technology at both 900 MHz and 1900 MHz. It consists of three main phases: first, the definition of the maximum exposure level without excessive increase of body temperature in the animals; second, the performance of pre-chronic toxicology studies lasting for a three-month exposure period; third, the conduction of chronic toxicology and carcinogenicity studies in which the rodents are exposed for 24 months. The work presented in this paper focuses on the dosimetry for the third phase of the program.
The study design for the third phase requires the housing of 3080 unrestrained Sprague-Dawley rats and B6C3F1 mice while being exposed to RF energy in 10 min on/off cycles, for up to 18.5 hours per day for 24 months. The highest non-thermal exposure levels, established in the first phase of the program, have been used to select the highest levels to be applied in the second, pre-chronic phase. The pre-chronic study results enabled the selection of the highest exposure levels for the chronic study, defined either by the absence of a significant effect on the growth rate of the rodents, or by the maximum capability of the exposure system. The mid- and low-level exposures were determined by reducing the highest exposure by a factor of two as per conventional dose-level splitting in toxicity studies. Based on the results of the pre-chronic study, the target whole body averaged specific absorption rate (wbSAR) values chosen for the exposed animals were 1.5, 3.0, and 6.0 W/kg plus a sham control group (0 W/kg) for the rats and 2.5, 5.0, and 10 W/kg plus a sham control group for the mice. The protocol was completed in September 2014 and the preliminary findings were published by NIEHS on 27 May 2016 [4].
In this paper, we provide beyond state-of-art detailed dosimetry for the NIEHS NTP study in order to empower detailed analysis of the results and more importantly, enable comparison with past and future studies. The dosimetry had to meet the requirements for dosimetric studies defined in [5] and in addition also investigated for the first time the effects of different postures on the electromagnetic coupling and SAR distributions. We also provide detailed dosimetric values for different organs that are considered to be crucial when discussing the findings and comparing results with other studies using different exposure systems.
II. Exposure System
In the past, different exposure systems for rodents have been designed to investigate both thermal and non-thermal health effects associated with mobile phone exposure. These can be divided mainly into three types according to the incident field: quasi-open, guided-wave, and resonant, the advantages and disadvantages of which have been described in [6]. As high exposure levels demand a resonant cavity type system and the long exposure time per day do not allow restraint of the animals, a reverberation chamber exposure system was the only suitable design. The system consisted of 21 chambers: 14 of those operated at 900 MHz each housing 112 male or female rats, and the remaining seven chambers operated at 1900 MHz each housing 216 mice with equal numbers of males and females. The rotation speed of the two stirrers had been defined to best simulate environmental exposure of non-stationary users, i.e., considering power-control due to moving of the user and due to hand-overs. The variation of the isotropic exposure strength was better than 0.1 dB for any time interval of 60 s when spatially averaged over the volume corresponding to a mouse. Each chamber was equipped with an automatic drinking water system, timer controlled lighting, good ventilation and individual air temperature control. Together with RF safe drinking lixits and an adequate food supply in each cage it permitted the exposure of the free moving rodents for long daily periods of 18.6 hours. The chambers provided excellent field uniformity (better than 0.6 dB) and isotropy, which, in turn, imparted outstanding Specific Absorption Rate (SAR) uniformity, all with good efficiency of approximately 45 to 70% in adult mice and rats respectively [7].
III. Materials and Method
A. Animal Models
High-resolution anatomical models are essential for the dosimetric analysis to accurately predict the exposure levels and the SAR distribution inside the rodents (i.e., the organ specific SAR). As during long-term in vivo experiments animal size and weight changes substantially over the experimental period, various sizes of mice and rats were needed. In this paper, the dosimetric analysis was based on the virtual animal models (www.itis.ethz.ch/animals), which have been harnessed in various studies [6], [8], [9] and are listed in Table I and Table II. Lacking a B6C3F1 numerical mouse model for various ages, the OF1 and PIM1 mouse models were dosimetricaly used instead after we had verified that all strains resulted in similar SAR when scaled to the same size. Animal models were scaled to cover a wide range of weights and body dimensions to accurately represent the possible variations over the entire life-time of the rodents. The dielectric tissue parameters applied correspond to those in the IT’IS parameter database [10], that is largely based on [11] but supplemented with other literature data.
TABLE I.
The information for the rat models. (reference: www.itis.ethz.ch/animals)
| Weight | Model Name | Scaling Factor | |
|---|---|---|---|
| female rat | |||
| small | 140 g | Female Rat | 0.66 |
| medium | 354 g | Female Rat | 0.9 |
| Large | 486 g | Female Rat | 1 |
|
| |||
| male rat | |||
| small | 232 g | Small Male Rat | 1 |
| medium | 424 g | Male Rat | 0.89 |
| large | 597 g | Male Rat | 1 |
TABLE II.
The information for the mouse models.(reference: www.itis.ethz.ch/animals)
| Weight | Model Name | Scaling Factor | |
|---|---|---|---|
| female mouse | |||
| small | 20 g | Female OF1 Mouse | 1 |
| medium | 33 g | Female OF1 Mouse | 1.19 |
| large | 45 g | Female OF1 Mouse | 1.31 |
| male mouse | |||
| small | 22 g | Male OF1 Mouse | 0.83 |
| medium | 38 g | Male OF1 Mouse | 1 |
| large | 52 g | Male PIM1 Mouse | 1 |
B. Simulation Platform and Evaluated Dosimetric End Points
The simulation platform SEMCAD X V14 (SPEAG Switzerland)1 was used to perform dosimetric assessment. Human exposures are expressed in terms of wbSAR, with local exposures in terms of the peak spatial SAR (psSAR) averaged over any 10 g and 1 g of tissue mass (psSAR10g and psSAR1g, respectively), whereas here the evaluation procedures defined in [12] have been scaled and applied. Therefore, by considering the average weights of humans, rats, and mice, the psSARs were analyzed over 50mg (psSAR50mg) and 5mg (psSAR5mg) for the rat, and 5mg (psSAR5mg) and 0.5 mg (psSAR0.5mg) for the mouse. The relationship between the wbSAR sensitivity and weight was analysed on the basis of the different age rat and mouse models. Additionally, organ averaged SAR (oSAR) and its deviation from the wbSAR were evaluated and analysed over the life-time as well. The simulation platform had been verfied and the documentation is available at www.semcadx.com.
C. Incident Field
It has been shown that the incident field in reverberation chambers can be described as the summation of a number of plane-waves [13], where the resulting field distribution in the chamber has a Rayleigh distribution of amplitudes over a wide range of quality factor values [14]. This demonstrates that the energy is well stirred with no dominant line-of-sight propagation path between the exposure volume and the excitation antennas. Further to this Hill discussed in detail [15] the plane wave integral representation for well-stirred fields in a reverberation chamber, the electric (E) field at any location can be represented as an integral of plane waves over all real angles and the angular spectrum is taken to be a random variable dependent on the stirrer position. Furthermore, it is stated that because the multipath scattering changes the phase and rotates the polarization many times, angular spectrum components with orthogonal polarizations or quadrature phase will be uncorrelated, the result is that the average E-field will be zero. Additionally, the three orthogonal components of the E-field have equal average amplitudes. However, it is the mean square of the E-field, which is proportional to the electric energy density that is important. Furthermore, each of the many random plane waves present at any instant in time can be mapped into up to three orthogonal waves impinging on adjacent sides of a cube, each orthogonal wave can be further decomposed into two orthogonal polarizations. Summing over all the random plane waves present at any instant in time results in a total of 12 plane waves. Due to the fact that the plane waves from all directions have random polarizations and phases, i.e., are uncorrelated, it was hypothesized that the local averaged SARs from two orthogonally polarized waves with equal amplitudes incident on each the 6 sides of a cube surrounding a lossy body gives an accurate estimate of the total time-averaged local SAR. This hypothesis was tested using simulation and the uncertainty associated with the simplification determined.
D. Numerical Dosimetry
Modelling the field distributions in reverberation chambers has typically been achieved by means of superposition of plane waves with the appropriate amplitude and angular distributions [16]. For calculating the power absorbed in rodents or humans, different methods have been applied. Firstly, the most complex analyses model the whole chamber is modeled with FDTD or other numerical methods for a large number of stirrer angular positions: the animal model is directly exposed and the SAR assessed and averaged. Alternatively, the fields in the chamber are evaluated over a closed volume containing the subject for each stirrer position, and then with application of Huygens principle a second FDTD simulation of the animal [17] has been performed. A second method is to determine the SAR by simulating the exposure of the animal model to the superposition of a number (n) of plane waves with a Rayleigh distribution of amplitudes, random directions of arrival, polarization, and phase, averaged over a number (m) of repetitions, where n is typically >100 and m>200 until converging results are obtained [18]. A third method is a simplification obtained by reducing the random incidence waves to only 12 equal waves from six directions, incident on the sides of a cube, composed of two waves of orthogonal polarizations, the cube contains the exposed animal. The SAR produced in 12 simulations each with one plane wave is averaged to obtain the final result. This simplification is exact when there is symmetry such as for a sphere, some error is introduced for other shaped objects and hence the uncertainty must be assessed. Here the majority of dosimetry has been performed using this third method with a comparison the second method to verify the hypothesis that the methods are provide similar values and to assess uncertainty. (see Section IV-B).
E. Experimental Verification
As recommended in [5], the numerical dosimetry needs to be verified, at least for the wbSAR. In this paper, the temperature increase/thermal time constant method [19], [20] was used with homogeneous phantom measurements. After comparison of various types of tissue simulating liquid, HSL900 and HSL1900 (SPEAG, Switzerland)1 were selected for the rat and mouse phantoms, respectively, since they result in similar wbSAR values for the phantoms and for the equivalent anatomical models at the same field strength. The dielectric properties for the phantoms are shown in Table III. The male and female mouse phantoms consisted of sample tubes filled with 42 ml and 37 ml of tissue simulating liquid, respectively (Fig. 1a)), with physical phantoms on the left and the corresponding simulation models on the right. The rat phantoms (Fig. 1b) and c)) consisted of a plastic bottle filled with 550 ml or 325 ml to represent male and female rats, respectively.
TABLE III.
Dielectric properties of phantom liquids (HSL1900 for mouse phantom, HSL900 for rat phantom, with tolerance of ±5%)
| Tissue property | εr | σ (S/m) | ρ (kg/m3) |
|---|---|---|---|
| Mouse phantom @1900MHz | 39.5 | 1.43 | 1000 |
| Rat phantom @900MHz | 40 | 0.95 | 1000 |
Fig. 1.
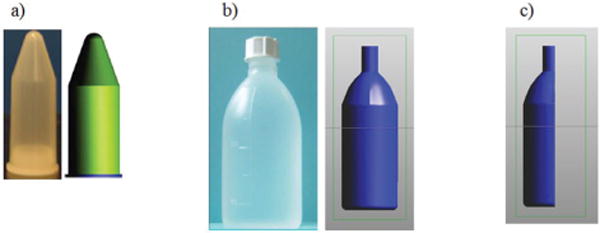
a) mouse phantom, b) male rat phantom, and c) female rat phantom (half filled). The phantoms normally lay horizontal in the real experiments.
To minimize temperature measurement errors, the SAR evaluations were performed in the highest power chambers to maximize the temperature increase and, hence, the difference between air temperature and phantom temperature after exposure. The highest transmitted power for the high SAR groups was 195W average for mice and 430W average for rats. For the mouse and rat phantoms, the SAR was computed from the steady-state temperature increase, and the thermal time constant of the phantom, which was determined from the phantom cooling curve and the SAR sensitivity, was derived from the measured E-field.
The exposure time was 19,000 s and 30,000 s for mouse and rat phantoms respectively, which was much larger than the field variations in the chambers of 60 s and the cooling constant of 3440 and 7500 – 8700s for mouse and rat phantoms, respectively. For the rat phantoms, the SAR distribution was obtained by measuring the temperature of all phantoms in one chamber in rapid succession immediately after the RF power was switched off. The phantoms were shaken in order to warranty a homogeneous temperature of the liquid. The relative decay, as measured by a temperature probe fixed in one rat phantom, was used on a phantom-by-phantom basis to correct the decrease in temperature due to cooling during the elapsed time. The experiment was repeated for both male and female rat phantoms.
A different strategy was required to perform the dosimetry in the mouse model. A mouse phantom measurement setup is shown in Fig. 2. Since the mouse phantoms are relatively small and their thermal-time-constants shorter, we could not measure the temperature of every phantom. Instead, to assess the SAR homogeneity throughout the chamber, temperature probes were installed in four phantoms which were then moved to 10 different positions generated randomly by a computer. All other cages had mouse phantoms placed with random locations and orientations. At each location, the phantoms were kept for more than one hour to attain an as stable temperature as possible, providing a total of 40 different temperature measurements. The cage rack is shown in Fig. 2, all cages, cage covers, and cage racks were composed of non-conductive, low permittivity materials. Temperature probes T1V3Lab (SPEAG, Switzerland)1 were each inserted into the center of a phantom and were connected to the completely shielded Data Acquisition Electronics DAE3 (SPEAG, Switzerland)1 that was fixed onto a plastic holder outside the cage. The digitized data were transmitted via optical fibers to the EASY4 measurement server (SPEAG, Switzerland)1 for recording the temperature data. The probes were inserted to approximately the center axis of the phantom was chosen because the temperature increase is representative of the overall exposure, which has been verified and the uncertainty assessed by the thermal simulation in SEMCAD1 [21]. For accuracy comparison and reference, the measurements were carried out in both labs; i.e., in the prototype chamber at the IT’IS laboratories in Zurich and in the RF exposure facility used for in vivo toxicology and carcinogenicity evaluations at the IIT Research Institute in Chicago.
Fig. 2.
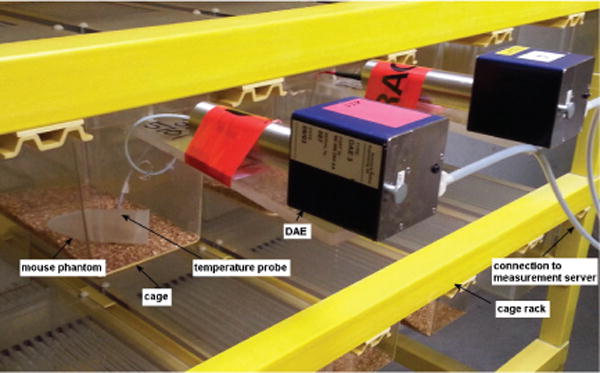
Mouse phantom measurement setup.
F. Uncertainty and Variation Evaluation
To understand the limits on the reliability of the dosimetric assessment of the life-time wbSAR and oSAR, various uncertainties and variations have been evaluated following the concept of GUM [22], [23].
The uncertainty defines the possible absolute SAR deviation from target values. The uncertainty can be due to the setup (e.g., field measurement probe calibration uncertainty), or due to the animals (e.g., anatomical model representation), growth rate, and update frequency of the average weight of the different rodent groups and the weight distribution with each group.
For the numerical dosimetry, a wide range of animal ages and weights need to be considered to cover the entire life span. Since only a limited number of numerical phantoms were available at discrete sizes and weights, the numerical models were scaled to allow the determination of the SAR sensitivities over the life time of the rodents. This means, for instance, that when scaling the female small and medium rat from the female large model, the relative proportions of all organs remain constant. However, in real life the different organs and tissues grow at different rates as the relative physical proportions of the body change. As a result, the scaled animals may have errors in the calculated wbSAR and oSAR, compared to a strictly anatomically-correct mouse or rat, and this potential error must be quantified. The scaling uncertainty analysis is based on the philosophy that the scaled model and an original anatomically-correct model, with same weight, are compared for differences of SAR. For instance, a small male rat was scaled to a large size, which had the same weight as the anatomically-correct large male rat, and the errors due to scaling were obtained by comparing the SAR result between them. These errors can then be applied appropriately to the uncertainties inherent in scaling both sexes.
Based on the weight and SAR sensitivity from the different age models, we can calculate the relationship between them. These formulas are important for the prediction of the SAR sensitivity to variable weight of the rodents during their lifetimes.
Additionally, the uncertainty due to simulation was analyzed by including dielectric parameters, discretization (voxel size), and simulation convergence. First, tissue parameter changes during the animal lifespan, we considered a variation of ±10% in permittivity and conductivity with respect to the reference values. Then, the discretization uncertainty was evaluated by halving the grid size of the original reference models set for mice and rats. Finally, the uncertainty due to the convergence of the simulation was analyzed by doubling the computation time to ensure that the results had really converged.
Another major factor of uncertainty is the growth rate of the rodents, since the exposure field strength is based on the measured rat or mouse average weight in a given chamber, which is correct only at the time of measurement. As the elapsed time from the measurement increases, the changes in weight due to growth result in changes in the SAR until the weight is reassessed and updated. To limit this uncertainty and its effect on time averaged exposure, the update intervals were set at twice per week for the rats and once per week for the mice during the fastest growth rate period until the 17th week when the weight error is most significant.
The variation defines the relative amounts of deviation from the mean values for individuals, where the instantaneous variation is averaged over integral number of stirrer rotations (60s) and the life time variation is averaged over the entire exposure period [5].
The body weight distribution of mice and rats of the same strain, gender, and age is normal around its mean weight. The individuals with weights that deviate the most from the average will have SARs with the highest deviations from the target level. The combined historical data for rodents from previous NTP studies were used to estimate the standard deviation as a function of average body weight. The SAR variations are calculated based on the relationship between SAR sensitivity and the weight deviation.
The field homogeneity of the chamber and the daily movements of the rodents can cause instantaneous variation, which, however, averages out during the life time. In addition, throughout the whole study cage locations were rotated each time the bedding was changed, which averages out the changes in homogeneity over the entire exposure volume. The effect of rodent posture was investigated with video footage of the animals’ movements and pictures from historical data available at NIEHS, and the observations were used to define certain postures as shown in Fig. 3: straight, curling, sleeping, stretching, and drinking. These daily changes in posture of the rodents change the absorption cross section [24] and hence the SAR, which contributes to the variation. Though a similar analysis of posture was performed for mice at 2450 MHz in [21] the analysis here for both mice and rats is important as it fills in two important knowledge gaps: how do the uncertainties within a species vary with changes in frequency? and how do they vary across two similar species?
Fig. 3.
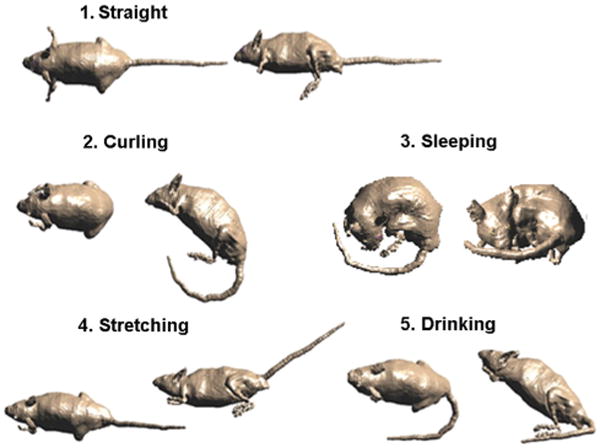
The dependence of SAR on postures had been derived from typical animal postures observed in the cages.
IV. Results
A. Experimental Verification Results
Experimental verification of the SAR was initially performed in Zurich and then repeated in Chicago using the methods outlined in Section III-E. In Chicago, 92 male rat phantoms, 112 female rat phantoms, 19 male mouse phantoms, and 18 female mouse phantoms were measured. In Zurich, 40 male rat phantoms, 80 female rat phantoms, and 40 mouse phantoms were measured. The measured and calculated mean wbSARs data for each group are presented in Table IV. The wbSAR uniformity among the phantoms is commensurate with the field homogeneity.
TABLE IV.
Experimental results obtained in Chicago and Zurich in male and female rat phontoms and mice phantoms.
| Phantom | f MHz | Cal. SARμW/kg/(V/m)2 | Meas. SAR μW/kg/(V/m)2 | StDev % | dev % |
|---|---|---|---|---|---|
| Rat(m) | 900 | 55.9 | 54.9 | 18.6 | −0.2 |
| Rat(f) | 900 | 75.7 | 73.4 | 19.7 | −3.0 |
| Mouse | 1900 | 164 | 144 | 14.0 | −12.4 |
The measured wbSAR was systematically lower than the one calculated numerically and is attributable to the fact that as the phantom temperature increases so does the air temperature. As the phantom temperature increase is measured with respect to the air temperature, and the air temperature cannot be strictly controlled, an under estimate in wbSAR occurs; this is accounted for in the uncertainty budget.
The total uncertainty (k=2) due to field and phantom temperature measurements in both chambers (see Table V), is less than 34%. The deviation between the calculations and measurements shown in Table IV for the rodents are all within the uncertainty range, which verifies the reliability of the simulation results.
TABLE V.
Uncertainty assessment for the experimental dosimetry. (N: normal distribution)
| Contributions | Distr. | Std. Unc. | |
|---|---|---|---|
| Rats 900MHz | Mice 1900MHz | ||
| E/H field measurement | N | 12.8% | 11.3% |
| Field control | N | 4.7% | 4.7% |
| Chamber temperature fluctuations | N | 9.6% | 9.6% |
| Temperature probe accuracy | N | 1.2% | 1.2% |
| Combined standard uncertainty k=1 | 16.7% | 15.6% | |
| Expanded uncertainty k=2 | 33.5% | 31.2% | |
B. Dosimetry Assessment
In a first step we verified that that the 12-plane-wave method is adequate to simulate the exposure of the rodents in the reverberation environment by assessing the uncertainty of the computationally affordable simplification for non-symmetrical lossy loads. This was determined by comparison with the random n-plane-wave method to model the reverberation chamber. The n-plane waves with random amplitude, phase, polarization, and incident angle to the rodents were generated by Matlab (MathWorks, USA)1. Each plane wave, according to the incident angle, is decomposed into plane waves in the three orthogonal axes traveling in either positive or negative directions and with two orthogonal polarizations. Therefore, to represent one stirrer position, plane waves from n different directions were bundled into plane waves from only six selected directions, each with two polarizations. The field data were imported into SEMCAD1 and applied to the rodent model with the field combiner tool. The SAR values were calculated by considering the E-field and material properties in every voxel. To mimic the stirrer rotation, the procedure was repeated m times, hence, the method is distinct from the simplification which uses 12 individual simulations of each of the 12 equal plane waves and sums the SARs. Finally, the SAR normalized to 1 V/m E-field strength ((W/kg)/(V/m)2) was calculated by one of two methods:
| (1) |
or
| (2) |
where m is the number of stirrer rotations. The first method averages the instantaneous SAR divided by the instantaneous field squared, equivalent to a simulation by simulation normalization; the second is more akin to the situation in the real exposure setup, where the average SAR is divided by the mean square E-field. These two normalization procedures for a random n-plane wave method converge when n = 500 and m = 300, and both averaging regimes give similar results.
By comparison, the 12-plane-wave method results in an offsets of −9.4% for the mice and −8.9% for rats, and standard uncertainty of 1.8% and 2.4% for mice and rats, respectively.
C. Assessment of Whole-Body Averaged SAR (wbSAR) and Global Peak-Spatial Averaged SAR (psSAR)
We used the methods discussed in Section III-F to determine the wbSAR and global psSAR values. Table Table VI displays the SAR values for three typical sizes: small, medium, and large, which covers the life time of rodents.
TABLE VI.
Whole-body SAR analysis for typical ages of rodents (*s: scaled model)
| Weight g | wbSAR mW/kg/(V/m)2 | wbSAR std. dev. mW/kg/(V/m)2 | psSAR5mg mW/kg/(V/m)2 | psSAR50mg mW/kg/(V/m)2 | |
|---|---|---|---|---|---|
| Female Rat @900MHz | |||||
| small (*s) | 140 | 0.14 | 0.14 | 2 | 1.2 |
| medium (*s) | 354 | 0.077 | 0.068 | 0.73 | 0.52 |
| large | 486 | 0.067 | 0.057 | 0.65 | 0.4 |
| Male Rat @900MHz | |||||
| small | 232 | 0.1 | 0.071 | 0.62 | 0.5 |
| medium (*s) | 424 | 0.067 | 0.048 | 0.66 | 0.49 |
| male large | 597 | 0.059 | 0.043 | 0.53 | 0.39 |
|
| |||||
| Weight g | wbSAR mW/kg/(V/m)2 | wbSAR std. dev. mW/kg/(V/m)2 | psSAR0.5mg mW/kg/(V/m)2 | psSAR5mg mW/kg/(V/m)2 | |
|
| |||||
| Female Mouse @1900MHz | |||||
| small | 20 | 0.24 | 0.2 | 1.6 | 1.1 |
| medium (*s) | 33 | 0.19 | 0.14 | 1 | 1 |
| large (*s) | 45 | 0.15 | 0.11 | 0.79 | 0.78 |
| Male Mouse @900MHz | |||||
| small (*s) | 22 | 0.26 | 0.21 | 2.1 | 1.4 |
| medium | 38 | 0.17 | 0.13 | 1.1 | 1 |
| large | 52 | 0.15 | 0.12 | 1.3 | 0.97 |
Based on the results for different weights, an approximation formula as function of weight has been derived (Fig. 4):
Fig. 4.
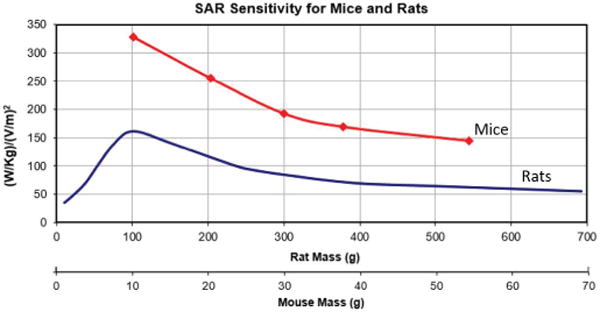
SAR sensitivity for mice at 1900 MHz and rats at 900 MHz as function of weight.
Rats exposed at 900 MHz:
| (3) |
| (4) |
Mice exposed at 1900 MHz:
| (5) |
where ‘weight’ stands for rodent weight in g and wbSAR is in (W/kg)/(V/m)2. These formulas accurately estimate the life time SAR with maximum uncertainty of around 7.2% for rats and 3.0% for mice, however when averaged over the life time the error is approximately 2.8 and 1.6% respectively. This approximation was applied during the study to adjust the incident field in order to maintain the targeted wbSAR level during the life time of animal. For instance, at the maximum SAR level (6 W/kg for rats and 10 W/kg for mice), the E field is adjusted over the range of 203–315 V/m for male rats, 200–267 V/m for female rats, and 196–263 V/m for mice over the exposure period to maintain the target wbSAR level.
The wbSAR uncertainty is the uncertainty for the group average SAR value during the entire exposure, which is shown in Table VII.
TABLE VII.
Uncertainty analysis for wbSAR of rodents.(R: rectangular distribution)
| Contributions | Distr. | Standard Uncertainty % | |||
|---|---|---|---|---|---|
| Rat@900MHz | Mouse@1900MHz | ||||
| Male | Female | Male | Female | ||
| E/H field measurement | N | 13% | 13% | 11% | 11% |
| Field Control | N | 4.7% | 4.7% | 4.7% | 4.7% |
| Planewaves vs. random waves | R | 2.4% | 2.4% | 1.8% | 1.8% |
| SAR sensitivity expression fit | N | 7.2% | 7.2% | 3.0% | 3.0% |
| Scaling | R | 1.6% | 6.5% | 12% | 20% |
| Anatomical model dosimetry | R | 3.9% | 3.9% | 0.8% | 0.8% |
| Rodent growth rate (max.) | R | 17% | 17% | 6.2% | 6.2% |
| Combined standard uncertainty k=1 | 24% | 24% | 18% | 24% | |
| Expanded uncertainty k=2 | 47% | 48% | 36% | 49% | |
The uncertainty in exposure between groups is related only to those uncertainty conditions not common to all groups, namely field measurement and control. Therefore the standard uncertainty (k=1) between the groups are 14% (0.56 dB) for rats and 12% (0.5 dB) for mice. This is well within the margin of ±3 dB between different exposure levels.
The scaling uncertainty is obtained for the worst case analysis. Since the female models generally have a larger scaling factor than the male models, the uncertainty deviation is comparably larger.
The total anatomical model simulation uncertainty due to dielectric parameters, discretization, and simulation convergence was estimated to be ±4% for rats, and ±1% for mice. The smaller uncertainty is mainly due to the comparably smaller voxel size used in the mouse simulations.
The uncertainty due to growth rate was calculated based on rodent weight updates generally performed twice per week for the rats and once per week for the mice through to the 17th week and less frequently after. The maximum deviation is observed when the rodents are young, it rapidly decreases with age, as indicated by the growth rate of rodents, shown in Fig. 5. The maximum growth rate deviation, during the exposure period from 3-week-old rats and 5-week-old mice, is 17% for the male and female rats, and 6% for the mice, as shown in Fig. 6. Over the entire exposure period, the mean growth rate uncertainty was 0.5% for the male rats, 0.4% for the female rats, and 0.4% for mixed mice. The uncertainty thus depends on the age when the rodents are exposed. The maximum wbSAR uncertainty at any age is given in Table VII, whereas the expanded uncertainty (k=2) averaged over the entire life time is as expected lower, resulting in 33% for male rats, 35% for female rats, 35% for male mice and 47% for female mice.
Fig. 5.
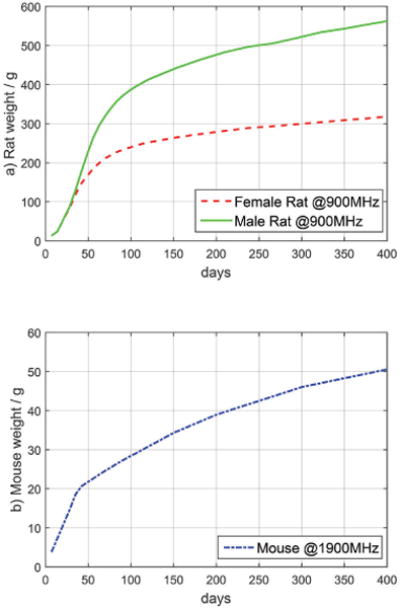
Growth rate of the rodents based on data from previous NTP studies.
Fig. 6.
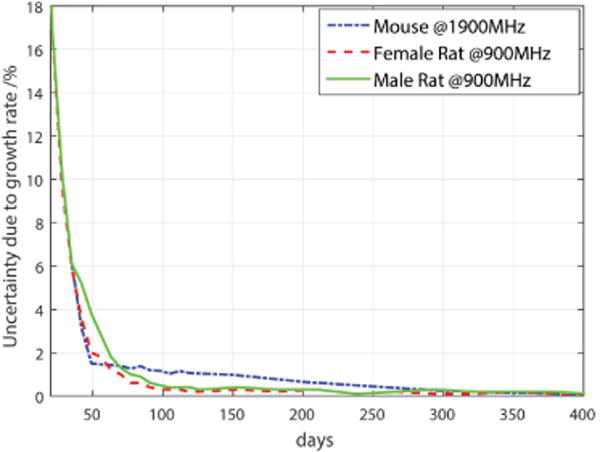
Uncertainty of SAR sensitivity estimate due to growth rate (rats from 3 week-old at 900 MHz, mixed mice from 5 week-old at 1900 MHz).
The variation analysis for posture shows that largest deviation was found for the sleeping posture, where the effective body length of a rodent changes most notably. From the five-posture analysis, the variation for wbSAR sensitivity is 5.2% for rats, and 5.6% for mice.
The variation due to the distribution of weights about the average is shown in Fig. 7. During the exposure period, the maximum standard variation is 8.6% for male rats, 8.2% for female rats, and 8.8% for mixed mice. The mean variation over the entire life span is 5.4% for male rats, 6.4% for female rats, 3.8% for the mixed mice.
Fig. 7.
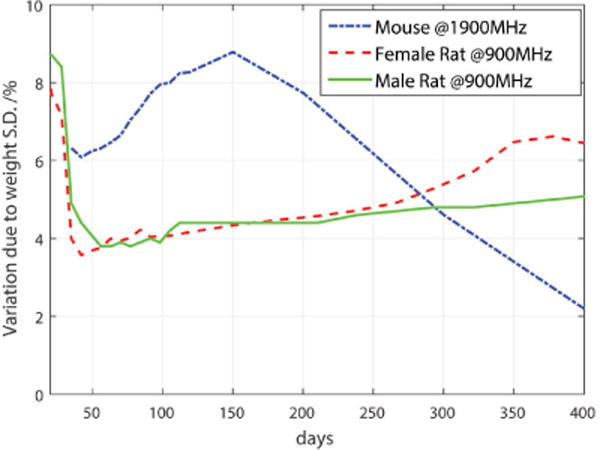
SAR sensitivity variation to weight standard deviation (rats from 3 week-old at 900 MHz, mixed mice from 5 week-old at 1900 MHz).
The total instantaneous variation for wbSAR is shown in Table VIII. The life time averaged variation that will not be similar across all animals or averaged out due to movement and cage rotation will relate only to the weight distribution is therefore 5% for male rats, 6% for female rats, and 4% for mice.
TABLE VIII.
Instantaneous variation analysis for wbSAR.
| Variation sources | Distr. | Var. inst. | ||
|---|---|---|---|---|
| male rats 900MHz |
female rats 900MHz |
mixed mice 1900MHz |
||
| Experimental | R | 7.4% | 8.4% | 7.4% |
| SAR uniformity | ||||
| SAR SD due to | N | 8.6% | 7.6% | 8.9% |
| weight SD (max.) | ||||
| Postures | N | 5.2% | 5.2% | 5.6% |
|
| ||||
| Overall standard variation k=1 | 12.5% | 12.5% | 13% | |
| Expanded variation k=2 | 25% | 25% | 26% | |
In summary, results show that the uncertainty is substantially influenced by the experimental uncertainties such as field measurement data and the growth rate of the rodents. The variation is significantly impacted by weight standard deviation, which varies over the animal life time, as shown in Fig. 8. Therefore, the maximum deviation of the individual from the target values occurs during the beginning of the exposure period, when the rate of weight change and SAR sensitivity are highest.
Fig. 8.
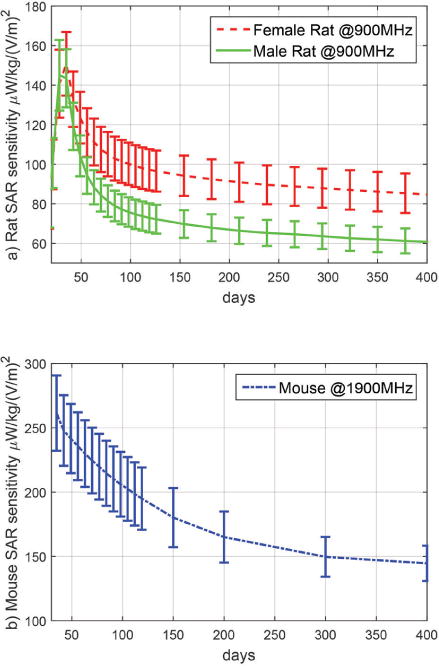
Lifetime dependent wbSAR sensitivity based on days with instantaneous variation for rats at 900 MHz and mice at 1900 MHz.
Whole body SAR is typically not the limiting quantity for the output power of a cellular phone, but the peak spatially averaged SAR which provides a measure of the local rather than global exposure. Table IX summarizes the relative values of psSAR with respect to the wbSAR with uncertainty and variation ranges. The psSAR is about 8 to 10 dB higher than the wbSAR for the rat, and 7 to 9 dB higher than that for the mouse. Posture introduces large instantaneous variations in psSAR, resulting in a maximum instantaneous variation of approximately 30% for the rat, and 18% for the mouse. The psSAR lifetime variation is the same as that of the wbSAR.
TABLE IX.
Uncertainty and variation for the psSAR for rats at 900MHz and mice at 1900 MHz.
| psSAR/wbSAR (dB) | Unc. (k=2) | Variation (k=1) | ||||
|---|---|---|---|---|---|---|
| instant. | lifetime | |||||
| Rats | male | female | male | female | ||
| psSAR5mg | 9.3 | 10.5 | 75% | 76% | 29% | 5.0% |
| psSAR50mg | 8.1 | 8.4 | 70% | 68% | 32% | 5.0% |
|
| ||||||
| Mice | male | female | male | female | ||
| psSAR0.5mg | 9.1 | 7.6 | 49% | 54% | 18% | 6.4% |
| psSAR5mg | 7.9 | 7.1 | 42% | 53% | 14% | 6.4% |
D. Assessment of Organ-Averaged SAR (oSAR)
The oSARs are calculated and evaluated for all mouse and rat models in Table I and Table II which approximates to the full life time. On important finding was that the deviation from the wbSAR was found to be relatively constant over the animal life time, when the uncertainty was included.
The oSAR deviations from wbSAR, and its uncertainty and variation analysis for the largest organs, are shown in Table X for the rats and Table XI for the mice. For these organs, the oSAR levels vary between −9dB and 5dB, compared to the wbSAR for the rodents. In general, the localized SAR deposited in high-water-content tissues (blood, lung) exceeds by ~4 dB the wbSAR, and that deposited in the low-loss tissues (bone, fat) is less by a factor of ~9 dB compared to the wbSAR.
TABLE X.
Uncertainty and variation for rat oSAR exposed at 900MHz.
| Organs | oSAR/wbSAR (dB) |
Uncertainty (k=2) |
Variation instantaneous (k=1) |
||
|---|---|---|---|---|---|
|
| |||||
| male | female | male | female | ||
| Blood Vessels | 3.7 | 4.6 | 49% | 74% | 14% |
| Bones | −8.8 | −7.8 | 51% | 67% | 14% |
| Cerebral | 0.3 | −0.7 | 106% | 88% | 14% |
| Hemisphere | |||||
| Connective | −3.0 | −1.9 | 48% | 69% | 13% |
| Tissue | |||||
| Fat | −8.8 | −6.6 | 48% | 68% | 16% |
| Glands | 1.6 | 1.6 | 75% | 98% | 13% |
| Heart | 2.7 | 4.7 | 50% | 83% | 16% |
| Intestine, Large | 1.6 | 1.7 | 50% | 68% | 13% |
| Intestine, Small | 3.3 | 4.4 | 51% | 69% | 14% |
| Kidneys | 0.5 | 0.2 | 49% | 84% | 14% |
| Liver | 0.7 | 2.0 | 49% | 69% | 13% |
| Lung | 3.2 | 4.2 | 52% | 71% | 14% |
| Muscles | 0.3 | 1.3 | 48% | 67% | 13% |
| Skin | −1.3 | −0.3 | 49% | 67% | 13% |
| Stomach | 2.0 | 1.4 | 56% | 70% | 13% |
TABLE XI.
Uncertainty and variation for mouse oSAR exposed at 1900 MHz.
| Organs | oSAR/wbSAR (dB) |
Uncertainty (k=2) |
Variation instantaneous (k=1) |
||
|---|---|---|---|---|---|
|
| |||||
| male | female | male | female | ||
| Blood Vessels | 4.1 | 3.2 | 48% | 69% | 15% |
| Bones | −6.9 | −7.7 | 43% | 70% | 15% |
| Cerebral | −0.2 | 0.3 | 85% | 93% | 27% |
| Hemisphere | |||||
| Connective | −2.4 | −2.7 | 42% | 69% | 13% |
| Tissue | |||||
| Fat | −6.8 | −8.0 | 56% | 72% | 13% |
| Glands | 2.7 | 2.1 | 71% | 76% | 15% |
| Heart | 0.7 | 1.7 | 46% | 75% | 14% |
| Intestine, Large | 2.1 | 0.8 | 42% | 74% | 14% |
| Intestine, Small | 3.6 | 2.7 | 51% | 70% | 17% |
| Kidneys | 1.4 | 0.2 | 70% | 76% | 14% |
| Liver | 1.6 | 0.4 | 64% | 79% | 13% |
| Lung | 3.3 | 3.0 | 69% | 81% | 20% |
| Muscles | 0.6 | −0.2 | 42% | 69% | 13% |
| Skin | −0.9 | −1.5 | 51% | 69% | 14% |
| Stomach | 1.9 | 0.6 | 75% | 72% | 26% |
The oSAR uncertainty is larger than for the wbSAR, mainly due to the relative changes in the oSAR to wbSAR ratio at different ages. Additionally, the uncertainty of scaling effects on the oSAR is larger compared to wbSAR, and has a normal distribution with standard deviation of approximately 3% for male rats, 23% for female rats, 7% for male mice, and 24% for female mice. The larger uncertainty for female models when compared to the male models is due to the larger scaling uncertainty for female models. The instantaneous variation is analyzed based on the five postures in the same way as for the wbSAR evaluation. The oSAR lifetime variation is again identical to that of the wbSAR.
V. Discussion and Conclusion
Constant SAR levels, corresponding to the NTP target dose, were maintained over the entire life time of the rodents by adjusting the incident field strength according to the derived function. The wbSAR level for the rodents, averaged over the animal’s life time is within an expanded uncertainty (k=2) of ~50%. The individual SAR levels for rodents in each group are expected to be within instantaneous variations (k=1) of ~13%, and 6% over the lifetime. The spread of organ and tissue specific SAR levels were less than 13 dB and less than 5dB without the low conductivity tissues bone, fat and connective tissues.
The NTP protocols required highest possible exposure and maximum uniformity of the SAR distribution whereas the upper SAR limit was determined by the thermal pilot study. In the low dose exposure group, the SAR levels in the organs and tissues exceed or are close to the localized SAR limit for the general public of 2W/kg defined in ICNIRP standard [2] for human exposure, except for a few low-water content tissues. For example, the SAR averaged over the whole brain is >2.4 W/kg for mice, and >1.3 W/kg for rats. Furthermore, the psSAR and oSAR have larger uncertainty compared to the wbSAR. Deviations of the SAR level from the target dose, especially during the early exposure period, should be carefully evaluated in the interpretation of the final biological studies. However, the uncertainty and variation values in the exposure system used in the present studies are considerably smaller than that for other exposure studies such as PERFORM A in [8] for the mice and [9] for the rats. This is due to the high homogeneity exposure environment of the reverberation chamber system and reduced influence of the rodents on the setup over the exposure time.
This paper presents the detailed analysis of the life-time dosimetry for 3080 individually housed mice and rats exposed to simulated cell-phone radiation fields inside the reverberation chamber exposure system that was custom-made and optimized for the NTP study [3]. It includes the analysis of the absolute and relative uncertainties and the instantaneous and life-time variations. These detailed dosimetric results empowers the comparison with any future and past study and provide a comprehensive reference for studies of long-term biological effects of the exposure of rodents to RF energy.
Acknowledgments
This work was funded by the Contract No. HHSN29120055544 (ADB No. N01-ES-55544) from the National Toxicology Program, National Institute of Environmental Health Sciences, NIH. The authors want to sincerely thank Prof. Quirino Balzano for his suggestions and discussions.
Work partially supported by the United States government, not protected by United States copyright.
Biographies

Yijian Gong received her M.S. and Ph.D degrees from the Technical University Munich, Germany, and the Swiss Federal Institute of Technology (ETH) Zurich (ETHZ), Switzerland, in 2008 and 2016, respectively. From 2009 to 2015, she worked at the ITIS Foundation in Zurich, Switzerland. Her research interest is in bioelectromagnetics, electromagnetic exposure safety analysis and dosimetry assessment within in vitro and in vivo studies.

Myles Capstick received his B.Sc. and Ph.D. degrees from the University of Wales in Bangor in 1987 and 1991, respectively. He was appointed as a lecturer in the School of Electronic Engineering Science at the University of Wales, Bangor in 1990. He moved to The University of York, Department of Electronics in 1996, where he was first a lecturer and latterly a senior lecturer. In May of 2006 Myles joined the ITIS Foundation in Zurich, Switzerland. His expertise is across a wide range of areas encompassing RF, microwave and mm-wave systems, circuits, antennas and measurements, communications systems, EMC and dosimetry. Myles research interests are in electronic engineering science for biomedical and health risk assessment applications. He has experience of the design and manufacture of RF equipment for use in dosimetry and in particular the equipment used in all the human volunteer trials within the Mobile Telecommunications and Health Research Programme of the UK Department of Health as well as studies using human phantoms. For in-vitro and in-vivo research he has designed systems including: reverberation chamber systems, resonant TEM line systems, systems for live imaging of cells during exposure to both ELF and RF. Within the medical research field, RF hyperthermia and magnetic nano-particle hyperthermia equipment, MRI RF and gradient field exposure test systems for medical implant safety assessment are areas of activity. He has also worked on health risk and occupational exposure assessment of body worn antennas, wireless power transfer devices and MRI. Furthermore, he has developed new measurement instrumentation for improved assessment of safety in EM fields and for measurement of miniature body worn devices.

Sven Kuehn received his Dipl. Ing. (MSc) in Information and Communication Technologies from Chemnitz University of Technology, Germany in 2004. At the end of 2004, he joined the IT?IS Foundation, Switzerland, where he started to work on numerical and experimental methods for the assessment of human exposure to electromagnetic fields. In 2005, he also joined the Integrated Systems Laboratory (IIS) at the ETH Zurich to start working towards his Ph.D. in Electrical Engineering. In August 2009, Sven joined Schmid and Partner Engineering, where he heads sensor design, pursuing Research and Development work towards a new product generation of miniature electro-optical sensors. He also leads the development of the DASY NEO product and EMC analysis tools. In September 2009, Sven completed his Ph.D. and was awarded the ETH Zurich Medal and the Prize of the Hans Eggenberger Foundation. Sven became a co-founder of Zurich MedTech (ZMT) in 2006. His main research interests include experimental and numerical dosimetry in bioelectromagnetics, classical electromagnetic compatibility, near-field sensor, radio-frequency circuit, and antenna design, and optics as well as bio-medical applications thereof. Sven is the author or co-author of numerous journal and conference papers as well as book chapters and serves as a scientific reviewer for various journals.

Perry F. Wilson (S78M82SM93F05) received the Ph.D. degree in electrical engineering from the University of Colorado, Boulder, CO, USA, in 1983. He currently leads the RF Fields Group in the RF Technology Division of the National Institute of Standards and Technology, Boulder, CO. His research has focused on the application of electromagnetic theory to problems in electromagnetic compatibility and RF field metrology. Dr. Wilson is a member of US IEC TC77B TAG, past Editor-in-Chief of the IEEE EMC Transactions, a recipient of a 2010 IEEE EMC Society Technical Achievement Award, a recipient of the 2002 IEEEEMC Transactions Best Paper Award, and a recipient of a 2007 US Department of Commerce Gold Medal.

John M. Ladbury was born in Denver, CO, in 1965. He received the B.S.E.E. and M.S.E.E. degrees (specializing in signal processing) from the University of Colorado, Boulder, in 1987 and 1992, respectively. Since 1987, he has been involved in Electromagnetic Compatibility (EMC) metrology and facilities at Radio Frequency Technology Division, National Institute of Standards and Technology, Boulder, CO. His research interests include reverberation chambers, with some investigations into other EMC-related topics such as time-domain measurements and probe calibrations. Mr. Ladbury was involved in the revision of Radio Technical Commission for Aeronautics DO160D and is a member of the International Electrotechnical Commission joint task force on reverberation chambers. He has received three Best Paper Awards at IEEE International EMC symposia for the last six years.

Galen Koepke received the B.S.E.E. degree from the University of Nebraska, Lincoln, in 1973, and the M.S.E.E. degree from the University of Colorado, Boulder, in 1981. He has contributed, over the years, to a wide range of electromagnetic issues such as measurements and research looking at emissions, immunity electromagnetic shielding, probe development, antenna and probe calibrations, and generating standard electric and magnetic fields. Much of this work has focused on Transmission electron microscopy cell, anechoic chamber, open-area-test-site, and reverberation chamber measurement techniques along with a portion devoted to instrumentation software and probe development. He is currently a Project Leader for the Field Parameters and electromagnetic compatibility (EMC) Applications Program, Radio-Frequency Fields Group, National Institute of Standards and Technology (NIST), Boulder, CO. The goals of this program are to develop standards and measurement techniques for radiated electromagnetic fields and to apply statistical techniques to complex electromagnetic environments and measurement situations. A cornerstone of this program has been the work of NIST on complex cavities such as the reverberation chamber, aircraft compartments, etc. Mr. Koepke is a National Association of Radio and Telecommunications Engineers (NARTE) certified EMC Engineer.

David L McCormick Ph.D., D.A.B.T. is Senior Vice-President and Director of IIT Research Institute (Chicago, Illinois) and Professor of Biology at the Illinois Institute of Technology. Dr. Mc-Cormicks primary research activities are in the areas of carcinogenesis and cancer prevention, non-clinical toxicology, and the biological effects of magnetic fields. He currently leads five NCI-funded programs focused on non-clinical drug development for cancer prevention and therapy and an NIEHS-NTP funded program investigating the toxicology and potential oncogenicity of cell phone radiofrequency fields. He is a board-certified toxicologist (Diplomate, American Board of Toxicology). Dr. McCormick has published more than 300 research papers, abstracts, reviews, and book chapters. He is a member of the Editorial Boards of three scientific journals (Toxicology; Nutrition and Cancer; PLosOne) and is a regular reviewer of manuscripts submitted for publication in journals in the subject areas of cancer biology, drug development, and non-ionizing radiation. Dr. McCormick also regularly serves on grant and contract review committees for the National Institutes of Health and other funding agencies.

Ronald L Melnick is an independent consultant, had been a Senior Toxicologist in the National Toxicology Program (NTP) at the National Institute of Environmental Health Sciences (NIEHS), National Institutes of Health in Research Triangle Park, North Carolina for more than 28 years. As Director of Special Programs in the NTP, Dr. Melnick led the team that designed the NTP studies on the potential toxicity and carcinogenicity of cell phone radio frequency radiation in laboratory animals. Dr. Melnick received his B.S. degree from Rutgers University and his Ph.D. in food science/biochemistry from the University of Massachusetts in Amherst. He was a postdoctoral research fellow in the Department of Physiology-Anatomy at the University of California in Berkeley and then an assistant professor of Life Sciences at the Polytechnic Institute of New York. He has authored or co-authored more than 140 journal publications, book chapters, and technical reports related to the potential health effects of environmental agents. Dr. Melnick has organized several national and international symposiums and workshops on health risks associated with exposure to environmental and occupational toxicants, and he has served on numerous scientific review boards and advisory panels, including those of the International Agency for Research on Cancer, the US Environmental Protection Agency, and the European Commission.

Niels Kuster received the M.Sc. and Ph.D. degrees in electrical engineering from the Swiss Federal Institute of Technology (ETH) Zurich, Switzerland. From 1993 to 1999, he worked in the Department of Electrical Engineering as an Assistant Professor before becoming a Professor with the Department of Information Technology and Electrical Engineering at ETH Zurich in 2001. Since 1999, he has been the Founding Director of the Foundation for Research on Information Technologies in Society (ITIS), Zrich, Switzerland. In 2010, he initiated the sister institute ITIS USA, a nonprofit research unit incorporated in the State of Maryland, of which he is currently the President. During his career, he has been an Invited Professor with the Electromagnetics Laboratory of Motorola Inc., Fort Lauderdale, FL, and, in 1998, with the Metropolitan University, Tokyo, Japan. He also founded several spin-off companies: Schmid & Partner Engineering AG, MaxWave AG, NFT Holding AG, and Zurich MedTech AG and advises other companies as a board member. He has authored or coauthored over 700 publications (books, journals, and proceedings) on measurement techniques, computational electromagnetics, computational life sciences, dosimetry and exposure assessments, and bioexperiments. His primary research interests are in EM technologies, in silico tissue models and personalized medicine. Dr. Kuster is a member of several standardization bodies and serves as a consultant on the safety of mobile communications for government agencies around the globe. He is a Fellow of the IEEE Society, a delegate of the Swiss Academy of Science, and an associate editor of IEEE Transactions on Electromagnetic Compatibility. He served as the President of the Biolectromagnetics Society from 2008–2009 and as a member of various editorial boards. In 2012, he received the prestigious d’Arsonval Award, the highest scientific honor of the Bioelectromagnetics Society.
Footnotes
Certain commercial equipment, instruments, or materials are identified in this paper in order to specify the experimental procedure adequately. Such identification is not intended to imply recommendation or endorsement by the National Institute of Standards and Technology.
Contributor Information
Yijian Gong, IT’IS Foundation, Switzerland.
Myles Capstick, IT’IS Foundation, Switzerland.
Sven Kuehn, IT’IS Foundation, Switzerland.
Perry Wilson, NIST, 325 Broadway, Boulder, CO 80305, USA.
John Ladbury, NIST, 325 Broadway, Boulder, CO 80305, USA.
Galen Koepke, NIST, 325 Broadway, Boulder, CO 80305, USA.
David L McCormick, IIT Research Institute, 10 West 35th Street, Chicago, IL 60616, USA.
Ronald L Melnick, North Logan, UT, 84341 USA. (formerly of NTP/NIEHS).
Niels Kuster, IT’IS Foundation and the Swiss Federal Institute of Technology, Switzerland.
References
- 1.International Agency for Research on Cancer. Non-ionizing radiation, part 2: Radiofrequency electromagnetic fields. IARC monographs on the evaluation of carcinogenic risks to humans. 2013;102 [PMC free article] [PubMed] [Google Scholar]
- 2.ICNIRP. Guidelines for limiting exposure to time-varying electric, magnetic and electromagnetic fields (up to 300 GHz) Health Phys. 1998;74(4) [PubMed] [Google Scholar]
- 3.NTP. Cell phone radiofrequency radiation studies. 2014 available: http://biorxiv.org/content/early/2016/06/23/055699.full.pdf.
- 4.Wyde M, Cesta M, Blystone C, Elmore S, Foster P, Hooth M, Kissling G, Malarkey D, Sills R, Stout M, Walker N, Witt K, Wolfe M, Bucher J. Report of partial findings from the national toxicology program carcinogenesis studies of cell phone radiofrequency radiation in Hsd: Sprague dawley® sd rats (whole body exposure) bioRxiv. 2016 [Online]. Available: http://biorxiv.org/content/early/2016/06/23/055699.
- 5.Kuster N, Berdinas-Torres V, Nikoloski N, Frauscher M, Kainz W. Methodology of detailed dosimetry and treatment of uncertainty and variations for in vivo studies. Bioelectromagnetics. 2006;27:378–391. doi: 10.1002/bem.20219. [DOI] [PubMed] [Google Scholar]
- 6.Kainz W, Nikoloski N, Oesch W, Berdinas-Torres V, Fröhlich J, Neubauer G, Kuster N. Development of novel whole-body exposure setups for rats providing high efficiency, national toxicology program (NTP) compatibility and well-characterized exposure. 2006:5211–5229. doi: 10.1088/0031-9155/51/20/009. [DOI] [PubMed] [Google Scholar]
- 7.Capstick M, Kuster N, Kuehn S, Berdinas Torres V, Gong Y, Wilson P, Ladbury J, Koepke G, McCormick D, Gauger J, Melnick R. A radio frequency radiation reverberation chamber exposure system for rodents. Submitted to IEEE Trans EMC in September. 2016 doi: 10.1109/TEMC.2017.2649885. [DOI] [PMC free article] [PubMed] [Google Scholar]
- 8.Tillmann T, Ernst H, Ebert S, Kuster N, Behnke W, Rittinghausen S, Dasenbrock C. Carcinogenicity study of gsm and dcs wireless communication signals in b6c3f1 mice. Bioelectromagnetics. 2007;28(3):173–187. doi: 10.1002/bem.20283. [DOI] [PubMed] [Google Scholar]
- 9.Smith P, Kuster N, Ebert S, Chevalier H. GSM and DCS wireless communication signals: combined chronic toxicity/carcinogenicity study in the wistar rat. Radiation research. 2007;168(4):480–492. doi: 10.1667/RR0680.1. [DOI] [PubMed] [Google Scholar]
- 10.Hasgall PA, Neufeld E, Gosselin M, Klingenböck A, Kuster N. IT’IS database for thermal and electromagnetic parameters of biological tissues version 2.2. 2012 www.itis.ethz.ch/database.
- 11.Gabriel S, Lau RW, Gabriel C. The dielectric properties of biological tissues: III. Parametric models for the dielectric spectrum of tissues. Physics inMedicine and Biology. 1996;41(11):2271. doi: 10.1088/0031-9155/41/11/003. [DOI] [PubMed] [Google Scholar]
- 12.IEEE Std C95.1-2005. IEEE standard for safety levels with respect to human exposure to radio frequency electromagnetic fields, 3 kHz to 300 GHz. International Committee on Electromagnetic Safety, The Institute of Electrical and Electronics Engineers; 2006. [Google Scholar]
- 13.Hill DA. Electromagnetic theory of reverberation chambers. NIST Technical note. 1998;(1506) [Google Scholar]
- 14.Kildal PS, Orlenius C. Characterization of mobile terminals in rayleigh fading by using reverberation chamber. Applied Electromagnetics and Communications, 2005 ICECom 2005 18th International Conference on. 2005:1–4. [Google Scholar]
- 15.Hill DA. Plane wave integral representation for fields in reverberation chambers. Electromagnetic Compatibility, IEEE Transactions on. 1998;40(3):209–217. [Google Scholar]
- 16.Moglie F, Pastore AP. FDTD analysis of plane wave superposition to simulate susceptibility tests in reverberation chambers. Electromagnetic compatibility, IEEE transactions on. 2006;48(1):195–202. [Google Scholar]
- 17.Wu T, Hadjem A, Wong M-F, Gati A, Picon O, Wiart J. Whole-body new-born and young rats’ exposure assessment in a reverberating chamber operating at 2.4 GHz. Physics in Medicine and Biology. 2010;55(6):1619. doi: 10.1088/0031-9155/55/6/006. [DOI] [PubMed] [Google Scholar]
- 18.De Leo R, Primiani VM, Moglie F, Pastore AP. SAR numerical analysis of the whole human body exposed to a random field. Electromagnetic Compatibility, 2009 EMC 2009 IEEE International Symposium on. 2009 Aug;:81–86. [Google Scholar]
- 19.Holman JP. Heat transfer. 9th. New York, Boston: McGraw-Hill, Inc; 2002. pp. 168–169. [Google Scholar]
- 20.Ebert S. Emf risk assessment: Exposure systems for large-scale laboratory and experimental provocation studies. Eidgenoessische Technische Hochschule ETH Zurich Nr 18636. 2009 [Google Scholar]
- 21.Gong Y, Capstick M, Tillmann T, Dasenbrock C, Samaras T, Kuster N. Desktop exposure system and dosimetry for small scale in vivo radiofrequency exposure experiments. Bioelectromagnetics. 2016;37(1):49–61. doi: 10.1002/bem.21950. [Online]. Available: http://dx.doi.org/10.1002/bem.21950. [DOI] [PubMed] [Google Scholar]
- 22.GUM: Guide to the expression of uncertainty in measurement. 2008 [Online]. Available: http://www.bipm.org/en/publications/guides/gum.html.
- 23.Taylor BN, Kuyatt CE. Guidelines for evaluating and expressing the uncertainty of nist measurement results. NIST Technical note. 1994;(1297) [Google Scholar]
- 24.Senic D, Holloway CL, Ladbury JM, Koepke GH, Sarolić A. Absorption characteristics and sar of a lossy sphere inside a reverberation chamber. Electromagnetic Compatibility (EMC Europe), 2014 International Symposium on. 2014 Sep;:962–967. [Google Scholar]


