

Summary
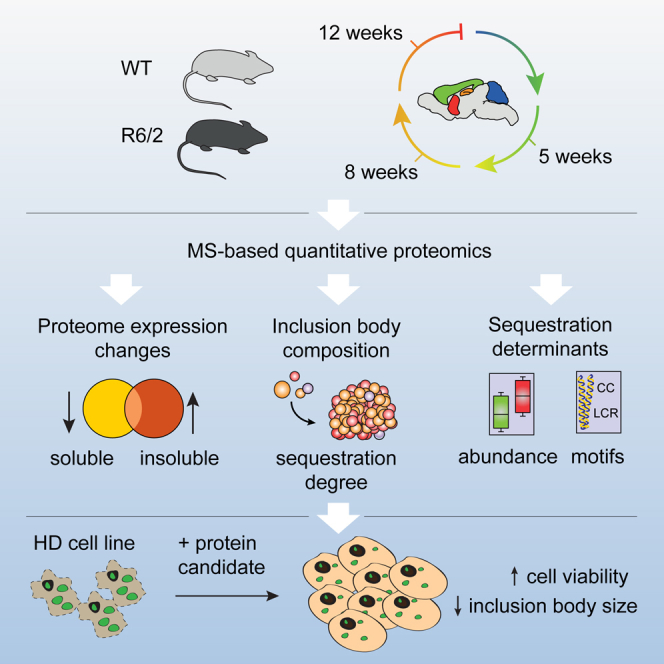
Aggregation of polyglutamine-expanded huntingtin exon 1 (HttEx1) in Huntington’s disease (HD) proceeds from soluble oligomers to late-stage inclusions. The nature of the aggregates and how they lead to neuronal dysfunction is not well understood. We employed mass spectrometry (MS)-based quantitative proteomics to dissect spatiotemporal mechanisms of neurodegeneration using the R6/2 mouse model of HD. Extensive remodeling of the soluble brain proteome correlated with insoluble aggregate formation during disease progression. In-depth and quantitative characterization of the aggregates uncovered an unprecedented complexity of several hundred proteins. Sequestration to aggregates depended on protein expression levels and sequence features such as low-complexity regions or coiled-coil domains. In a cell-based HD model, overexpression of a subset of the sequestered proteins in most cases rescued viability and reduced aggregate size. Our spatiotemporally resolved proteome resource of HD progression indicates that widespread loss of cellular protein function contributes to aggregate-mediated toxicity.
Keywords: Huntington’s disease, inclusion bodies, cerebrospinal fluid, neurodegeneration, quantitative proteomics
Graphical Abstract
Highlights
-
•
Spatiotemporally resolved brain proteome of wild-type and HD mice
-
•
Quantitative characterization of huntingtin inclusion bodies in vivo
-
•
Sequestration correlates with protein expression levels and specific sequence features
-
•
Resupplying sequestered proteins ameliorates HTT-induced toxicity and inclusion size
Hosp et al. use quantitative proteomics to describe the soluble and insoluble proteome of several brain regions in a mouse model of Huntington’s disease at various stages of disease progression. Their findings suggest that widespread sequestration of proteins into mutant huntingtin inclusion bodies contributes to HD pathogenesis.
Introduction
Cellular environment is characterized by very high protein concentrations, increasing the danger of aggregation. Thus, maintenance of protein solubility is a fundamental aspect of cellular homeostasis. Aggregates play a prominent role in many neurodegenerative diseases (NDDs) (Ross and Poirier, 2004). Misfolding and aggregation can disrupt cellular function in two ways, loss of endogenous protein function or gain of a novel toxic function, and there is evidence that both processes occur in disease (Winklhofer et al., 2008). The aggregation cascade involves multiple intermediate conformations, such as globular and fibrillar structures, up to the late-stage inclusion bodies (IBs) (Knowles et al., 2014).
Huntington’s disease (HD) is an autosomal dominant NDD characterized by neuropsychiatric and motor impairments (Saudou and Humbert, 2016). It is caused by a CAG repeat expansion in exon 1 of the huntingtin (HTT) gene, which leads to an expanded polyglutamine (polyQ) stretch in the N terminus of the huntingtin protein (The Huntington’s Disease Collaborative Research Group, 1993). A hallmark of this disorder is the appearance of cytoplasmic and intranuclear huntingtin aggregates (Davies et al., 1997, DiFiglia et al., 1997), which interfere with several cellular processes, such as proteostasis, transcription, vesicular trafficking, and energy metabolism (Orr and Zoghbi, 2007, Saudou and Humbert, 2016).
Obtaining insights into the composition of huntingtin IBs is of particular importance in understanding HD mechanisms. So far, it has been challenging to characterize the protein composition of IBs, because they remain insoluble even in very high detergent concentrations. Efforts to purify late-stage polyQ aggregates culminated in the identification of only a few tens of proteins, mainly heat shock factors (Mitsui et al., 2002), components of the ubiquitin-proteasome pathway (Doi et al., 2004), and certain transcription factors (Dunah et al., 2002, Shimohata et al., 2000). Given the size of the IBs—up to several micrometers (Gutekunst et al., 1999)—it is likely that they contain far more proteins. Moreover, the quantitative composition of IBs and its variation among brain regions is almost entirely unknown.
Mass spectrometry (MS)-based quantitative proteomics is powerful technology for systems-wide analysis of complex cellular processes (Aebersold and Mann, 2016). To date, proteomic approaches exploring HD pathogenesis have focused either on expression level changes or on soluble huntingtin interactions (Culver et al., 2012, Langfelder et al., 2016, Shirasaki et al., 2012). In contrast, knowledge of the interplay between soluble and insoluble aspects of the proteome is limited (Baldo et al., 2012), particularly when following disease progression over time and in differentially affected brain regions.
Here, we investigate molecular neurodegeneration signatures in a mouse HD model by MS-based quantitative proteomics with spatiotemporal resolution. We describe the soluble and insoluble proteomes of four brain regions, as well as the cerebrospinal fluid proteome at three time points of disease progression. Acid-based hydrolysis of the aggregates allows us to characterize them in depth by quantitative MS. Our data enable comparison of the degree of protein sequestration from the soluble pool to IBs over time, as well as analysis of sequence features of the sequestered proteins. Functional follow-up in a cellular HD model reveals that increasing expression levels of sequestered proteins in many cases restores cellular function and alters the nature of HttEx1 aggregates, suggesting that widespread loss of protein function due to sequestration contributes to HD pathogenesis.
Results
R6/2 transgenic mice express N-terminal exon 1 of polyQ-expanded huntingtin under control of the human huntingtin promoter (Mangiarini et al., 1996). For our analysis of neurodegeneration-associated proteome changes, we selected an early time point at 5 weeks, before disease onset; an intermediate time point at 8 weeks, on the verge of visible motor deficits; and a late time point at 12 weeks, at the end of the lifespan of R6/2 mice (Carter et al., 1999, Davies et al., 1997). We prepared soluble and insoluble extracts from four brain regions (striatum, cortex, hippocampus, and cerebellum), which show differential vulnerability to HD, with striatum being most severely affected and cerebellum remaining relatively spared until advanced disease stages (Vonsattel and DiFiglia, 1998). To relate the proteome changes in the brain to those in a proximal body fluid, cerebrospinal fluid was also analyzed (Figure 1).
Figure 1.

Experimental Design
Brain regions from R6/2 and WT mice were assessed by quantitative LC-MS/MS. From each tissue sample, soluble and insoluble proteomes were measured. IBs were enriched by repetitive SDS washes and hydrolyzed in formic acid. Cerebrospinal fluid from each mouse was also analyzed. Number of animals: 5 weeks, 4 R6/2 and 4 WT; 8 weeks, 3 R6/2 and 3 WT; 12 weeks, 4 R6/2 and 4 WT.
Spatiotemporal Brain Proteome Resource of Wild-Type Mice
Recently, we compiled an in-depth cell-type- and region-specific proteomic catalog of the adult mouse brain with a depth of ∼13,000 proteins (Sharma et al., 2015). Building on that analysis by using the peptide identifications as a library (Supplemental Experimental Procedures), we now identified 12,498 proteins in the soluble proteome alone using single-run liquid chromatography-tandem mass spectrometry (LC-MS/MS). Of these, we chose 8,455 proteins by stringent filtering for valid values (Figure 2A; Table S1A; Supplemental Experimental Procedures). Correlation analysis indicated a high degree of reproducibility between replicates (R = 0.84 overall; R = 0.90 for biological replicates) (Figure S1A). First, we investigated the soluble proteome of wild-type (WT) controls. Protein abundances spanned seven orders of magnitude, with only 217 proteins amounting to 50% of the total protein mass (Figure 2A). Gene Ontology (GO) biological processes correlated with overall protein abundances in expected ways (Figure 2A; Tables S1B and S1C). High-abundant proteins tended to have a smaller molecular mass (Figure 2B), as in other tissues (Wiśniewski et al., 2014), presumably reflecting evolutionary constraints on biosynthesis costs (Warringer and Blomberg, 2006). Our approach uncovered several brain region-specific protein clusters (Lein et al., 2007, Sharma et al., 2015). For instance, proteins involved in dopaminergic signaling were enriched in the striatum, which receives extensive dopaminergic innervation (Figure 2C; Table S1D) (Gerfen and Surmeier, 2011). As expected for the narrow time window of the analysis compared to the lifespan of WT animals, little changes in protein expression were detected at different time points (Figure S1B) (Walther and Mann, 2011). Collectively, our soluble brain region data of WT mice provide a comprehensive resource for the community, with copy numbers and spatiotemporal resolution for almost 8,500 proteins.
Figure 2.

Spatiotemporal Brain Proteome Resource
(A) Ranking of brain proteins by iBAQ (intensity-based absolute quantification) copy numbers from highest to lowest. Strongest enrichment for each quartile is displayed for GO categories “biological process” and “cellular component”; BH-FDR, Benjamini-Hochberg-corrected false discovery rate. Cumulative protein mass from the highest to the lowest abundant protein shows that only a few proteins make up most of the protein mass.
(B) iBAQ copy numbers for ∼8,500 proteins inversely correlate with molecular mass. Data points are colored by local point density.
(C) Spatial resolution exposes functional brain region specificity. Three selected clusters display distinct protein expression across the four regions. p value, BH-FDR corrected; EF, enrichment factor of the most enriched GO term; MaxLFQ intensity, normalized label-free protein intensity.
Extensive Brain Proteome Remodeling during Disease Progression in R6/2 Mice
Principal-component analysis (PCA) on the spatiotemporally resolved soluble proteomes of R6/2 and WT mice showed clear separation of samples with two major effects (Figure 3A). First, R6/2 mice after disease onset (8 and 12 weeks) were separated from other samples, reflecting extensive protein remodeling during pathogenesis (Figure 3A). Second, cerebellar proteomes were strongly separated from other brain regions. Only a few proteins were responsible for driving separation in the PCA (Figure 3B). Spatial drivers included brain region-specific proteins, whereas age- and disease-driving proteins were enriched for GO terms such as “regulation of synaptic part” (p < 6.0E−19, Benjamini-Hochberg-corrected false discovery rate [BH-FDR]), “neuron projection” (p < 1.4E−12), or “associated with oxidative phosphorylation” (p < 7.5E−9).
Figure 3.

Drastic Proteome Remodeling of R6/2 Mice after Disease Onset
(A and B) PCA projections (A) and PCA loadings (B) of all soluble samples reveal specific effects on the proteome driven by the genotype, age, and differential spatial expression. Data points in (B) are colored by local point density.
(C) Hierarchical clustering of protein expression over time shows substantial proteome shifts from early stages of HD onward. The two most upregulated (red and orange) or downregulated (blue and cyan) clusters are indicated.
(D) Top 20 Euclidean distance tracking of protein expression profiles similar to Pde10a over time and across brain regions; gray boxes indicate striatal expression (upper panel). Boxplots of Z-scored MaxLFQ intensities for the striatal top 20 set (lower panel). Reduced expression of all targets in R6/2 samples compared to WT.
See also Figure S2.
To identify significant differences among the genotypes, brain regions, and time points, we employed three-way ANOVA. This revealed hundreds of significant protein changes for each of the three factorial groups and their combinations (Figure S2A). Concordant with the PCA results, the three individual groups exhibited similar numbers of significant protein changes. The combination of age and genotype contributed almost as much as age and genotype separately, indicating that age and genotype jointly drove the extensive proteome remodeling in our dataset. To investigate spatiotemporal changes of the soluble proteome in more detail, we tested for differences in any functional annotations to the background protein distribution and observed that protein annotations changed spatiotemporally and in accordance with known features of HD progression (Figure S2B; Supplemental Experimental Procedures) (Geiger et al., 2012). One example is the increased expression of proteins involved in neurotransmitter secretion at early disease stages in hippocampus and striatum (8 weeks) followed by a decrease at later stages (12 weeks) (Chen et al., 2013). Another finding is the loss of protein expression associated with the calcineurin complex in the cortex (Gratuze et al., 2015). We have compiled a list of annotation changes across brain regions and time (Table S1E) and find many potentially interesting clues for the selective spatial disease progression, such as reduced cortical expression of annotations associated with amino acid import and ion transmembrane transporter activity or reduced striatal expression of annotations associated with mRNA splicing (Figure S2B). Hence, our dataset provides a rich resource of brain region-specific changes in R6/2 mice to formulate testable hypotheses about HD pathogenesis.
Expression profiles of R6/2 and WT animals at 5 weeks were largely identical, although specific protein clusters already exhibited different expression (Figure 3C). Just three weeks later, expression of mutant HttEx1 caused extensive remodeling of the proteome with marked up- and downregulation of thousands of proteins (Figure 3C, colored clusters). The two upregulated clusters were enriched in proteins of the chaperonin containing TCP1 complex (cluster 2, p < 2.0E−4, BH-FDR) and proteasome accessory complex (cluster 3, p < 4.0E−3), whereas the two downregulated clusters were enriched in proteins associated with the ribosome (cluster 1, p < 9.5E−4) and energy transport across the mitochondrial electron transfer chain (cluster 4, p < 9.0E−4) (Table S1F). This is consistent with the deficient energy metabolism and impairment of the ubiquitin-proteasome system in HD (Acuña et al., 2013, Ortega and Lucas, 2014). Our analysis now provides the underlying protein changes in the R6/2 model on a proteome-wide scale.
A hallmark of HD neuropathology is the selective degeneration of striatal medium spiny neurons (MSNs), which has been linked to transcriptional dysregulation of cyclic AMP (cAMP) and CREB signaling (Vonsattel and DiFiglia, 1998, Wyttenbach et al., 2001). We found Pde10a, a cAMP or cyclic guanosine monophosphate (cGMP)-hydrolyzing enzyme highly enriched in MSNs, to be markedly downregulated in R6/2 striatum (Figure 3D). It is one of the earliest and most significantly downregulated gene products in HD patients and a promising target to restore cyclic nucleotide (cNMP) signaling in affected neurons (Giampà et al., 2010). Furthermore, Pde10a ligands are used in positron emission tomography (PET) to assess the extent of disease and predict conversion to HD (Russell et al., 2014).
We next asked whether other proteins follow the same profile and thus might serve as markers of HD progression. Following the Euclidean distance of the top 20 expression profiles most similar to Pde10a revealed a set of proteins with interrelated functions, such as cNMP metabolism, neurotransmitter, and specifically dopaminergic signaling (Figure 3D; Figure S2C). The first group included Pde10a-related Pde1b, as well as Darpp-32, which is widely used as a marker for both MSNs and the attenuation of dopaminergic signaling in HD (Jiang et al., 2011). Further candidates were also associated with dopamine metabolism, such as Drd1, a dopamine receptor expressed in MSNs whose striatal loss correlates with cognitive decline (Chen et al., 2013). Adenylate cyclase 5 (Adcy5) is predominantly expressed in the striatum and has been linked to rarer forms of chorea and dystonia (Carapito et al., 2015). A transcriptomics and proteomics study identified 17 of our 21 potential markers among the top 50 hub genes of a striatal module negatively associated with CAG repeat length in a different HD mouse model (Langfelder et al., 2016). Thus, our data define a set of MSN-specific proteins that can be used to assess cNMP-linked dopaminergic imbalances.
Inflammatory Profile in the Cerebrospinal Fluid Proteome
The cerebrospinal fluid is an invaluable source in assessing pathological alterations of the CNS (Kroksveen et al., 2011). We next asked whether HD signatures in the soluble brain proteome correlate with changes in the cerebrospinal fluid. A total of 778 cerebrospinal fluid proteins were quantified with our single-shot workflow after filtering out likely contaminants (Table S2A; Supplemental Experimental Procedures). Unsupervised hierarchical clustering separated R6/2 and WT samples, indicating changes in protein secretion to the cerebrospinal fluid upon expression of mutant HttEx1 (Figure 4A). Among the most dysregulated proteins we found peptidase regulators increased in the cerebrospinal fluid of R6/2 mice (Figures 4B and 4C; Table S2B). The presence of proteolytic enzymes reflects inflammatory processes, and our data suggest that several members of the cathepsin family dominantly contribute to these processes, because they are major drivers of the PCA separation between R6/2 and WT samples (Ossovskaya and Bunnett, 2004). Finally, we compared correlations of protein expression changes between the brain and the cerebrospinal fluid proteome (Figure 4D). Although expression changes in the brain over time correlated between R6/2 mice (R > 0.5), the correlation between soluble brain proteomes and cerebrospinal fluid was low (R < 0.1) (Figure 4D). This indicates that global expression changes in the soluble proteome are not necessarily reflected in the cerebrospinal fluid proteome.
Figure 4.

Altered Cerebrospinal Fluid Proteome in R6/2 Mice
(A) Hierarchical clustering of cerebrospinal fluid protein expression reveals good separation of R6/2 and WT mice; row bars indicate filters for known GO annotations related to secretion (see Supplemental Experimental Procedures for details).
(B) PCA projections of all cerebrospinal fluid samples show good separation between WT and R6/2 mice.
(C) Corresponding PCA loadings of (B) reveal strong inflammatory response in R6/2 animals. The color bar displays the 1D annotation score with the two most enriched annotations for R6/2 mice; the annotation score indicates the center of the protein distribution of each significant annotation category relative to the overall distribution of values. p value, BH-FDR corrected.
(D) Correlation of protein expression changes between different disease stages is high within the soluble proteome (purple inlay) but low for the comparison of the soluble proteome with the cerebrospinal fluid (green inlay) of R6/2 mice.
See also Table S2.
In-Depth Characterization of the Insoluble Proteome In Vivo
Huntingtin-containing IBs are a hallmark of HD, but the identity and quantity of their constituent proteins are largely unknown. In agreement with previous studies (Davies et al., 1997, Meade et al., 2002), brains of R6/2 mice already displayed widespread IBs at 5 weeks, with striatal IBs being significantly smaller than cortical ones (Figures S3A–S3C).
Although purification of late-stage aggregates is straightforward due to their extreme insolubility, this biophysical property also makes them resistant to proteolytic digestion, a precondition for MS analysis. Concentrated formic acid can dissolve polyQ aggregates (Hazeki et al., 2000, Kim et al., 2016), and here we demonstrate that it is compatible with tissue-based quantitative proteomics (Figure 1; Supplemental Experimental Procedures). This purification approach, when coupled to state-of-the-art MS, identified several hundred proteins and revealed extensive protein sequestration to the insoluble fraction in the R6/2 brain, including endogenous mouse Htt (Figure S4; Table S3). For quantitative analysis of the aggregate composition, we used the iBAQ (intensity-based absolute quantification) algorithm to estimate protein abundances (Schwanhäusser et al., 2011). Only 10 proteins constituted more than 50% and the top 50 proteins constituted more than 75% of the aggregate mass in 12-week-old R6/2 striatum (Figure 5A). Apart from histones and RNA-binding proteins, these included proteins involved in neuronal plasticity, as well as myelin components (Table S3). Co-immunostainings for the myelin protein Plp1, aggregated HttEx1, and a neuronal marker revealed co-localization of Plp1 with aggregated HttEx1 in many neuronal IBs, confirming that myelin proteins are true components of neuronal inclusions (Figures S3D and S3E).
Figure 5.

In-Depth Characterization of PolyQ Aggregates
(A) Distribution of iBAQ values for 12 week R6/2 striata. Pie chart distribution of annotations for the top 50 proteins.
(B and C) Proteins with dysregulated soluble expression (color coding from Figure 3C) are enriched in R6/2 insoluble fractions, superimposing enrichment for all 12 week brain regions together. The most enriched insoluble proteins and endogenous Htt is indicated.
(D–G) Significant enrichment of proteins with longer polyQ (D) and LCRs (E), more CCDs (F), and higher molecular weight (MW) (G) in 12 week R6/2 over WT striata. Mann-Whitney U test.
See also Figures S3–S5 and Table S3.
Most sequestered proteins contributed little to overall aggregate mass. There was a general tendency for abundant cellular proteins to also be among the more abundant aggregate proteins (median R = 0.40 across all conditions) (Figure S5). GO analysis revealed many proteins associated with native huntingtin function and the proteostasis network to be enriched in the R6/2 insoluble fraction, including known interactors and aggregation modifiers of polyQ-expanded huntingtin. Several members of the TCP-1 ring complex (TRiC) and the Hsp40, Hsp70, and Hsp90 families made up ∼1.5% of the insoluble fraction mass. All five members of the collapsin response mediator protein (Crmp) family, also known as dihydropyrimidinase-related proteins (Dpysl), were also enriched (Figure 5B). A study identified Crmp1 as a suppressor of huntingtin toxicity (Stroedicke et al., 2015). Apart from confirming these known aggregate constituents, our data provide a large number of new proteins with potential links to HD (Table S3A).
We hypothesized that the extensive soluble proteome remodeling in HD should be reflected in the insoluble proteome. Mapping our soluble proteome data to the insoluble fraction revealed a large number of proteins that were downregulated in the soluble proteome and enriched in the aggregates (blue and cyan in Figures 5B and 5C; Figure S4), suggesting widespread loss of protein function by sequestration. Conversely, we also found many proteins that were upregulated in both the soluble and the aggregate proteomes (orange and red in Figures 5B and 5C; Figure S4; Table S3B). Among the latter, the TRiC chaperonin and the GO term “proteasome accessory complex” were highly overrepresented (p < 4.0E−5 and p < 3.2E−3 BH-FDR, respectively) (Table S3E), confirming specific upregulation of chaperones that interact with aggregates but become entangled with them. Potential loss-of-function candidates (reduced in the soluble proteome and increased in the insoluble proteome) often had a significantly higher abundance compared to proteins upregulated in the soluble proteome (Figure S6A), consistent with a sequestration mechanism that depletes the cellular pool of these proteins, thereby impeding cellular function.
Next, we asked whether sequestration into the aggregates correlated with certain biophysical features. We focused on polyQ length, low-complexity regions (LCRs), and coiled-coil domains (CCDs), motifs known to modulate protein aggregation (Fiumara et al., 2010, Kato et al., 2012, Li and Li, 2004, Schaefer et al., 2012). Insoluble fractions from R6/2 striata contained significantly more aggregation-prone proteins than WT controls, with a robust effect size for CCDs and small effect sizes for polyQ and LCRs (Figures 5D–5F; Figures S6B–S6D). In addition, R6/2 samples were significantly enriched for proteins with higher molecular weight (Figure 5G; Figure S6E). Larger proteins tend to be less thermodynamically stable, which may explain why their folding is compromised under conditions of conformational stress (Sharma et al., 2012).
To quantify the degree of sequestration, we estimated absolute protein abundance using the iBAQ algorithm and compared the amount of each protein in the soluble and insoluble proteome (Figure 6A; Figure S6F). Extracellular matrix (ECM) proteins had the least soluble proportion, reflecting their insolubility and demonstrating efficient enrichment of insoluble proteins in our protocol (Figure 6A, marked in red). Endogenous Htt was also recruited into the aggregates (Figure 6A, marked in pink). In concordance with the increase in aggregate size, we observed increased sequestration of protein mass over time, hence progressively depleting the pool of functional proteins. In 8-week-old animals, a full 80% of proteins were at least in a 1:1 ratio in the cortical IBs compared to the soluble pool.
Figure 6.

Functional Attributes of PolyQ Aggregates
(A) Ranking of proteins by iBAQ ratios representing protein sequestration from the soluble to the insoluble proteome in R6/2 cortices. Gray boxes show the number of proteins that were only identified in the insoluble proteome per age group, indicated by infinite iBAQ ratios.
(B) Annotation matrix of protein attributes, such as complexes, gene ontologies, and pathways, highlighting changes in the spatiotemporal composition of the insoluble fraction. The color code indicates normalized median abundance of the proteins belonging to each category relative to the distribution of all proteins. Selected annotations are highlighted. Red, most abundant; blue, least abundant. Mann-Whitney U test (BH-FDR < 0.05).
To determine whether the IB composition varies over time and across brain regions, we tested for differences in any functional annotations to the background protein distribution (Figure 6B; Table S3F; Supplemental Experimental Procedures) and found spatiotemporal changes of protein annotations, reflecting many known features of HD pathogenesis. Transcriptional and epigenetic dysregulation is an early event in HD, and we found that IBs at 5 weeks were already significantly enriched in DNA- and chromatin-binding elements (FDR < 0.05). Conversely, late-stage IBs at 8 to 12 weeks were enriched in proteins associated with glutamate receptor signaling and synaptic transmission, correlating with the onset of motor phenotypes (FDR < 0.05, respectively). Similarly, we observed spatial changes such as enrichment of SMAD-binding proteins in cortical IBs (FDR < 0.05), or depletion of proteins involved in Wnt signaling pathways in striatal IBs (FDR < 0.05), linked to synaptic degeneration (Galli et al., 2014). Our proteomic analysis therefore demonstrates that protein sequestration is both brain region and time specific and may link dynamic changes in the IBs to the phenotype.
Overexpressing Loss-of-Function Candidates Rescues PolyQ Length-Dependent Toxicity and Alters IB Size
We identified several hundred proteins that were depleted from the soluble pool and increased in insoluble aggregates. To test whether this represents widespread loss of protein function, we selected a group of 18 candidates for functional follow-up based on several criteria, including their profiles in the proteomics experiments and association with neuronal functions but no previous link to HD (Figure S7A; Table S4). For several candidates, reduction in protein levels in the soluble fraction was confirmed by western blot (Figure 7A; Figure S7B). Among the selected candidates was the amytrophic lateral sclerosis (ALS)-associated protein hnRNPA2B1. ALS-linked hnRNPA2B1 mutations lead to an accumulation of insoluble protein in the nucleus (Martinez et al., 2016). Immunostaining in R6/2 striatum demonstrated a nuclear accumulation of hnRNPA2B1 in most MSNs, as well as its co-localization with HttEx1 IBs (Figures S7C–S7E).
Figure 7.

Overexpression of Loss-of-Function Candidates Ameliorates HttEx1 Phenotypes
(A) Left: quantification of candidates in immunoblots of 8- and 12-week-old R6/2 striata, normalized to WT (dotted line). Student’s t test, ∗p < 0.05; n = 3–4. Right: representative examples of immunoblots from 12-week-old striata.
(B) Log2 fold changes (log2FCs) in viability of HD-Q23 (upper panel) or HD-Q74 (lower panel) cells transfected with the candidates as measured by lactate dehydrogenase (LDH) assay. Multiple one-tailed t test with Benjamini-Hochberg correction; ∗FDR < 0.05, ∗∗FDR < 0.01; normalized to mCherry controls; n = 4.
(C) Candidates’ effects on the viability of starved, non-induced HD-Q74 cells. Multiple two-tailed t test with Benjamini-Hochberg correction; ∗FDR < 0.05; n = 3.
(D) Log2FCs in IB diameter in HD-Q74 cells transfected with the candidates. Multiple two-tailed t test with Benjamini-Hochberg correction; ∗FDR < 0.05, ∗∗FDR < 0.01; normalized to mCherry; n = 3.
(E) Distribution of IB diameter bins in HD-Q74 cells transfected with the candidates. Yellow, <1 μm; orange, 1–2.5 μm; red, >2.5 μm. Multiple two-tailed t test with Benjamini-Hochberg correction; ∗FDR < 0.05, ∗∗FDR < 0.01; n = 3.
(F) Representative images of HD-Q74 cells transfected with selected candidates. Blue, DAPI; red, myc candidate; green, HttEx1-GFP; scale bar, 20 μm.
(G) Log2FCs in the soluble fraction of proteins after overexpression of candidates in HD-Q74 cells, determined by changes in iBAQ ratios (soluble to insoluble). The red dot indicates the iBAQ ratio of the candidate. Multiple two-tailed t test with Benjamini-Hochberg correction; ∗∗∗FDR < 0.001; n = 3. NCAM1 was not identified in the insoluble fraction in this experiment.
See also Figure S7.
For the follow-up of the selected proteins, we used inducible neuron-like PC12 cells with stably integrated, GFP-tagged HttEx1 with either 23 or 74 glutamines (HD-Q23 and HD-Q74 cells). Induction of HttEx1 led to polyQ length-dependent cell death (Figure S7F) (Wyttenbach et al., 2001). Quantitative proteomics revealed that all candidates were expressed in this cell line with medium to high abundance (Figure S7G), and induction of HttEx1 did not substantially alter their expression (Figure S7H). Furthermore, in most cases, transfection of a candidate increased its protein levels compared to non-transfected controls (Figure S7I). Overexpression of individual candidates significantly improved the viability of HD-Q74 cells in 12 of 18 cases (BH-FDR < 0.05), with a mean survival increase of 40% (Figure 7B, lower panel). Three proteins (Ap2a2, Mapt, and Nfasc) that increased the viability of control HD-Q23 cells (Figure 7B, upper panel) and two proteins that repeatedly exhibited low transfection rates (Dctn1 and Sbf1) were excluded from further analyses. To distinguish between a general effect on cell survival and a specific involvement in mutant HttEx1 toxicity, we tested whether the candidates rescued the viability of non-induced HD-Q74 cells under starvation and observed a rescue with only one protein, Cnp (Figure 7C). Thus, the effects of the remaining candidates were specific for mutant HttEx1 toxicity.
We next asked whether the HttEx1 toxicity-modifying proteins also had an effect on aggregation. Overexpression of the candidates did not change the number of GFP+ foci per cell (Figure S7J) but did reduce their size in 10 of 11 cases (Figure 7D). Moreover, the percentage of small foci (<1 μm in diameter) increased significantly in 8 of the 11 cases, whereas the percentage of large foci (>2.5 μm) was significantly reduced in all cases (Figures 7E and 7F). As an orthogonal approach, we employed membrane filter trap assay, which also did not reveal a significant change in the aggregation load (Figure S7K). Finally, the soluble proportion of most cellular proteins increased significantly after overexpression of the candidates in HD-Q74 cells, as well as, in most cases, the soluble proportion of the candidate (Figure 7G). Thus, overexpression of the proteins sequestered to HttEx1 IBs ameliorates mutant HttEx1 toxicity and decreases aggregate size, but not load.
Discussion
We applied quantitative proteomics to investigate molecular neurodegeneration signatures in an in vivo model of HD. Employing a recently published proteomic resource of the mouse brain (Sharma et al., 2015) and a single-run LC-MS/MS workflow, we characterized the brain proteome of the R6/2 mice and WT controls to a depth of more than 12,000 proteins. Spatiotemporal characterization of the soluble proteome during disease progression uncovered extensive alterations in brain regions vulnerable to HD. The data provide a resource to the community, which is available via a user-friendly database (http://maxqb.biochem.mpg.de/mxdb/). The value of such data is illustrated by the identification of several MSN-specific proteins whose signaling is compromised in HD and that are already used for PET imaging. These clinically relevant proteins emerge from our analysis and thus validate the R6/2 model, which is one of the best characterized and most widely used HD mouse models. Comparative studies demonstrated its extensive similarity with full-length Huntingtin models at pathological, transcriptional, and electrophysiological levels (Cummings et al., 2009, Langfelder et al., 2016, Woodman et al., 2007). Nevertheless, it will be necessary to extend our approach to full-length models in the future.
Furthermore, our dataset contains a number of additional proteins that have closely related expression regulation in the course of HD, making them promising candidates for imaging or other applications. Another example emerged upon matching the soluble brain and cerebrospinal fluid proteomes. Several proteomic analyses have proposed potential biomarkers of HD progression in cerebrospinal fluid, mostly linked to inflammation (Dalrymple et al., 2007, Fang et al., 2009). Here, we also observed a strong inflammatory signature in the cerebrospinal fluid of R6/2 mice. However, proposed biomarkers have failed to be validated for clinical trials (Byrne and Wild, 2016). We found an overall low correlation between changes in the soluble proteome and the cerebrospinal fluid, which needs to be considered when attempting to identify biomarkers in cerebrospinal fluid.
The use of formic acid to chemically cleave aggregated proteins, in combination with quantitative MS, enabled us to perform the first in-depth characterization of HttEx1 aggregates in vivo and in a stage- and brain region-dependent manner. This generic approach provides an unbiased tool to study insoluble aggregates in other misfolding diseases. In the case of HD, we find that the insoluble fraction containing late-stage HttEx1 aggregates consists of several hundred proteins, concordant with the very large size of IBs in model systems and patients. Just a few proteins, generally only expressed in the brain, make up the bulk of the aggregate mass. This suggests that the aggregate composition in HD, and perhaps in other NDDs, is highly tissue specific. The presence of several myelin-associated proteins was surprising, because these are expressed mainly in glial cells. However, in our recent brain proteome resource (Sharma et al., 2015), as well as in the Human Protein Atlas (Uhlén et al., 2015), myelin was also detected in neurons, and we could confirm the presence of Plp1 in IBs by immunostaining. Therefore, we believe that these proteins derive mostly from neuronal IBs, not from oligodendrocytes.
Few aggregate constituents were known previously, such as proteostasis network components, native huntingtin interactors, and several transcription factors. However, most identified proteins represent diverse biological functions. We found that these proteins are rich in aggregation-prone motifs, such as CCDs or LCRs. CCDs and LCRs are molecular recognition motifs, regulating oligomerization of higher-order structures among both RNAs and proteins (Cumberworth et al., 2013, Kato et al., 2012). CCDs are prominently involved in protein-protein interactions and can interact with polyQ proteins, promoting their aggregation (Fiumara et al., 2010). RNA-binding proteins, which figure prominently in the aggregates, are particularly rich in LCRs, because they can be molecular determinants of RNA granule assembly (Han et al., 2012, Kato et al., 2012). The formation of such reversible structures allows increase of local concentrations of relevant interactors. However, because LCRs also promote protein binding promiscuity and aggregation propensity, this comes at the cost of undesirable, non-productive interactions, leading to several diseases (Cumberworth et al., 2013). We have shown in a cell model of HD that LCR domains co-aggregate with mutant HTT and other LCR-containing proteins, exacerbating aggregate formation (Kim et al., 2016). Our current results suggest that LCRs are also responsible for promoting co-aggregation in vivo. Several elements of the protein folding machinery also contain LCRs (Hageman et al., 2010). It is tempting to speculate that the presence of these sequences in both aggregation-prone and aggregation-counteracting proteins represents a balance that has co-evolved over time.
Our insoluble fraction showed little overlap with recently published protein aggregation sets. Of all insoluble proteins in our dataset, less than 5% overlapped with interactors of artificial amyloid-like beta sheet proteins (Olzscha et al., 2011), and less than 1% were shared with either RNA-binding proteins containing prion-like domains (Li et al., 2013) or stress granules (Jain et al., 2016). The little overlap between these aggregation-associated proteins indicates that proteins from our insoluble dataset specifically co-aggregate with mutant HttEx1.
The integrative aspect of jointly analyzing the soluble and insoluble proteome, combined with the spatiotemporal resolution, allowed us to elucidate molecular neurodegeneration signatures that have not yet been linked to HD. Hundreds of proteins were downregulated in the soluble proteome and upregulated in the insoluble proteome. This prevalent sequestration of proteins into the aggregates suggests widespread loss of protein function in HD. Although it has been reported that IBs are protective by sequestering toxic soluble oligomers (Arrasate et al., 2004, Haass and Selkoe, 2007), the substantial depletion of soluble proteins observed here suggests a major impairment of protein homeostasis in the cell.
In accordance with this hypothesis, our rescue experiments demonstrated that overexpression of loss-of-function candidates ameliorated HttEx1 toxicity in a cellular HD model. The molecular mechanism underlying the observed increase in cell viability requires further analysis. It is possible that each of the selected candidates is necessary for cell survival and overexpression simply re-supplies the cell with an essential factor. In addition, a protein with a strong affinity for HttEx1 aggregates may occupy much of the aggregates’ interaction surface and thereby reduce sequestration of endogenous proteins, as suggested by the increase of the soluble proportion of most proteins upon transfection of the candidates into HD-Q74 cells. The latter scenario may also explain why many of our candidates reduced IB size. Our data therefore suggest that overexpression of candidate proteins could increase cell viability by interfering with multistage aggregate formation. Soluble interactors of both native and mutant NDD proteins have been identified as disease modifiers (Hosp et al., 2015, Kaltenbach et al., 2007). Most proteins in the insoluble aggregates, however, are most likely not associated with the native function of the disease protein. Given the high proportion of toxicity mediators in our validation set, it is likely that the total set of potential loss-of-function proteins contains further candidates that would be interesting to study in the context of HD.
In summary, we provide a rich resource comprising (1) changes in the proteome upon disease progression, (2) protein copy numbers, (3) degree of protein sequestration to the IBs, and (4) correlation of proteomes across different brain regions, time, and aspects of the brain and cerebrospinal fluid proteome. Altogether, these data paint a quantitative picture of the dynamic aggregate proteome in relation to the brain proteome. This highlights the power of integrative approaches to elucidate molecular mechanisms of HD, helping to bridge the gap between identification of disease-associated pathways and their corresponding phenotypes.
Experimental Procedures
Further details and an outline of resources used in this work can be found in Supplemental Experimental Procedures.
Cell Lines
Rat PC12 pheochromocytoma cell lines stably transfected with either GFP-fused Huntingtin Exon1-Q23 or Huntingtin Exon1-Q74 were a gift from David Rubinsztein (Cambridge Institute for Medical Research). Both lines were cultured and induced as described (Wyttenbach et al., 2001). Briefly, cells were maintained at 70 μg/mL hygromycin B (Thermo Fisher Scientific) in standard medium consisting of high-glucose DMEM (Sigma-Aldrich) with 100 U/mL penicillin/streptomycin (Sigma-Aldrich), 2 mM GlutaMAX (Life Technologies), 10% heat-inactivated horse serum (HS) (Life Technologies), 5% Tet-approved fetal bovine serum (Clontech), and 100 μg/mL G418 (Thermo Fisher Scientific) at 37°C, 10% CO2. Induction of HttEx1-Q23 or HttEx1-Q74 was carried out by adding doxycycline (Sigma-Aldrich) at 1 μg/mL. After induction with doxycycline, cells were kept at 1% HS to maintain them in a quiescent-like state.
Mouse Strains
For the proteomic study, female R6/2 mice (B6CBA-Tg(HDexon1)62 gpb/1J) carrying a 150 ± 5 CAG repeat expansion and non-transgenic littermate controls at 5 weeks of age were obtained from the Jackson Laboratory (Bar Harbor, Maine, USA) and sacrificed at the age of 5, 8, and 12 weeks. For further studies, an R6/2 colony was established at the animal facility of the Max Planck Institute of Biochemistry, Martinsried, from male R6/2 mice (B6CBA-Tg(HDexon1)62 gpb/1J) obtained from the Jackson Laboratory. The colony was maintained by crossing carrier males to CBA x C57BL/6 F1 females. Only female R6/2 mice were used for experiments. All animals used in this study had ad libitum access to standard mouse food and water and were maintained consistent with an animal protocol approved by the local authorities (Regierung von Oberbayern, animal protocol 55.2-1-54-2532-168-2014).
LC-MS/MS Analysis
MS analysis was performed using Q Exactive mass spectrometers (Thermo Fisher Scientific, Bremen, Germany) coupled online to a nanoflow ultra-high performance liquid chromatography (UHPLC) instrument (Easy1000 nLC, Thermo Fisher Scientific). Peptides were separated on a 50-cm-long (75 μm inner diameter) column packed in house with ReproSil-Pur C18-AQ 1.9 μm resin (Dr. Maisch, Ammerbuch, Germany). Column temperature was kept at 50°C by an in-house-designed oven with a Peltier element, and operational parameters were monitored in real time by the SprayQc software (Scheltema and Mann, 2012). Peptides were loaded with buffer A (0.1% [v/v] formic acid) and eluted with a nonlinear gradient of 5%–60% buffer B (0.1% [v/v] formic acid, 80% [v/v] acetonitrile) at a flow rate of 250 nL/min. Peptide separation was achieved by 245 min gradients (soluble proteome), 120 min gradients (cerebrospinal fluid), or 60 min gradients (insoluble proteome). The survey scans (300–1,700 m/z, target value = 3E6, maximum ion injection times = 20 ms) were acquired at a resolution of 70,000, followed by higher-energy collisional dissociation (HCD)-based fragmentation (normalized collision energy = 25) of up to 10 dynamically chosen, most abundant precursor ions. The MS/MS scans were acquired at a resolution of 17,500 (target value = 1E5, maximum ion injection times = 120 ms). Repeated sequencing of peptides was minimized by excluding the selected peptide candidates for 20 s.
Statistical Analysis
The type of statistical test (e.g., ANOVA or Mann-Whitney U test) is annotated in the figure legend and/or in the Supplemental Experimental Procedures segment specific to the analysis. In addition, statistical parameters such as the value of n, mean or median, SD, and significance level are reported in the figures and/or in the figure legends. When asterisks are used to signify the significance level, the key is reported in the respective figure legend. Statistical analyses were performed using Perseus or R as described in Supplemental Experimental Procedures for individual analysis.
Author Contributions
F.H. performed wet lab and MS experiments and analyzed the data. S.G.-A. performed wet lab and imaging experiments and analyzed the data. I.D. performed cerebrospinal fluid extraction and mouse brain dissection. M.H.S. and J.C. developed bioinformatic tools. M.S.H., F.M., and F.-U.H. provided reagents and advised research. F.H., S.G.-A., I.D., R.K., and M.M. interpreted the data. F.H. and M.M. conceived the project and wrote the manuscript. All authors read and approved the manuscript.
Acknowledgments
We thank our colleagues at the Max Planck Institutes of Biochemistry and Neurobiology, especially G.H.H. Borner and D. Hornburg for help and fruitful discussions; S. Kroiss, K. Mayr, I. Paron, G. Sowa, and B. Splettstösser for excellent technical assistance; and K. Schulz-Trieglaff and the MPIB animal facility for help with the R6/2 breeding and caretaking. We acknowledge the gift of the PC12 HD cell lines from D. Rubinsztein (University of Cambridge, UK). The research leading to these results has received funding from the Munich Cluster for Systems Neurology “SyNergy,” the European Research Council Synergy grant “ToPAG—Toxic protein aggregation in neurodegeneration” (ERC-2012-SyG_318987-ToPAG), and the Max Planck Society for the Advancement of Science.
Published: November 21, 2017
Footnotes
Supplemental Information includes Supplemental Experimental Procedures, seven figures, and four tables and can be found with this article online at https://doi.org/10.1016/j.celrep.2017.10.097.
Contributor Information
Irina Dudanova, Email: idudanova@neuro.mpg.de.
Matthias Mann, Email: mmann@biochem.mpg.de.
Data and Software Availability
The accession number for the raw and processed data reported in this paper is PRIDE: PXD004973.
Supplemental Information
Log2 MaxLFQ intensities and iBAQ copy numbers of proteins detected in the total soluble proteome of R6/2 and WT mice for all brain regions and across time.
Log2 MaxLFQ intensities and iBAQ copy numbers of proteins detected in the cerebrospinal fluid of R6/2 and WT mice for all brain regions and across time.
Log2 MaxLFQ intensities and iBAQ values of proteins detected in the total insoluble proteome of R6/2 and WT mice for all brain regions and across time. Sequence motives with corresponding lengths and iBAQ ratios for soluble/insoluble iBAQ values are annotated. T-test difference and −log10 p-values for R6/2 against WT comparisons were calculated in Perseus.
Details of function, localization and known linkage to neurodegenerative diseases are indicated.
References
- Acuña A.I., Esparza M., Kramm C., Beltrán F.A., Parra A.V., Cepeda C., Toro C.A., Vidal R.L., Hetz C., Concha I.I. A failure in energy metabolism and antioxidant uptake precede symptoms of Huntington’s disease in mice. Nat. Commun. 2013;4:2917. doi: 10.1038/ncomms3917. [DOI] [PMC free article] [PubMed] [Google Scholar]
- Aebersold R., Mann M. Mass-spectrometric exploration of proteome structure and function. Nature. 2016;537:347–355. doi: 10.1038/nature19949. [DOI] [PubMed] [Google Scholar]
- Arrasate M., Mitra S., Schweitzer E.S., Segal M.R., Finkbeiner S. Inclusion body formation reduces levels of mutant huntingtin and the risk of neuronal death. Nature. 2004;431:805–810. doi: 10.1038/nature02998. [DOI] [PubMed] [Google Scholar]
- Baldo B., Paganetti P., Grueninger S., Marcellin D., Kaltenbach L.S., Lo D.C., Semmelroth M., Zivanovic A., Abramowski D., Smith D. TR-FRET-based duplex immunoassay reveals an inverse correlation of soluble and aggregated mutant huntingtin in Huntington’s disease. Chem. Biol. 2012;19:264–275. doi: 10.1016/j.chembiol.2011.12.020. [DOI] [PubMed] [Google Scholar]
- Byrne L.M., Wild E.J. Cerebrospinal fluid biomarkers for Huntington’s disease. J. Huntingtons Dis. 2016;5:1–13. doi: 10.3233/JHD-160196. [DOI] [PubMed] [Google Scholar]
- Carapito R., Paul N., Untrau M., Le Gentil M., Ott L., Alsaleh G., Jochem P., Radosavljevic M., Le Caignec C., David A. A de novo ADCY5 mutation causes early-onset autosomal dominant chorea and dystonia. Mov. Disord. 2015;30:423–427. doi: 10.1002/mds.26115. [DOI] [PubMed] [Google Scholar]
- Carter R.J., Lione L.A., Humby T., Mangiarini L., Mahal A., Bates G.P., Dunnett S.B., Morton A.J. Characterization of progressive motor deficits in mice transgenic for the human Huntington’s disease mutation. J. Neurosci. 1999;19:3248–3257. doi: 10.1523/JNEUROSCI.19-08-03248.1999. [DOI] [PMC free article] [PubMed] [Google Scholar]
- Chen J.Y., Wang E.A., Cepeda C., Levine M.S. Dopamine imbalance in Huntington’s disease: a mechanism for the lack of behavioral flexibility. Front. Neurosci. 2013;7:114. doi: 10.3389/fnins.2013.00114. [DOI] [PMC free article] [PubMed] [Google Scholar]
- Culver B.P., Savas J.N., Park S.K., Choi J.H., Zheng S., Zeitlin S.O., Yates J.R., 3rd, Tanese N. Proteomic analysis of wild-type and mutant huntingtin-associated proteins in mouse brains identifies unique interactions and involvement in protein synthesis. J. Biol. Chem. 2012;287:21599–21614. doi: 10.1074/jbc.M112.359307. [DOI] [PMC free article] [PubMed] [Google Scholar]
- Cumberworth A., Lamour G., Babu M.M., Gsponer J. Promiscuity as a functional trait: intrinsically disordered regions as central players of interactomes. Biochem. J. 2013;454:361–369. doi: 10.1042/BJ20130545. [DOI] [PubMed] [Google Scholar]
- Cummings D.M., André V.M., Uzgil B.O., Gee S.M., Fisher Y.E., Cepeda C., Levine M.S. Alterations in cortical excitation and inhibition in genetic mouse models of Huntington’s disease. J. Neurosci. 2009;29:10371–10386. doi: 10.1523/JNEUROSCI.1592-09.2009. [DOI] [PMC free article] [PubMed] [Google Scholar]
- Dalrymple A., Wild E.J., Joubert R., Sathasivam K., Björkqvist M., Petersén A., Jackson G.S., Isaacs J.D., Kristiansen M., Bates G.P. Proteomic profiling of plasma in Huntington’s disease reveals neuroinflammatory activation and biomarker candidates. J. Proteome Res. 2007;6:2833–2840. doi: 10.1021/pr0700753. [DOI] [PubMed] [Google Scholar]
- Davies S.W., Turmaine M., Cozens B.A., DiFiglia M., Sharp A.H., Ross C.A., Scherzinger E., Wanker E.E., Mangiarini L., Bates G.P. Formation of neuronal intranuclear inclusions underlies the neurological dysfunction in mice transgenic for the HD mutation. Cell. 1997;90:537–548. doi: 10.1016/s0092-8674(00)80513-9. [DOI] [PubMed] [Google Scholar]
- DiFiglia M., Sapp E., Chase K.O., Davies S.W., Bates G.P., Vonsattel J.P., Aronin N. Aggregation of huntingtin in neuronal intranuclear inclusions and dystrophic neurites in brain. Science. 1997;277:1990–1993. doi: 10.1126/science.277.5334.1990. [DOI] [PubMed] [Google Scholar]
- Doi H., Mitsui K., Kurosawa M., Machida Y., Kuroiwa Y., Nukina N. Identification of ubiquitin-interacting proteins in purified polyglutamine aggregates. FEBS Lett. 2004;571:171–176. doi: 10.1016/j.febslet.2004.06.077. [DOI] [PubMed] [Google Scholar]
- Dunah A.W., Jeong H., Griffin A., Kim Y.M., Standaert D.G., Hersch S.M., Mouradian M.M., Young A.B., Tanese N., Krainc D. Sp1 and TAFII130 transcriptional activity disrupted in early Huntington’s disease. Science. 2002;296:2238–2243. doi: 10.1126/science.1072613. [DOI] [PubMed] [Google Scholar]
- Fang Q., Strand A., Law W., Faca V.M., Fitzgibbon M.P., Hamel N., Houle B., Liu X., May D.H., Poschmann G. Brain-specific proteins decline in the cerebrospinal fluid of humans with Huntington disease. Mol. Cell. Proteomics. 2009;8:451–466. doi: 10.1074/mcp.M800231-MCP200. [DOI] [PMC free article] [PubMed] [Google Scholar]
- Fiumara F., Fioriti L., Kandel E.R., Hendrickson W.A. Essential role of coiled coils for aggregation and activity of Q/N-rich prions and PolyQ proteins. Cell. 2010;143:1121–1135. doi: 10.1016/j.cell.2010.11.042. [DOI] [PMC free article] [PubMed] [Google Scholar]
- Galli S., Lopes D.M., Ammari R., Kopra J., Millar S.E., Gibb A., Salinas P.C. Deficient Wnt signalling triggers striatal synaptic degeneration and impaired motor behaviour in adult mice. Nat. Commun. 2014;5:4992. doi: 10.1038/ncomms5992. [DOI] [PMC free article] [PubMed] [Google Scholar]
- Geiger T., Wehner A., Schaab C., Cox J., Mann M. Comparative proteomic analysis of eleven common cell lines reveals ubiquitous but varying expression of most proteins. Mol. Cell. Proteomics. 2012;11 doi: 10.1074/mcp.M111.014050. M111.014050. [DOI] [PMC free article] [PubMed] [Google Scholar]
- Gerfen C.R., Surmeier D.J. Modulation of striatal projection systems by dopamine. Annu. Rev. Neurosci. 2011;34:441–466. doi: 10.1146/annurev-neuro-061010-113641. [DOI] [PMC free article] [PubMed] [Google Scholar]
- Giampà C., Laurenti D., Anzilotti S., Bernardi G., Menniti F.S., Fusco F.R. Inhibition of the striatal specific phosphodiesterase PDE10A ameliorates striatal and cortical pathology in R6/2 mouse model of Huntington’s disease. PLoS ONE. 2010;5:e13417. doi: 10.1371/journal.pone.0013417. [DOI] [PMC free article] [PubMed] [Google Scholar]
- Gratuze M., Noël A., Julien C., Cisbani G., Milot-Rousseau P., Morin F., Dickler M., Goupil C., Bezeau F., Poitras I. Tau hyperphosphorylation and deregulation of calcineurin in mouse models of Huntington’s disease. Hum. Mol. Genet. 2015;24:86–99. doi: 10.1093/hmg/ddu456. [DOI] [PubMed] [Google Scholar]
- Gutekunst C.A., Li S.H., Yi H., Mulroy J.S., Kuemmerle S., Jones R., Rye D., Ferrante R.J., Hersch S.M., Li X.J. Nuclear and neuropil aggregates in Huntington’s disease: relationship to neuropathology. J. Neurosci. 1999;19:2522–2534. doi: 10.1523/JNEUROSCI.19-07-02522.1999. [DOI] [PMC free article] [PubMed] [Google Scholar]
- Haass C., Selkoe D.J. Soluble protein oligomers in neurodegeneration: lessons from the Alzheimer’s amyloid beta-peptide. Nat. Rev. Mol. Cell Biol. 2007;8:101–112. doi: 10.1038/nrm2101. [DOI] [PubMed] [Google Scholar]
- Hageman J., Rujano M.A., van Waarde M.A., Kakkar V., Dirks R.P., Govorukhina N., Oosterveld-Hut H.M., Lubsen N.H., Kampinga H.H. A DNAJB chaperone subfamily with HDAC-dependent activities suppresses toxic protein aggregation. Mol. Cell. 2010;37:355–369. doi: 10.1016/j.molcel.2010.01.001. [DOI] [PubMed] [Google Scholar]
- Han T.W., Kato M., Xie S., Wu L.C., Mirzaei H., Pei J., Chen M., Xie Y., Allen J., Xiao G., McKnight S.L. Cell-free formation of RNA granules: bound RNAs identify features and components of cellular assemblies. Cell. 2012;149:768–779. doi: 10.1016/j.cell.2012.04.016. [DOI] [PubMed] [Google Scholar]
- Hazeki N., Tukamoto T., Goto J., Kanazawa I. Formic acid dissolves aggregates of an N-terminal huntingtin fragment containing an expanded polyglutamine tract: applying to quantification of protein components of the aggregates. Biochem. Biophys. Res. Commun. 2000;277:386–393. doi: 10.1006/bbrc.2000.3682. [DOI] [PubMed] [Google Scholar]
- Hosp F., Vossfeldt H., Heinig M., Vasiljevic D., Arumughan A., Wyler E., Genetic and Environmental Risk for Alzheimer’s Disease GERAD1 Consortium. Landthaler M., Hubner N., Wanker E.E., Lannfelt L. Quantitative interaction proteomics of neurodegenerative disease proteins. Cell Rep. 2015;11:1134–1146. doi: 10.1016/j.celrep.2015.04.030. [DOI] [PMC free article] [PubMed] [Google Scholar]
- Jain S., Wheeler J.R., Walters R.W., Agrawal A., Barsic A., Parker R. ATPase-modulated stress granules contain a diverse proteome and substructure. Cell. 2016;164:487–498. doi: 10.1016/j.cell.2015.12.038. [DOI] [PMC free article] [PubMed] [Google Scholar]
- Jiang M., Wang J., Fu J., Du L., Jeong H., West T., Xiang L., Peng Q., Hou Z., Cai H. Neuroprotective role of Sirt1 in mammalian models of Huntington’s disease through activation of multiple Sirt1 targets. Nat. Med. 2011;18:153–158. doi: 10.1038/nm.2558. [DOI] [PMC free article] [PubMed] [Google Scholar]
- Kaltenbach L.S., Romero E., Becklin R.R., Chettier R., Bell R., Phansalkar A., Strand A., Torcassi C., Savage J., Hurlburt A. Huntingtin interacting proteins are genetic modifiers of neurodegeneration. PLoS Genet. 2007;3:e82. doi: 10.1371/journal.pgen.0030082. [DOI] [PMC free article] [PubMed] [Google Scholar]
- Kato M., Han T.W., Xie S., Shi K., Du X., Wu L.C., Mirzaei H., Goldsmith E.J., Longgood J., Pei J. Cell-free formation of RNA granules: low complexity sequence domains form dynamic fibers within hydrogels. Cell. 2012;149:753–767. doi: 10.1016/j.cell.2012.04.017. [DOI] [PMC free article] [PubMed] [Google Scholar]
- Kim Y.E., Hosp F., Frottin F., Ge H., Mann M., Hayer-Hartl M., Hartl F.U. Soluble oligomers of polyQ-expanded huntingtin target a multiplicity of key cellular factors. Mol. Cell. 2016;63:951–964. doi: 10.1016/j.molcel.2016.07.022. [DOI] [PubMed] [Google Scholar]
- Knowles T.P., Vendruscolo M., Dobson C.M. The amyloid state and its association with protein misfolding diseases. Nat. Rev. Mol. Cell Biol. 2014;15:384–396. doi: 10.1038/nrm3810. [DOI] [PubMed] [Google Scholar]
- Kroksveen A.C., Opsahl J.A., Aye T.T., Ulvik R.J., Berven F.S. Proteomics of human cerebrospinal fluid: discovery and verification of biomarker candidates in neurodegenerative diseases using quantitative proteomics. J. Proteomics. 2011;74:371–388. doi: 10.1016/j.jprot.2010.11.010. [DOI] [PubMed] [Google Scholar]
- Langfelder P., Cantle J.P., Chatzopoulou D., Wang N., Gao F., Al-Ramahi I., Lu X.H., Ramos E.M., El-Zein K., Zhao Y. Integrated genomics and proteomics define huntingtin CAG length-dependent networks in mice. Nat. Neurosci. 2016;19:623–633. doi: 10.1038/nn.4256. [DOI] [PMC free article] [PubMed] [Google Scholar]
- Lein E.S., Hawrylycz M.J., Ao N., Ayres M., Bensinger A., Bernard A., Boe A.F., Boguski M.S., Brockway K.S., Byrnes E.J. Genome-wide atlas of gene expression in the adult mouse brain. Nature. 2007;445:168–176. doi: 10.1038/nature05453. [DOI] [PubMed] [Google Scholar]
- Li S.H., Li X.J. Huntingtin-protein interactions and the pathogenesis of Huntington’s disease. Trends Genet. 2004;20:146–154. doi: 10.1016/j.tig.2004.01.008. [DOI] [PubMed] [Google Scholar]
- Li Y.R., King O.D., Shorter J., Gitler A.D. Stress granules as crucibles of ALS pathogenesis. J. Cell Biol. 2013;201:361–372. doi: 10.1083/jcb.201302044. [DOI] [PMC free article] [PubMed] [Google Scholar]
- Mangiarini L., Sathasivam K., Seller M., Cozens B., Harper A., Hetherington C., Lawton M., Trottier Y., Lehrach H., Davies S.W., Bates G.P. Exon 1 of the HD gene with an expanded CAG repeat is sufficient to cause a progressive neurological phenotype in transgenic mice. Cell. 1996;87:493–506. doi: 10.1016/s0092-8674(00)81369-0. [DOI] [PubMed] [Google Scholar]
- Martinez F.J., Pratt G.A., Van Nostrand E.L., Batra R., Huelga S.C., Kapeli K., Freese P., Chun S.J., Ling K., Gelboin-Burkhart C. Protein-RNA networks regulated by normal and ALS-associated mutant HNRNPA2B1 in the nervous system. Neuron. 2016;92:780–795. doi: 10.1016/j.neuron.2016.09.050. [DOI] [PMC free article] [PubMed] [Google Scholar]
- Meade C.A., Deng Y.P., Fusco F.R., Del Mar N., Hersch S., Goldowitz D., Reiner A. Cellular localization and development of neuronal intranuclear inclusions in striatal and cortical neurons in R6/2 transgenic mice. J. Comp. Neurol. 2002;449:241–269. doi: 10.1002/cne.10295. [DOI] [PubMed] [Google Scholar]
- Mitsui K., Nakayama H., Akagi T., Nekooki M., Ohtawa K., Takio K., Hashikawa T., Nukina N. Purification of polyglutamine aggregates and identification of elongation factor-1alpha and heat shock protein 84 as aggregate-interacting proteins. J. Neurosci. 2002;22:9267–9277. doi: 10.1523/JNEUROSCI.22-21-09267.2002. [DOI] [PMC free article] [PubMed] [Google Scholar]
- Olzscha H., Schermann S.M., Woerner A.C., Pinkert S., Hecht M.H., Tartaglia G.G., Vendruscolo M., Hayer-Hartl M., Hartl F.U., Vabulas R.M. Amyloid-like aggregates sequester numerous metastable proteins with essential cellular functions. Cell. 2011;144:67–78. doi: 10.1016/j.cell.2010.11.050. [DOI] [PubMed] [Google Scholar]
- Orr H.T., Zoghbi H.Y. Trinucleotide repeat disorders. Annu. Rev. Neurosci. 2007;30:575–621. doi: 10.1146/annurev.neuro.29.051605.113042. [DOI] [PubMed] [Google Scholar]
- Ortega Z., Lucas J.J. Ubiquitin-proteasome system involvement in Huntington’s disease. Front. Mol. Neurosci. 2014;7:77. doi: 10.3389/fnmol.2014.00077. [DOI] [PMC free article] [PubMed] [Google Scholar]
- Ossovskaya V.S., Bunnett N.W. Protease-activated receptors: contribution to physiology and disease. Physiol. Rev. 2004;84:579–621. doi: 10.1152/physrev.00028.2003. [DOI] [PubMed] [Google Scholar]
- Ross C.A., Poirier M.A. Protein aggregation and neurodegenerative disease. Nat. Med. 2004;10(Suppl):S10–S17. doi: 10.1038/nm1066. [DOI] [PubMed] [Google Scholar]
- Russell D.S., Barret O., Jennings D.L., Friedman J.H., Tamagnan G.D., Thomae D., Alagille D., Morley T.J., Papin C., Papapetropoulos S. The phosphodiesterase 10 positron emission tomography tracer, [18F]MNI-659, as a novel biomarker for early Huntington disease. JAMA Neurol. 2014;71:1520–1528. doi: 10.1001/jamaneurol.2014.1954. [DOI] [PubMed] [Google Scholar]
- Saudou F., Humbert S. The biology of huntingtin. Neuron. 2016;89:910–926. doi: 10.1016/j.neuron.2016.02.003. [DOI] [PubMed] [Google Scholar]
- Schaefer M.H., Wanker E.E., Andrade-Navarro M.A. Evolution and function of CAG/polyglutamine repeats in protein-protein interaction networks. Nucleic Acids Res. 2012;40:4273–4287. doi: 10.1093/nar/gks011. [DOI] [PMC free article] [PubMed] [Google Scholar]
- Scheltema R.A., Mann M. SprayQc: a real-time LC-MS/MS quality monitoring system to maximize uptime using off the shelf components. J. Proteome Res. 2012;11:3458–3466. doi: 10.1021/pr201219e. [DOI] [PubMed] [Google Scholar]
- Schwanhäusser B., Busse D., Li N., Dittmar G., Schuchhardt J., Wolf J., Chen W., Selbach M. Global quantification of mammalian gene expression control. Nature. 2011;473:337–342. doi: 10.1038/nature10098. [DOI] [PubMed] [Google Scholar]
- Sharma K., Vabulas R.M., Macek B., Pinkert S., Cox J., Mann M., Hartl F.U. Quantitative proteomics reveals that Hsp90 inhibition preferentially targets kinases and the DNA damage response. Mol. Cell. Proteomics. 2012;11 doi: 10.1074/mcp.M111.014654. M111.014654. [DOI] [PMC free article] [PubMed] [Google Scholar]
- Sharma K., Schmitt S., Bergner C.G., Tyanova S., Kannaiyan N., Manrique-Hoyos N., Kongi K., Cantuti L., Hanisch U.K., Philips M.A. Cell type- and brain region-resolved mouse brain proteome. Nat. Neurosci. 2015;18:1819–1831. doi: 10.1038/nn.4160. [DOI] [PMC free article] [PubMed] [Google Scholar]
- Shimohata T., Nakajima T., Yamada M., Uchida C., Onodera O., Naruse S., Kimura T., Koide R., Nozaki K., Sano Y. Expanded polyglutamine stretches interact with TAFII130, interfering with CREB-dependent transcription. Nat. Genet. 2000;26:29–36. doi: 10.1038/79139. [DOI] [PubMed] [Google Scholar]
- Shirasaki D.I., Greiner E.R., Al-Ramahi I., Gray M., Boontheung P., Geschwind D.H., Botas J., Coppola G., Horvath S., Loo J.A., Yang X.W. Network organization of the huntingtin proteomic interactome in mammalian brain. Neuron. 2012;75:41–57. doi: 10.1016/j.neuron.2012.05.024. [DOI] [PMC free article] [PubMed] [Google Scholar]
- Stroedicke M., Bounab Y., Strempel N., Klockmeier K., Yigit S., Friedrich R.P., Chaurasia G., Li S., Hesse F., Riechers S.P. Systematic interaction network filtering identifies CRMP1 as a novel suppressor of huntingtin misfolding and neurotoxicity. Genome Res. 2015;25:701–713. doi: 10.1101/gr.182444.114. [DOI] [PMC free article] [PubMed] [Google Scholar]
- The Huntington’s Disease Collaborative Research Group A novel gene containing a trinucleotide repeat that is expanded and unstable on Huntington’s disease chromosomes. Cell. 1993;72:971–983. doi: 10.1016/0092-8674(93)90585-e. [DOI] [PubMed] [Google Scholar]
- Uhlén M., Fagerberg L., Hallström B.M., Lindskog C., Oksvold P., Mardinoglu A., Sivertsson Å., Kampf C., Sjöstedt E., Asplund A. Proteomics. Tissue-based map of the human proteome. Science. 2015;347:1260419. doi: 10.1126/science.1260419. [DOI] [PubMed] [Google Scholar]
- Vonsattel J.P., DiFiglia M. Huntington disease. J. Neuropathol. Exp. Neurol. 1998;57:369–384. doi: 10.1097/00005072-199805000-00001. [DOI] [PubMed] [Google Scholar]
- Walther D.M., Mann M. Accurate quantification of more than 4000 mouse tissue proteins reveals minimal proteome changes during aging. Mol. Cell. Proteomics. 2011;10 doi: 10.1074/mcp.M110.004523. M110.004523. [DOI] [PMC free article] [PubMed] [Google Scholar]
- Warringer J., Blomberg A. Evolutionary constraints on yeast protein size. BMC Evol. Biol. 2006;6:61. doi: 10.1186/1471-2148-6-61. [DOI] [PMC free article] [PubMed] [Google Scholar]
- Winklhofer K.F., Tatzelt J., Haass C. The two faces of protein misfolding: gain- and loss-of-function in neurodegenerative diseases. EMBO J. 2008;27:336–349. doi: 10.1038/sj.emboj.7601930. [DOI] [PMC free article] [PubMed] [Google Scholar]
- Wiśniewski J.R., Hein M.Y., Cox J., Mann M. A “proteomic ruler” for protein copy number and concentration estimation without spike-in standards. Mol. Cell. Proteomics. 2014;13:3497–3506. doi: 10.1074/mcp.M113.037309. [DOI] [PMC free article] [PubMed] [Google Scholar]
- Woodman B., Butler R., Landles C., Lupton M.K., Tse J., Hockly E., Moffitt H., Sathasivam K., Bates G.P. The Hdh(Q150/Q150) knock-in mouse model of HD and the R6/2 exon 1 model develop comparable and widespread molecular phenotypes. Brain Res. Bull. 2007;72:83–97. doi: 10.1016/j.brainresbull.2006.11.004. [DOI] [PubMed] [Google Scholar]
- Wyttenbach A., Swartz J., Kita H., Thykjaer T., Carmichael J., Bradley J., Brown R., Maxwell M., Schapira A., Orntoft T.F. Polyglutamine expansions cause decreased CRE-mediated transcription and early gene expression changes prior to cell death in an inducible cell model of Huntington’s disease. Hum. Mol. Genet. 2001;10:1829–1845. doi: 10.1093/hmg/10.17.1829. [DOI] [PubMed] [Google Scholar]
Associated Data
This section collects any data citations, data availability statements, or supplementary materials included in this article.
Supplementary Materials
Log2 MaxLFQ intensities and iBAQ copy numbers of proteins detected in the total soluble proteome of R6/2 and WT mice for all brain regions and across time.
Log2 MaxLFQ intensities and iBAQ copy numbers of proteins detected in the cerebrospinal fluid of R6/2 and WT mice for all brain regions and across time.
Log2 MaxLFQ intensities and iBAQ values of proteins detected in the total insoluble proteome of R6/2 and WT mice for all brain regions and across time. Sequence motives with corresponding lengths and iBAQ ratios for soluble/insoluble iBAQ values are annotated. T-test difference and −log10 p-values for R6/2 against WT comparisons were calculated in Perseus.
Details of function, localization and known linkage to neurodegenerative diseases are indicated.