Abstract
Osteosarcoma, the most common malignant primary bone tumor, is currently treated with chemotherapy and surgery. The effectiveness of chemotherapy is evaluated by means of histological analysis of tumor necrosis, known as “the Huvos score”. However, 25% of the patients initially considered good responders will relapse. In our practice, strong tissue heterogeneity around the residual viable cells of the osteosarcoma is observed, but this is not taken into account by the Huvos score, as it is only an average. The objective is to determine whether heterogeneity in the osteosarcoma’s microenvironment can play a role in the histological response to chemotherapy. Two complementary approaches have been developed: (i) the therapeutic response to several monotherapies (ifosfamide, cisplatin, doxorubicin) has been compared to tumor growth and the necrosis levels in different preclinical syngeneic osteosarcoma models, mimicking various microenvironments by injecting the tumor cells into subcutaneous, intra-muscular paratibial, or intra-osseous sites; (ii) a retrospective analysis was performed on patients’ osteoblastic osteosarcoma biopsies. Tissue localization mapping of residual live tumor cell colonies was evaluated for potential correlation with overall survival. The results of the preclinical studies showed a difference in tumor growth depending on the osteosarcoma model, with a higher rate in bone sites compared to subcutaneous tumors. For the therapeutic response, a higher response to doxorubicin was observed in the intra-osseous model compared to the intra-muscular model for tumor growth (P = 0.013) and necrosis (P = 0.007). These data strongly suggest that the microenvironment plays a role in how osteosarcoma responds to chemotherapy. The retrospective analysis showed no significant survival difference between residual cell sites, although the soft tissues may be seen as a potential negative factor.
Keywords: Osteosarcoma, microenvironment, histological analysis, murine model, retrospective analysis
Introduction
Osteosarcoma, derived from mesenchymal bone-forming cells, is the most common malignant primary bone tumor. Annual incidence of osteosarcoma in the general population is 5 cases per million [1]. Although this tumor is mostly characterized as being of the conventional osteoblastic type, other histological subtypes can be observed [2] (fibroblastic, chondroblastic, telangiectasia), with strong intratumoral histologic heterogeneity [3,4]. The long-term survival prognostic factors described in the literature are: location and size of the tumor, presence of metastasis, response to chemotherapy determined by the Huvos and Rosen score, as well as the quality of the tumor resection [5-7]. Osteosarcoma treatment is codified as part of a multidisciplinary care protocol and has not really changed in thirty years: it combines neo-adjuvant chemotherapy with surgical resection and adjuvant chemotherapy. The most commonly used chemotherapy drugs are high-dose methotrexate, cisplatin, ifosfamide, and doxorubicin for example [8]. Modifying the adjuvant chemotherapy protocol is decided in relation to the histological response to neo-adjuvant chemotherapy on the resection piece. This analysis quantifies tumor necrosis and classifies patients into good and bad responders (known as the Huvos and Rosen score) [9]. This score is based on the number of remaining viable tumor cells, with good responders defined as having a rate of less than 10% [10]. This prognostic criterion is essential and guides the postoperative chemotherapy regimen. However, 25% of the patients initially considered good responders will relapse [9,11]. Currently, the number of viable tumor cells is an average count which is made globally without distinguishing between different areas or different types of tissue. Our practice, along with data from the literature, shows that on a post-chemotherapy resection piece, the resection necrotic areas are heterogeneous with some areas with complete necrosis and some with an absence of necrosis. A unique study by Picci et al indicated that the preferential survival zones for osteosarcoma cells on post-chemotherapy resection pieces are observed in soft tissues [12]. The aims of the present work are to complete this initial study at preclinical and clinical levels, first by developing relevant animal models that mimic different microenvironments, and second by means of retrospective clinical assessment on survival.
The concept of microenvironment has recently emerged. It considers tumors as organs with complex interactions with the stroma, and not as merely simple clusters of autonomous tumor cells. This provides us with an opportunity for understanding tumor progression that may apply to osteosarcomas [13]. Bone is composed of many distinct cell types (osteoblasts, osteoclasts, chondrocytes, MSC (mesenchymal stem cells), hematopoietic cells, endothelial cells, immune cells) and is the site of major interactions balanced by bone formation and bone resorption. This complex osseous microenvironment influences the development and progression of osteosarcomas [14]. Our scientific hypothesis is that overall averaged therapeutic response assessment of the tumor piece, as obtained with the Huvos and Rosen score, currently masks the potential significance of post-chemotherapy necrosis heterogeneity. Cell interactions between the microenvironment and the tumor may modulate the chemotherapy response, as suggested by Junttila or Hanahan [13,15], with tumor response that differs depending on the type of tissue at the expense of which the tumor grows (soft tissue, cancellous bone, cortical bone). This variability may be explained by differences in environmental characteristics at the immune cell, architectural [16-18], or vascular levels, as well as at the chemical level by variations in pH or oxygenation [19-21]. Knowledge and understanding of necrosis distribution depending on the microenvironment may improve our prognostic criteria and better guide postoperative chemotherapy.
In order to validate our hypothesis, we will develop two complementary approaches: (i) in collaboration with pathologists, we will carry out a retrospective study of osteosarcoma resection pieces obtained after chemotherapy. This will make it possible to assess necrosis heterogeneity (different kinds of tissues) in correlation with disease prognosis; (ii) an in vivo experimental approach on syngenic MOS-J murine osteosarcoma models will be developed to compare the chemotherapy response between various tumor implantation sites mimicking different microenvironments (pure bone, muscle tissue with periosteum denudation or subcutaneous tissue) to study the influence of these different microenvironments on the therapeutic response. This modeling approach should provide us with better understanding of both the molecular and/or cellular mechanisms that may influence the response to chemotherapy, and their prognostic significance for better therapy.
Materials and methods
In vitro experiments
Cell line and culture
The murine MOS-J osteosarcoma cell line used for both the in vitro and in vivo experiments developed from a spontaneous osteosarcoma in the C57BL/6J mouse strain [22]. All experiments were performed under sterile conditions using a vertical laminar flow hood (PSM Securiplus, Astec, France). The cells were grown in 25, 75, 175 cm2 or triple 175 cm2 flasks (FalconTM, Becton Dickinson Labware, JN, USA) in RPMI (Roswell Park Memorial Institute, Biowhitakker, Verviers, Belgium) culture medium supplemented with 5% FCS (Fetal Calf Serum, Hyclone Perbio, Vigneux, France). The plates were seeded at a density of 104 cells/cm2, then incubated in a saturated humidity atmosphere containing 5% CO2 at 37°C. During subculturing, cells were detached at confluence with a Trypsin-EDTA solution [Biowhittaker, Trypsin: 0.5 g/L; EDTA (Ethylene Diamine Tetra-acetic Acid): 0.5 g/L]. Trypsin was neutralized by adding 10% FCS into the culture medium, then centrifuged at 1600 rpm for 5 minutes. The cell count was realized on a Malassez cell. When cell amplification was required for the in vivo experiments, MOS-J cells were detached at between 70 and 80% confluence, to obtain a potentially optimal comparable division from one operation to another.
Cell proliferation test
A proliferation assay was performed to determine for the MOS-J cell line its in vitro susceptibility to the chemotherapy drugs commonly used in the osteosarcoma API therapeutic protocol [10]: doxorubicin, ifosfamide (mafosfamide, the active form of ifosfamide was used for in vitro testing, as ifosfamide requires metabolic activation) and cisplatin. The MOS-J cells were seeded in 96-well plates at a density of 3000 cells per well. After 24 hours of culture to allow the cells to adhere, the cells were incubated with different treatments in fresh medium with concentrations ranging from 0.01 μM to 100 μM, at 37°C for 48 hours. The cell viability rate compared to control untreated cells was determined by crystal violet staining. After cell attachment, the cells were treated with 1% glutheraldehyde for 5 minutes followed by rinsing, then the cells were stained with 0.1% crystal violet. The dye was solubilized in Sorensen’s solution (45% Ethanol, 20 nM HCl, citrate trisodium 35 nm) and the absorbance was measured in a spectrophotometer at 420 nm. The dose-response curves and the doses inducing 50% of the maximum effect (IC50) were determined for each molecule using GraphPad-Prism software (Center for Opportunities, USA). These manipulations were reproduced twice.
In vivo experiments
Murine models
Animal experiments were performed on mice housed in the Experimental Therapeutic Unit (Medical School, Nantes, France; agreement n°D-44045) in accordance with protocols approved by the Regional Ethics Committee on Animal Experimentation (CEEA PdL 6) and the Ministry of Agriculture, under the direction of investigators certified for animal experiments. Four-week-old male C57BL/6J mice from Janvier Labs (Le Genest-Saint-Isle, France) were used. For each experiment, one week of adaptation to the environment was required before starting the manipulation, with the mice being randomized into different cages. The MOS-J tumor cells were injected into various sites in order to mimic different microenvironments. All tumor cell injections were performed under general anesthesia (isoflurane 1.5% air-1 L/min) after disinfection with betadine, within one hour of detaching the cells. Preliminary experiments were performed to determine the best cell number for obtaining reproducible kinetics and optimal growth.
Injection models
Three models were developed: intra-muscular, intra-osseous and subcutaneous. (i) intra-muscular paratibial injections were carried out percutaneously on mid-diaphyseal tibia after needle periosteum denudation, with 3.106 MOS-J cells prepared in a solution of 50 μL phosphate buffered saline (PBS); (ii) intra-osseous injections were carried out after a sub-centimeter infero-lateral incision to the tibial tuberosity in order to expose the bone: the cortical bone was punctured with a needle by a rotary movement and then 3.106 MOS-J cells prepared in 25 μL of PBS were injected. The skin was closed using a Flexocrin© 5.0 suture. These mice were treated with an intraperitoneal bolus of buprenorphine 0.1 mg/kg; (iii) subcutaneous injections of 3.106 MOS-J cells prepared in a 50 μl PBS solution containing matrigel 4.5 g/L were performed after shaving the mouse’s flank. In all cases, the syringes were stored on ice before the injection.
Model characterization
The primary objective was to validate the technique and reproducibility of MOS-J tumor cell inoculations in different injection sites (intra-osseous, intra-muscular/paratibial, subcutaneous), and to assess tumor growth kinetics in control C57BL/6 mice in the absence of treatment. Three groups of 5 mice were formed, one for each injection site. The mice were monitored for 28 days from the day of injection, and tumor growth was assessed by precise and regular measurement of tumor volume every 3 to 4 days with a caliper. Tumor volume (V) expressed in mm3 was calculated using the formula V = (L × W × P)/2, where L, W and P are the perpendicular diameters of the tumor in the three space planes [23]. Radiographic characterization of bone lesions from the intra-muscular, paratibial and intra-osseous bone groups was performed on Day 15 and Day 21 after tumor cell injection under general anesthesia. Bone lesions were also quantified after sacrifice in the same mice, with the microtomograph Skyscan 1076 (Bruker, Belgium) using the following acquisition parameters: pixel size 18 microns, 50 kV, Al filter 0.5 mm and 0.6° rotation phase. The images were reconstructed using the software NRecon Skyscan then treated in three dimensions using the 32-bit software CTVox Skyscan. Histologic tumor characterization was performed by standard HE (hematoxylin-eosin) staining and by immuno-histo-chemistry (IHC) for CD146 (vascularization), Ki67 (proliferation) and caspase 3 (apoptosis) markers. For this, the legs with tumors or subcutaneous tumors were fixed in 10% buffered formaldehyde solution, decalcified if necessary in 4% ethylene diamine tetraacetic acid solution (EDTA) and 0.2% pH 7.4 paraformaldehyde, embedded in paraffin, cut into 3 μm sections and mounted on slides. CD146, Ki67 (ImmunoRatio [24]), active caspase 3 staining and necrosis degree evaluation were obtained with the ImageJ software [25].
Evaluating tolerance and treatment effectiveness in the MOS-J cell line
The aim of this experiment was to evaluate the safety and efficacy of chemotherapy drugs (doxorubicin, cisplatin, ifosfamide) on the MOS-J model, and to allow us to choose optimal chemotherapy doses. 71 mice were injected in the intramuscular/paratibial site with 3.106 MOS-J cells for this experiment. The tumor volume and growth kinetics were assessed biweekly. Tolerance to chemotherapy was evaluated weekly by measuring weight, and by assessing mouse behavior and lethality. Chemotherapy treatment was initiated when the average tumor volume in one group exceeded 100 mm3 [26,27]. The molecules were injected alone, at three different doses with an intermediate dose for the most commonly-used dose in the literature [26-31]. The intravenous (retro-orbital) injections were all performed biweekly in 50 or 100 μl of PBS solution: cisplatin 0.5 mg/kg, 2 mg/kg and 4 mg/kg; ifosfamide 10 mg/kg, 50 mg/kg and 100 mg/kg; doxorubicin 0.5 mg/kg, 2 mg/kg and 4 mg/kg. The control group received injections of 50 μl PBS.
Evaluating the impact of different injection environments on the effects of monotherapy
The aim of this experiment was to compare the therapeutic efficacy of chemotherapeutic molecules on tumor growth in the MOS-J model induced in different injection sites (paratibial/intramuscular, intra-osseous and subcutaneous), and to assess the histologic response to these different treatments. Three groups of 28 mice were established (one group for each injection zone) and 3.106 MOS-J cells were injected per mouse. Each group was then divided into 3 sub-groups, receiving different treatments: cisplatin 2 mg/kg, doxorubicin 4 mg/kg, and ifosfamide 100 mg/kg, plus a control group. The tumors were characterized histologically by analyzing CD146, Ki67 (ImmunoRatio application), and caspase 3 staining, and evaluating the degree of necrosis.
Retrospective clinical analysis
In the second part of the study, the main objective was to determine a potential correlation between the location of residual live tumor cells on post-chemotherapy resection pieces and the overall survival of patients with osteosarcoma (OS2006 cohort of 350 patients) [10]. We initially focused on a pilot phase in ten patients operated on in Nantes, to assess the feasibility and potential trends between overall survival and localization of live tumor cells. The following criteria were required: patients had to have been operated on in Nantes, with histological blades available in the archives of the pathology department. The osteosarcomas had to be of the osteoblast type in an initial biopsy carried out before 2012 for a minimum follow-up period of 3 years (Cohort OS2006). Huvos and Rosen I, II and III scores were included in this study. Huvos and Rosen scores of IV were excluded (complete necrosis). Patients whose biopsies were not available were also excluded. The location of residual live osteosarcoma cells was evaluated in relation to tissue type (cancellous bone, cortical bone, cartilage, soft tissue). General clinical data, together with tumor (pathology, metastases), surgical (margins, type of resection), medical (adjuvant chemotherapy and neo-adjuvant) and survival data were also collected. Mapping of the viable residual tumor cells based on different types of tissue: cancellous bone, cortical bone, cartilage, and soft tissue, was carried out in coordination with the pathology team, all slides being read and blind analyzed by a pair of pathologists. Our histology analysis was similar to that reported in the study by Picci et al [12]. Preferential areas of live cells were determined using anatomical frame patterns filled during blade proofreading. All sagittal and frontal blades with a rate of live tumor cells ≥ 1% were read. Cell density was divided into 2 levels: high (corresponding to very individualized focal osteosarcoma colonies) and low, corresponding to diffuse distribution. Histological proofreading was carried out blinded to the survival outcomes.
Statistical analysis
Data were collected on Microsoft Excel and analyzed with the GraphPad Prism 7 software.
In vitro experiments were analyzed with the IC50 logarithmic curve. The in vivo experiment results were analyzed between more than two distinct populations using the ANOVA One-way (only one condition tested) or Two-way (two conditions tested) test, applying the Sidak test correction for multiple comparisons. Analyses of two populations were carried out using the non-parametric Mann-Whitney test. The standard deviations are shown in the figures. Survival curves were estimated with the Kaplan-Meyer test, and the comparison between these curves was performed using the Log-Rank test. The alpha risk for all of these tests was set at 5% with a significance of P < 0.05.
Results
In vitro experiments
Cell proliferation was determined by crystal violet staining in 96-well plates. Mafosfamide (the metabolized form of ifosfamide), doxorubicin and cisplatin were added at increased concentrations (from 10-8 M to 10-3 M) to fresh culture medium. All three treatments induced a cytotoxic effect on the MOS-J osteosarcoma cell line, but with varying patterns (Figure 1). All the compounds tested inhibited tumor cell proliferation in vitro, with a mean of median inhibitory concentrations (IC50) of 1.09 μM (1.43 and 0.69 μM) for cisplatin (two independent series of experiments), 0.11 μM (0.14 and 0.07 μM) for doxorubicin, and 4.90 μM (4.57 and 5.22 μM) for mafosfamide (Figure 1). These in vitro experiments allowed us to both validate the sensitivity of the MOS-J cell line to the 3 chemotherapy molecules of interest, and develop in vivo approaches in models induced from this cell line.
Figure 1.
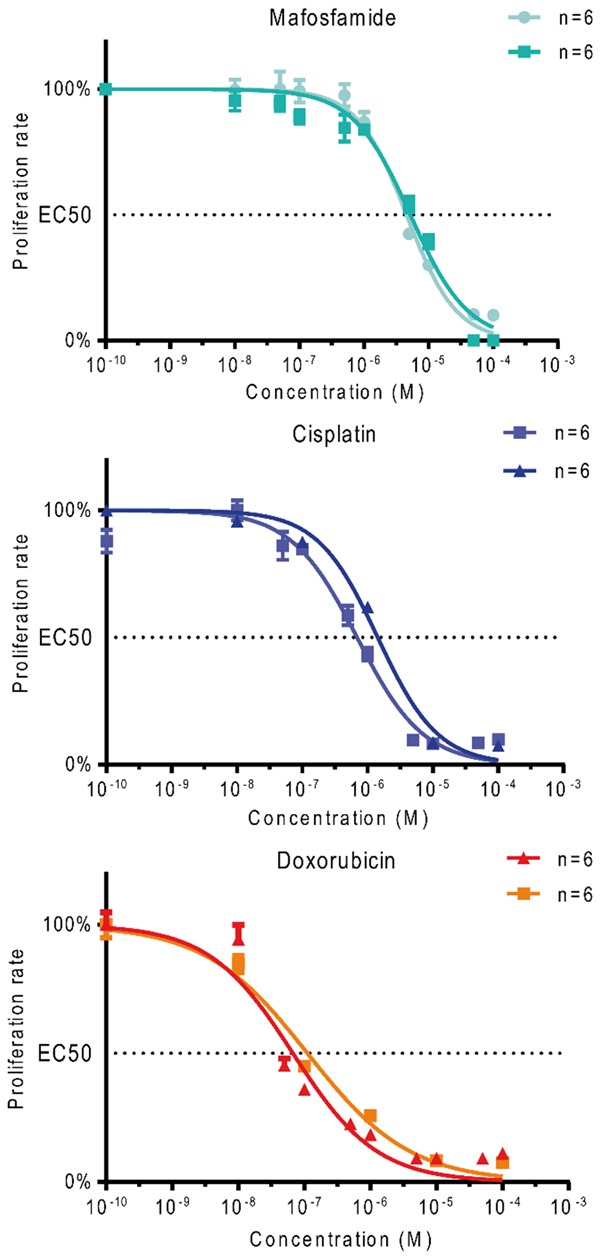
Effect of chemotherapy drugs (mafosfamide, cisplatin, and doxorubicin) on MOS-J osteosarcoma cell proliferation. Cell proliferation is given as a percentage of control.
In vivo experiments
Model characterization
Tumor growth was compared in C57BL/6J mice in models induced by injection of 3.106 MOS-J cells into different sites (intra-muscular paratibial, intra-osseous, subcutaneous). No significant difference was observed in tumor growth between the models induced in the intra-osseous and intra-muscular paratibial sites, with respective average volumes on D28 after tumor cell injection (end of experiment) of 628.8 mm2 ± 230.1 and 547 ± 185.9 mm2 (Figure 2). These tumor volumes were, however, significantly higher than the average volume of the tumors induced by cell injection in the subcutaneous site (mean tumor volume of 222.6 ± 56.2 mm2 on D28, respectively P = 0.0049 and P = 0.0056 compared with the intra-osseous and intra-muscular models). All injected mice developed a tumor after injection of 3.106 MOS-J cells.
Figure 2.
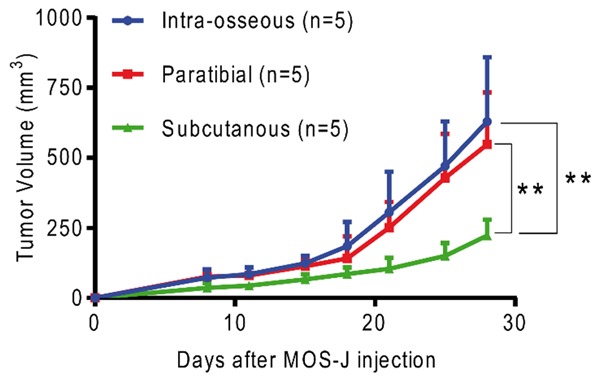
Mean tumor volume comparison between murine MOS-J models induced in intra-osseous, intra-muscular paratibial, and subcutaneous sites. Thresholds of significance: *: [0.05; 0.01 [, **: [0.01; 0.001 [, ***: ≤ 0.001.
Radiographic morphological analysis was performed on D15 and D21 after tumor cell injection, and revealed for the intra-osseous site a progressive evolution in metaphyseal heterogeneity with osteolysis and sclerosis (Figure 3). For the paratibial injection site, the images evoked a periosteal reaction with cortical sclerosis (Figure 3).
Figure 3.
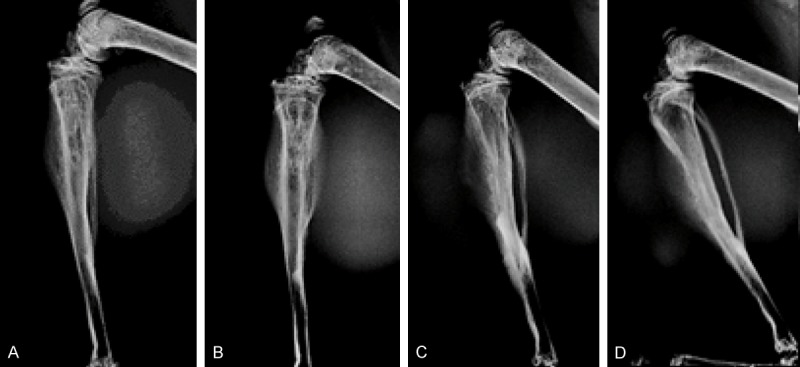
Bone lesions analyzed by X-ray profiles of injected legs. Day 15 (A, C), Day 21 (B, D) after tumor cell injection. Intra-osseous injection site (A, B), intra-muscular paratibial injection site (C, D).
Micro CT morphometric analysis was performed 28 days post-injection, when the mice were sacrificed (Figure 4). Mice with intra-osseous injections predominantly developed metaphyseal lesions with cancellous bone heterogeneity. For mice with intra-muscular paratibial injections, the damage predominated in the periosteal region, with thickening of the anterior cortical.
Figure 4.
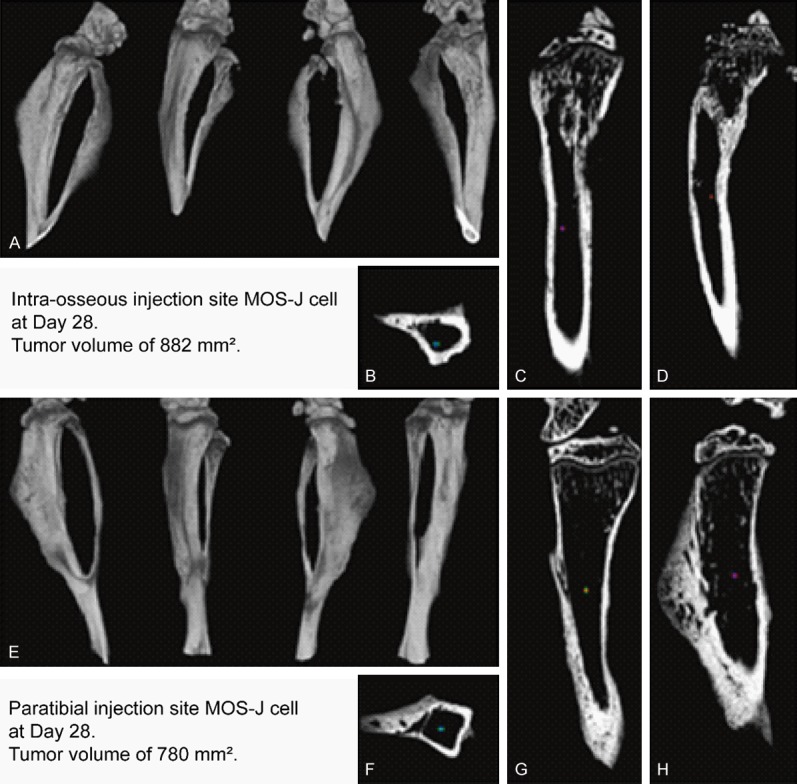
Bone micro-architecture analysis by micro-CT on Day 28 after tumor cell injection of legs with the tumor. Tumors were induced by intra-osseous (A-D) or intra-muscular paratibial (E-H) injection. Tridimensional reconstructions with lateral, anterior, medial and posterior view (A, E). Axial mid-diaphyseal view (B, F), frontal view (C, G), and sagittal view (D, H).
Histological analysis of vascularization (CD146), proliferation (Ki67) and apoptosis (caspase 3) was performed by standard HE staining, as well as by immunolabeling of a representative tumor (median tumor volume) in the group induced by the intra-osseous site injection, as well as intra-muscular paratibial injection (Figure 5). Three sections spaced at least one millimeter apart were analyzed with HE staining for these two groups. For tumors from the subcutaneous injection site, three tumor volumes were analyzed with HE staining at two different levels, spaced at least one millimeter apart. Only soft tissue not subjected to decalcification was analyzed with IHC to ensure better comparability. HE staining of histological sections was quantified with the ImageJ software with necrosis areas determined relative to the whole surface of the tumor. For CD146 and caspase 3 staining, IHC analysis was conducted through a semi-automated enforcement macro used in the laboratory. The analysis of Ki67 labeling was performed using the ImageJ ImmunoRatio software.
Figure 5.

Histological analysis of mice developing MOS-J tumors induced by intra-osseous injection. Longitudinal leg section with HE staining to assess degree of necrosis (A), IHC staining of tumor at × 5 magnification for proliferation with Ki67 (B), × 10 for vascularization with CD146 (C) and × 5 for apoptosis with caspase 3 (D). T: Tumor, N: areas of necrosis.
Regarding necrosis, a significant difference was measured by the one-way ANOVA test between the tumor necrosis rate in tumors induced in the subcutaneous site (7.88% ± 1.18) and in the intra-muscular paratibial site (4.03% ± 2.06, difference of 3.85%, 95% CI [0.62; 7.08]; P = 0.02). No significant difference was observed in the tumor necrosis rate between tumors induced by subcutaneous injection and intra-osseous tumors 4.69% ± 1.30 (difference of 3.20%, 95% CI [-0.03; 6.42]).
For the proliferation rate assessed by Ki67 labeling, no significant difference was observed between the proliferation index values of tumors induced in the intra-muscular paratibial (23.6% ± 1.83), intra-osseous (12.15% ± 6.57) and subcutaneous (26.67% ± 3.73) sites. Similarly, no significant differences were observed regarding vascularization, with values of 190.81 ± 31.87 CD146 positive cells/mm2 for the intra-muscular paratibial site, 260.04 ± 80.97 for the intra-osseous site, and 219.6 ± 26.96 for the subcutaneous site. Regarding apoptosis (caspase 3 staining), a significant difference was measured by the One-Way ANOVA test between the apoptosis index in the model induced in the subcutaneous intra-osseous sites (respectively 2.83% ± 0.87 and 0.94 ± 0.17%, difference of 1.89%, 95% CI [0.20; 3.57]; P = 0.03), with the apoptosis index of tumors induced in the intra-muscular paratibial site being 1.49% ± 0.34 (Figure 6).
Figure 6.
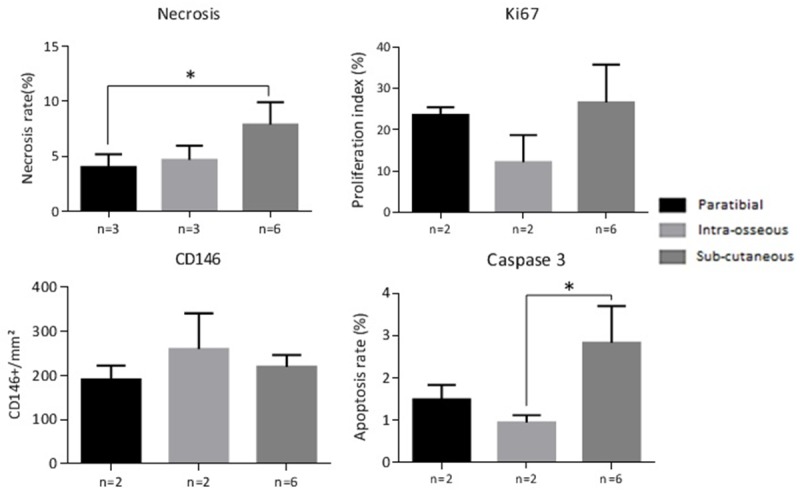
Histological analysis of necrosis (as a percentage of tumor area), cell proliferation with IHC Ki67 labeling (expressed as a proliferation index), vascularization with IHC CD146 labeling, and the rate of apoptosis with IHC caspase 3 labeling. Thresholds of significance: *: [0.05; 0.01 [, **: [0.01; 0.001 [, ***: ≤ 0.001.
Evaluating tolerance and treatment effectiveness on MOS-J models
The treatments were administered biweekly to the mice at three increasing doses. A control group was injected with a PBS solution with the same volume. We did not observe major weight loss secondary to chemotherapy (weight loss averages remained below 10% even at the highest doses). On the other hand, one mouse died on D29 in the cisplatin 4 mg/kg group, due to intolerance in the absence of an obvious cause. The mice in this group appeared to slow down, with a decrease in vivacity. The cisplatin 4 mg/kg dose was considered to be poorly tolerated. Cisplatin inhibits tumor growth at doses of 2 mg/kg and 4 mg/kg with a threshold at the dose of 2 mg/kg. 40 days post-injection, the difference was highly significant (ANOVA One-Way test). A significant difference of 770.7 mm3 95% CI [233.7; 1307.7] between the cisplatin 2 mg/kg (686.7 mm3 ± 216.0) and the control groups was observed. For doxorubicin, only the dose of 4 mg/kg inhibits tumor growth, with a significant difference compared to the control group of 756.0 mm3 95% CI [284.3; 1227.6] and an average tumor volume of 701.4 mm3 ± 205.1 on day 40. For the group treated with ifosfamide, the dose of 100 mg/kg inhibits tumor growth, with a significant difference of 779.8 mm3 compared to the control 95% CI [251.2; 1308.5] and an average tumor volume of 677.6 mm3 ± 384.4 on day 40. The doses of cisplatin 2 mg/kg, doxorubicin 4 mg/kg and ifosfamide 100 mg/kg were then selected (Figure 7).
Figure 7.
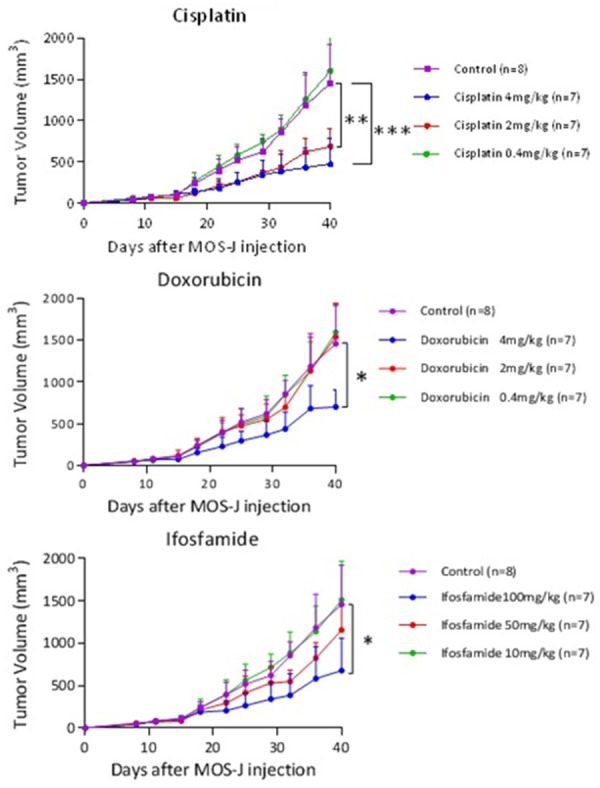
Kinetics of average tumor volumes according to treatment (cisplatin, doxorubicin, ifosfamide) at different doses. The treatment was introduced on D15. Thresholds of significance: *: [0.05; 0.01 [, **: [0.01; 0.001 [, ***: ≤ 0.001.
Evaluating the impact of different injection environments on the effects of monotherapy
Growth kinetics study: the treatment injections were performed biweekly and started as soon as the average tumor volume in one of the groups exceeded 100 mm3. They were started on D12 for this manipulation.
In the intra-muscular paratibial model, significant differences in mean tumor volume were observed on D28 between ifosfamide 100 mg/kg (195.9 mm3 ± 130.6; 95% CI [75.08, 316.6]) and the control group (519.9 mm3 ± 518.4; 95% CI [370.7; 669.0]) and between cisplatin 2 mg/kg (303.0 mm3 ± 90.7; 95% CI [219.2, 386.8]) and the control group (One-Way ANOVA, P = 0.03). Doxorubicin 4 mg/kg (376.6 mm3 ± 183.9; 95% CI [205.6, 545.7]) did not induce a significant inhibitory effect on D28 in this model.
In the intra-osseous model, a significant difference in tumor volume of 301.2 mm3 95% CI [47.8; 554.7] was observed on D28 between doxorubicin 4 mg/kg (138.8 mm3 ± 27.8; 95% CI [109.9; 167.8]) and the control group (440.1 mm3 ± 248.3; 95% CI [210.4; 669.7]; One-Way ANOVA test; P = 0.038). No difference was observed between cisplatin 2 mg/kg (211.2 mm3 ± 144.4; 95% CI [59.7; 362.7]) and the control group, or between ifosfamide 100 mg/kg (266.4 mm3 ± 200.0; 95% CI [81.4, 451.4]) and the control group. The control groups for the intra-muscular paratibial and intra-osseous models were not significantly different on D28 (One-Way ANOVA test) (Figure 8). In the subcutaneous model, we were unable to draw any conclusions because of tumor failure. A significant difference in tumor volume of 236.8 mm3 ± 76.26 was observed on D28 with treatment with doxorubicin 4 mg/kg (P = 0.024) between the intra-osseous and intra-muscular paratibial models using the Two-Way ANOVA test. These results suggest that the response to doxorubicin varies in relation to the microenvironment (Figure 9).
Figure 8.
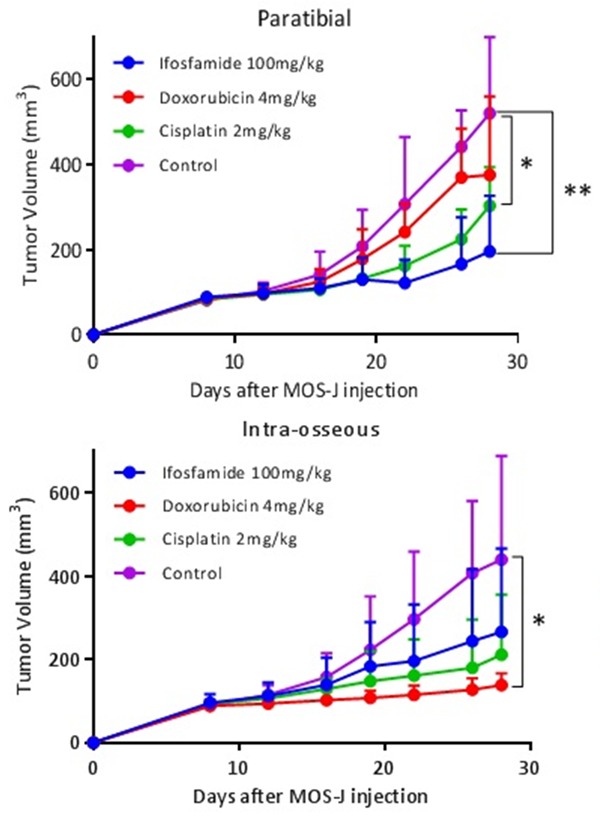
Kinetics of average tumor volumes according to different injection sites and treatments (cisplatin 2 mg/kg, doxorubicin 4 mg/kg, ifosfamide 100 mg/kg and control group). The treatment was introduced on D12. Thresholds of significance: *: [0.05; 0.01 [, **: [0.01; 0.001 [, ***: ≤ 0.001.
Figure 9.
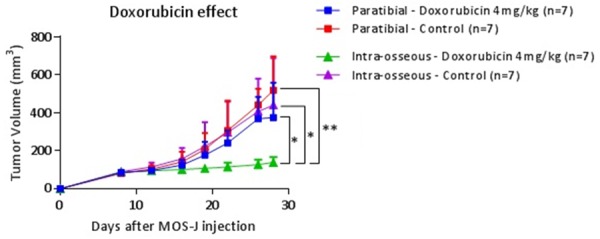
Kinetics of average tumor volumes in doxorubicin 4 mg/kg and the control group in intra-muscular paratibial and intra-osseous injection sites. The treatment was introduced on D12. Thresholds of significance: *: [0.05; 0.01 [, **: [0.01; 0.001 [, ***: ≤ 0.001.
Histological analysis was performed by standard hematoxylin eosin (HE) staining, as well as by immunolabeling of vascularization, proliferation and apoptosis (respectively by CD146, Ki67, and caspase 3 assessment). A significant difference in necrosis rates of 9.78%; 95% CI [0.09; 19.47] was observed with doxorubicin 4 mg/kg between the intra-muscular paratibial model (3.80% ± 3.48) and the intra-osseous model (13.59% ± 9.24) (Two-Way ANOVA test, P = 0.045). No other significant difference could be observed within the same treatment between the intra-muscular paratibial and intra-osseous models. Regarding Ki67 proliferation, vascularization by CD146 as well as caspase 3 markers, no significative difference could be shown between the various treatments or for the different sites by the ANOVA Two-Way multiple comparison test (Figure 10).
Figure 10.
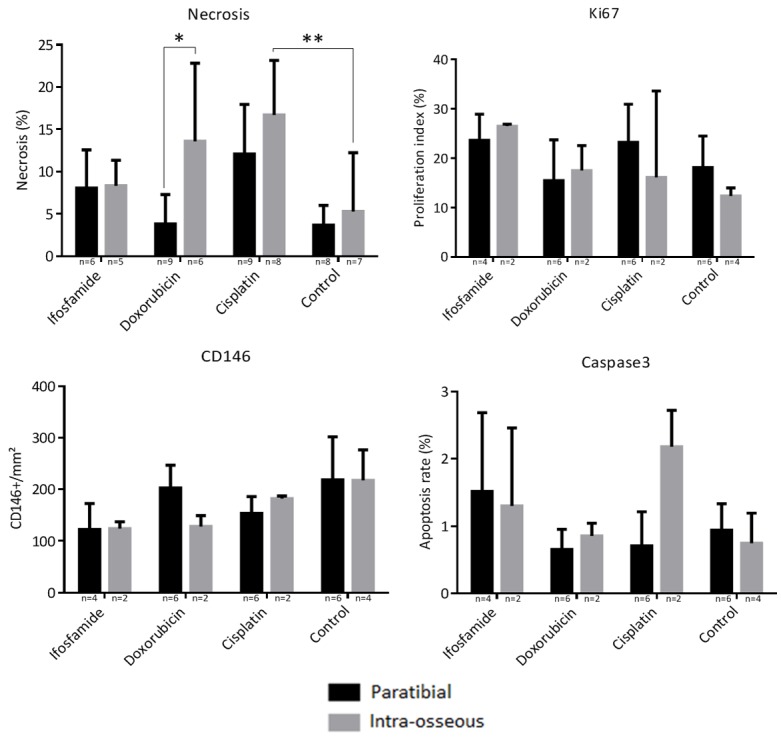
Histological analysis of necrosis (percentage of necrosis relative to the tumor area), cell proliferation with IHC labeling of Ki67 (expressed as a proliferation index), vascularization with IHC CD146 labeling, apoptosis with IHC cell labeling of caspase 3. Thresholds of significance: *: [0.05; 0.01 [, **: [0.01; 0.001 [, ***: ≤ 0.001.
Retrospective analysis
General data
The population used in our study included 10 patients (Table 1) with a sex ratio of 1.5, an average age at diagnosis of 17.4 years ± 4.9 (range: 9-24 years). In six out of 10 cases (60%), the osteosarcoma was localized in the lower femur, and pathological fractures were present 3 times out of 10 (30%). The resection margins were R0 for all the patients in the series (absence of resection margin invasion).
Table 1.
General data-patients with osteoblastic osteosarcoma
| Patients | Sex | Age | Location | Fracture | Metastasis | Excision | Margins |
|---|---|---|---|---|---|---|---|
| 1 | Male | 19 | Distal femur | No | No | Extra-articular | R0 |
| 2 | Female | 19 | Distal femur | Yes | No | Articular | R0 |
| 3 | Male | 20 | Distal femur | Yes | No | Articular | R0 |
| 4 | Male | 11 | Distal femur | No | Pulmonary | Articular | R0 |
| 5 | Female | 24 | Medium femur | No | No | Intercalary | R0 |
| 6 | Female | 9 | Proximal tibia | No | No | Articular | R0 |
| 7 | Male | 15 | Distal femur | No | No | Articular | R0 |
| 8 | Male | 22 | Proximal humerus | No | No | Extra-articular | R0 |
| 9 | Male | 14 | Distal femur | No | No | Extra-articular | R0 |
| 10 | Female | 21 | Complete femur | Yes | No | Femorectomy | R0 |
Histologic mapping
The population presented a Huvos and Rosen score of III in 8 cases, one had a score of II with 13% viable cells, and one case a score of I with 80% viable cells (Table 2). The initial tumor had affected both the spongy, cortical and soft tissues in all cases, but had reached the cartilage only once. Cells remained alive in the soft tissues in 70% of cases, in cancellous bone in 100% of cases, in cortical tissue in 80% of cases, and in the cartilage in 0%, even in the case of extra-articular excision.
Table 2.
Initial anatomopathological data (Huvos and Rosen scores) and then as observed during the study (location of the necrotic tumor and viable osteosarcoma cells, as well as their density)
| Patients | Huvos & Rosen | Tumor Location | ||||||||
|---|---|---|---|---|---|---|---|---|---|---|
|
| ||||||||||
| Soft tissue | Cancellous bone | Cortical bone | Cartilage | |||||||
|
| ||||||||||
| Score | % | Necrosis | Viable | Necrosis | Viable | Necrosis | Viable | Necrosis | Viable | |
| 1 | III | 3.5 | Yes | Focal | Yes | Focal | Yes | Focal | No | No |
| 2 | III | 5 | Yes | No | Yes | Focal | Yes | No | No | No |
| 3 | II | 13 | Yes | Focal | Yes | Focal | Yes | Focal | No | No |
| 4 | III | 1.3 | Yes | Diffuse | Yes | Diffuse | Yes | Diffuse | No | No |
| 5 | III | 3 | Yes | Diffuse | Yes | Diffuse | Yes | Diffuse | No | No |
| 6 | III | 4.2 | Yes | No | Yes | Focal | Yes | Focal | No | No |
| 7 | I | 80 | Yes | Diffuse | Yes | Diffuse | Yes | Diffuse | No | No |
| 8 | III | 1.3 | Yes | No | Yes | Focal | Yes | No | Yes | No |
| 9 | III | 7.4 | Yes | Focal | Yes | Focal | Yes | Focal | No | No |
| 10 | III | 3 | Yes | Focal | Yes | Focal | Yes | Focal | No | No |
When viable cells formed focal colonies, they could affect spongy bone alone, or spongy bone and cortical bone, or the association of spongy bone, cortical bone, and soft tissue. No residual viable cell colony was identified within the cartilage (Figure 11).
Figure 11.
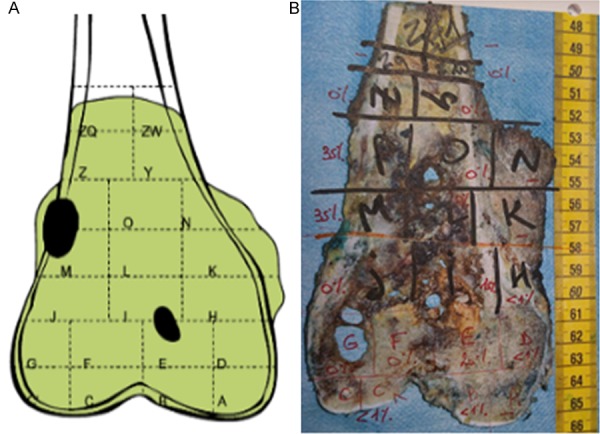
Frontal section of the distal femur resection piece of patient n°1. Schematic representation of areas where viable tumor cells were observed (A), in black: focal colonies with high cell density (one between soft tissues, cortical bone and cancellous bone, the other in cancellous bone), in green: necrotic tumor. Picture identifying the different slides with percentage of residual viable tumor cells in red (B).
Survival analysis
A significant difference in survival was shown between scores ≥ 3 (8 cases) and scores ≤ 2 (score II and score I) by the Log-Rank test (P < 0.001) (Figure 12).
Figure 12.
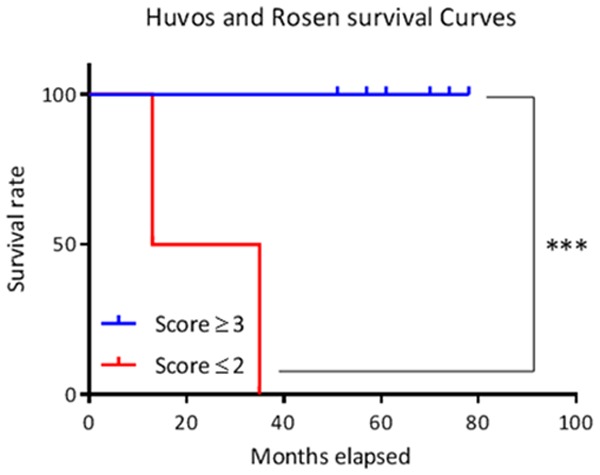
Survival curves according to Huvos and Rosen score. Thresholds of significance: *: [0.05; 0.01 [, **: [0.01; 0.001 [, ***: ≤ 0.001.
However, we did not observe any significant difference in survival between patients with viable soft-tissue osteosarcoma cells (7 cases) and others (3 cases), or between patients with focal (8 cases) or diffuse repartition (2 cases) of these cells (Figure 13).
Figure 13.
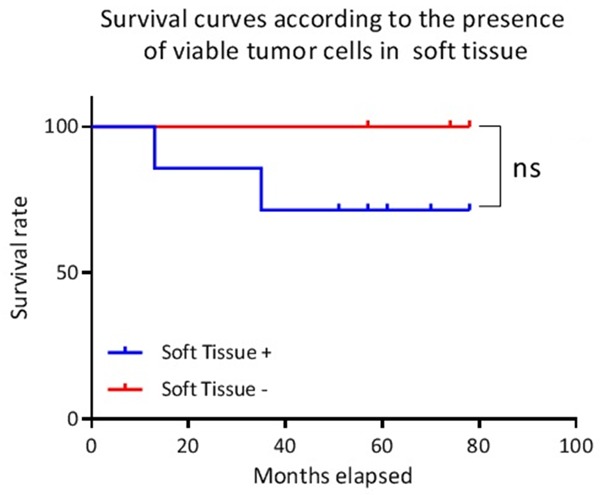
Survival curves according to the presence of viable tumor cells in soft tissues. Ns: not significant.
Feasibility
We were able to map viable cells remaining on the tumor with the help of anatomopathologists. The analysis focused only on the slides with a viable cell rate > 1%, defined during the initial analysis. It was impossible to identify well-defined colonies due to the extent and low density of the osteosarcoma cells in some patients. In these cases, the term “diffuse distribution” was chosen, with the cells present in soft tissue, cortical bone and cancellous bone.
Discussion
The origin of this work is based on the clinical observation that certain osteosarcoma patients defined as good responders to neo-adjuvant chemotherapy by the Huvos and Rosen score (about 25%) will nevertheless relapse or go metastatic [9,11]. Our research project is based on recent interest in microenvironment as a means of understanding tumor mechanisms in oncological research [13-15]. We hypothesize that the microenvironment influences the histological response to chemotherapy in osteosarcoma, depending on the different types of tissue invaded. Cellular, architectural, biological and chemical variability may be at the origin of such regulation.
In this context, two complementary approaches were carried out to support our hypothesis: (i) a retrospective anatomopathological analysis was performed on excision pieces from ten patients from the OS2006 cohort [10]. A potential correlation was evaluated between the localization of residual viable tumor cells and patient survival. The purpose of this pilot study was to assess feasibility and potential trends; (ii) complementary preclinical modeling was also performed to study the concept of response to chemotherapy that depends on the environment. Different tumoral microenvironments were mimicked by inducing several mouse models of syngenic osteosarcoma following intra-muscular paratibial, intra-osseous, and subcutaneous injection of tumor cells.
In vitro experiments allowed us to demonstrate MOS-J line sensitivity to the therapeutic molecules selected for our research project (cisplatin, ifosfamide, doxorubicin), chosen for their use in the treatment of osteosarcoma. These molecules are most often used as part of the API-AI protocol [10,32,33] as an alternative to high dose methotrexate in patients over the age of 18. The proliferation inhibition observed in vitro allowed us to develop models induced with the same MOS-J cells in C57BL/6J mice for the three molecules tested. There are no results on these molecules on the MOS-J cell line in the literature to our knowledge [34].
The murine MOS-J osteosarcoma cell line was used to develop the corresponding syngeneic model in C57BL/6J mice, allowing us to take into account the immune system, which is crucial for studying the influence of the microenvironment. These experiments need to be reproduced in other models of syngenic osteosarcoma (murine K7M2, POS-1), as well as in models induced from human biopsies (PDX models) or cell lines in Nude mice, even if the immune compartment does not totally imitate the human situation. We were thus able to compare the responses of chemotherapy-resistant or -sensitive tumors as a means of assessing the potential role of different environments in the respective responses.
Of the three models we developed in the in vivo experiments, the subcutaneous-induced model has never been described in the literature with MOS-J cells. In the first set of experiments, all tumors developed, reaching a minimum volume of 150 mm3 on D28 (making histological analysis possible). However, we did not succeed in reproducing these results in our second subcutaneous model (tumor volume regressions were observed and no tumors had exceeded the volume of 125 mm3 on D28). The intra-muscular paratibial model induced with MOS-J cells with tumor initiation in muscle tissue in C57BL/6J mice is well described in the literature [22,35] and is frequently used in our laboratory for its easy handling and reproducibility. The intra-osseous model is the one that best reproduces osteosarcoma development in humans (as cancellous bone is the tumor niche). In spite of this advantage, from a technical point of view it has greater complexity, with several protocols described [36,37]. The protocol we used is based on the one described by Uluçkan et al [37]. This model is mastered in our study with satisfactory reproducibility.
A significant difference in therapeutic response between the intra-muscular paratibial and intra-osseous models was only observed for doxorubicin 4 mg/kg, and not for ifosfamide 100 mg/kg or cisplatin 2 mg/kg. The inhibitory effect of doxorubicin on tumor progression was moderate in the intra-muscular model, while it significantly inhibited intra-osseous tumor growth, with low dispersion in tumor volumes. Histological analysis indicated a higher rate of tumor necrosis in the intra-osseous model treated with doxorubicin 4 mg/kg than in the intra-muscular model, confirming the histological difference in response to treatment between these two sites. The following hypothesis may explain this phenomenon: initial tumor growth in cancellous bone in the intra-osseous model may facilitate the diffusion of doxorubicin directly in contact with the tumor due to its strong vascularization. Conversely, the intra-muscular model, because of its aberrant neovascularization, may limit the diffusion of this molecule [12,38]. Moreover, doxorubicin has limited deep tumor penetration: concentration gradients in tissue distribution have been reported for this molecule in breast cancer and murine models [21,39,40]. There may be several explanations for this finding: precarious vasculature, hypoxia or acid pH [21,41-43], for example. This difference is potentially related to the tumor microenvironment even though we did not observe any difference in CD146 labeling in our series. However, other methodological approaches could be proposed: for example, in future experiments, histology focused on perfusion or functional imaging may better evaluate tissue perfusion [44,45]. It is therefore necessary to better characterize the microenvironment in order to understand this difference in therapeutic response: quantitative analysis by direct immunofluorescence would allow us to assess doxorubicin tissue penetration in relation to the different microenvironments [46,47], evaluating hypoxia and pH roles should also be studied between the different models [47], as should characterizing the immune microenvironment by IHC to identify the macrophages and lymphocytes infiltrating the tumors.
The second part of our study concerned a retrospective anatomopathological analysis which was initially limited to a pilot phase in ten patients from the OS2006 cohort [10], implying that caution is required when interpreting our results. We evaluated feasibility and potential trends, focusing the analysis on the tissue localization of viable residual osteosarcoma cells in surgical resection pieces. Analyzing the tissue localization of viable osteosarcoma cells with the help of trained pathologists did not reveal any particular technical problems. Viable cells presented as either well-defined focal colonies or were dispersed in diffuse form, affecting all tissues. This re-analysis was relatively rapid, limited to slides with more than one percent of viable tumor cells. However, limitations linked to the lack of reproducibility inherent to the subjectivity of the histological analysis are possible. The results obtained in our study differ from those of Picci et al [12], who identified preferential survival zones in soft tissue in 63% of cases (versus 70% in our study). On the other hand, those authors only observed a 58% survival rate in spongy zones, compared to 100% in our study. Our results need to be weighted in relation to the small number studied, the possible differences in analysis protocol, and evolution in chemotherapy protocols.
Despite its small size, our series confirms the effectiveness of the Huvos and Rosen score with regard to the prognostic evaluation of survival. Patients with a Huvos and Rosen score ≤ 2 have a higher probability of death according to the literature [5-7]. On the other hand, we did not find any significant difference in survival between the different localizations of residual viable tumor cells. A potential severity criterion regarding the presence of viable cells in soft tissues should be re-evaluated, with 100% survival for patients without soft tissue involvement versus 62.5% for others. Tissue microenvironment (vascularization, pH, oxygenation, etc) may explain this difference in chemotherapy response, with limited efficacy of the molecules in these tumor localizations. This would represent areas of potential chemotherapy resistance, with potentially higher metastatic power. A larger cohort is needed to explore this hypothesis.
Our translational study nevertheless seems to show a convergence of the two approaches developed. The location of viable tumor cells in soft tissues, correlated with poor potential prognosis (based on the retrospective anatomopathological analysis), may be related to the decreased efficacy of doxorubicin observed in the intra-muscular paratibial preclinical model (where the tumor was initially localized in the muscular soft tissues). This study also validated our different preclinical models of osteosarcoma as being representative of the microenvironment for the study of resistance to chemotherapy.
Acknowledgements
This work was supported by the Fondation pour la Recherche Médicale, FRM grant number DEA20150633177 awarded to Vincent Crenn. Experimental Therapeutic unit (Guylène Hamery, UTE Phan, IRS-UN, 8 quai Moncousu, BP 70721, 44007 Nantes Cedex 1).
Disclosure of conflict of interest
None.
References
- 1.Ottaviani G, Jaffe N. The epidemiology of osteosarcoma. Cancer Treat Res. 2009;152:3–13. doi: 10.1007/978-1-4419-0284-9_1. [DOI] [PubMed] [Google Scholar]
- 2.Klein MJ, Siegal GP. Osteosarcoma anatomic and histologic variants. Am J Clin Pathol. 2006;125:555–581. doi: 10.1309/UC6K-QHLD-9LV2-KENN. [DOI] [PubMed] [Google Scholar]
- 3.Botter SM, Neri D, Fuchs B. Recent advances in osteosarcoma. Curr Opin Pharmacol. 2014;16:15–23. doi: 10.1016/j.coph.2014.02.002. [DOI] [PubMed] [Google Scholar]
- 4.Gibbs CP, Levings PP, Ghivizzani SC. Evidence for the osteosarcoma stem cell. Curr Orthop Pract. 2011;22:322–326. doi: 10.1097/BCO.0b013e318221aee8. [DOI] [PMC free article] [PubMed] [Google Scholar]
- 5.Bielack SS, Kempf-Bielack B, Delling G, Exner GU, Flege S, Helmke K, Kotz R, Salzer-Kuntschik M, Werner M, Winkelmann W, Zoubek A, Jürgens H, Winkler K. Prognostic factors in highgrade osteosarcoma of the extremities or trunk: an analysis of 1,702 patients treated on neoadjuvant cooperative osteosarcoma study group protocols. J. Clin. Oncol. 2002;20:776–790. doi: 10.1200/JCO.2002.20.3.776. [DOI] [PubMed] [Google Scholar]
- 6.Davis AM, Bell RS, Goodwin PJ. Prognostic factors in osteosarcoma: a critical review. J. Clin. Oncol. 1994;12:423–431. doi: 10.1200/JCO.1994.12.2.423. [DOI] [PubMed] [Google Scholar]
- 7.Friebele JC, Peck J, Pan X, Abdel-Rasoul M, Mayerson JL. Osteosarcoma: a meta-analysis and review of the literature. Am J Orthop (Belle Mead NJ) 2015;44:547–553. [PubMed] [Google Scholar]
- 8.Luetke A, Meyers PA, Lewis I, Juergens H. Osteosarcoma treatment-Where do we stand? A state of the art review. Cancer Treat Rev. 2014;40:523–532. doi: 10.1016/j.ctrv.2013.11.006. [DOI] [PubMed] [Google Scholar]
- 9.Rosen G, Marcove RC, Caparros B, Nirenberg A, Kosloff C, Huvos AG. Primary osteogenic sarcoma: the rationale for preoperative chemotherapy and delayed surgery. Cancer. 1979;43:2163–2177. doi: 10.1002/1097-0142(197906)43:6<2163::aid-cncr2820430602>3.0.co;2-s. [DOI] [PubMed] [Google Scholar]
- 10.Piperno-Neumann S, Le Deley MC, Rédini F, Pacquement H, Marec-Bérard P, Petit P, Brisse H, Lervat C, Gentet JC, Entz-Werlé N, Italiano A, Corradini N, Bompas E, Penel N, Tabone MD, Gomez-Brouchet A, Guinebretière JM, Mascard E, Gouin F, Chevance A, Bonnet N, Blay JY, Brugières L Sarcoma Group of UNICANCER; French Society of Pediatric Oncology (SFCE); French Sarcoma Group (GSF-GETO) Zoledronate in combination with chemotherapy and surgery to treat osteosarcoma (OS2006): a randomised, multicentre, open-label, phase 3 trial. Lancet Oncol. 2016;17:1070–1080. doi: 10.1016/S1470-2045(16)30096-1. [DOI] [PubMed] [Google Scholar]
- 11.O’Kane GM, Cadoo KA, Walsh EM, Emerson R, Dervan P, O’Keane C, Hurson B, O’Toole G, Dudeney S, Kavanagh E, Eustace S, Carney DN. Perioperative chemotherapy in the treatment of osteosarcoma: a 26-year single institution review. Clin Sarcoma Res. 2015;5:17. doi: 10.1186/s13569-015-0032-0. [DOI] [PMC free article] [PubMed] [Google Scholar]
- 12.Picci P, Bacci G, Campanacci M, Gasparini M, Pilotti S, Cerasoli S, Bertoni F, Guerra A, Capanna R, Albisinni U, et al. Histologic evaluation of necrosis in osteosarcoma induced by chemotherapy regional mapping of viable and nonviable tumor. Cancer. 1985;56:1515–1521. doi: 10.1002/1097-0142(19851001)56:7<1515::aid-cncr2820560707>3.0.co;2-6. [DOI] [PubMed] [Google Scholar]
- 13.Hanahan D, Coussens LM. Accessories to the crime: functions of cells recruited to the tumor microenvironment. Cancer Cell. 2012;21:309–322. doi: 10.1016/j.ccr.2012.02.022. [DOI] [PubMed] [Google Scholar]
- 14.Alfranca A, Martinez-Cruzado L, Tornin J, Abarrategi A, Amaral T, de Alava E, Menendez P, Garcia-Castro J, Rodriguez R. Bone microenvironment signals in osteosarcoma development. Cell Mol Life Sci. 2015;72:3097–3113. doi: 10.1007/s00018-015-1918-y. [DOI] [PMC free article] [PubMed] [Google Scholar]
- 15.Junttila MR, de Sauvage FJ. Influence of tumour micro-environment heterogeneity on therapeutic response. Nature. 2013;501:346–354. doi: 10.1038/nature12626. [DOI] [PubMed] [Google Scholar]
- 16.Farmer P, Bonnefoi H, Anderle P, Cameron D, Wirapati P, Becette V, André S, Piccart M, Campone M, Brain E, Macgrogan G, Petit T, Jassem J, Bibeau F, Blot E, Bogaerts J, Aguet M, Bergh J, Iggo R, Delorenzi M. A stroma-related gene signature predicts resistance to neoadjuvant chemotherapy in breast cancer. Nat Med. 2009;15:68–74. doi: 10.1038/nm.1908. [DOI] [PubMed] [Google Scholar]
- 17.Meads MB, Hazlehurst LA, Dalton WS. The bone marrow microenvironment as a tumor sanctuary and contributor to drug resistance. Am Assoc Cancer Res. 2008;14:2519–2526. doi: 10.1158/1078-0432.CCR-07-2223. [DOI] [PubMed] [Google Scholar]
- 18.Yu L, Guo W, Zhao S, Wang F, Xu Y. Fusion between cancer cells and myofibroblasts is involved in osteosarcoma. Oncol Lett. 2011;2:1083–1087. doi: 10.3892/ol.2011.363. [DOI] [PMC free article] [PubMed] [Google Scholar]
- 19.Ader I, Gstalder C, Bouquerel P, Golzio M, Andrieu G, Zalvidea S, Richard S, Sabbadini RA, Malavaud B, Cuvillier O. Neutralizing S1P inhibits intratumoral hypoxia, induces vascular remodelling and sensitizes to chemotherapy in prostate cancer. Oncotarget. 2015;6:13803–13821. doi: 10.18632/oncotarget.3144. [DOI] [PMC free article] [PubMed] [Google Scholar]
- 20.McKeown SR. Defining normoxia, physoxia and hypoxia in tumours-implications for treatment response. Br J Radiol. 2014;87:20130676. doi: 10.1259/bjr.20130676. [DOI] [PMC free article] [PubMed] [Google Scholar]
- 21.Trédan O, Galmarini CM, Patel K, Tannock IF. Drug resistance and the solid tumor microenvironment. J Natl Cancer Inst. 2007;99:1441–1454. doi: 10.1093/jnci/djm135. [DOI] [PubMed] [Google Scholar]
- 22.Joliat MJ, Umeda S, Lyons BL, Lynes MA, Shultz LD. Establishment and characterization of a new osteogenic cell line (MOS-J) from a spontaneous C57BL/6J mouse osteosarcoma. In Vivo. 2002;16:223–228. [PubMed] [Google Scholar]
- 23.Tomayko MM, Reynolds CP. Determination of subcutaneous tumor size in athymic (nude) mice. Cancer Chemother Pharmacol. 1989;24:148–154. doi: 10.1007/BF00300234. [DOI] [PubMed] [Google Scholar]
- 24.Tuominen VJ, Ruotoistenmäki S, Viitanen A, Jumppanen M, Isola J. ImmunoRatio: a publicly available web application for quantitative image analysis of estrogen receptor (ER), progesterone receptor (PR), and Ki-67. Breast Cancer Res. 2010;12:R56. doi: 10.1186/bcr2615. [DOI] [PMC free article] [PubMed] [Google Scholar]
- 25.Hartig SM. Basic image analysis and manipulation in ImageJ. Curr Protoc Mol Biol. 2013 doi: 10.1002/0471142727.mb1415s102. Chapter 14: Unit 14.15. [DOI] [PubMed] [Google Scholar]
- 26.Sommer K, Peters SO, Robins IH, Raap M, Wiedemann GJ, Remmert S, Sieg P, Bittner C, Feyerabend T. A preclinical model for experimental chemotherapy of human head and neck cancer. Int J Oncol. 2001;18:1145–9. doi: 10.3892/ijo.18.6.1145. [DOI] [PubMed] [Google Scholar]
- 27.Wang HD, Shi YM, Li L, Guo JD, Zhang YP, Hou SX. Treatment with resveratrol attenuates sublesional bone loss in spinal cord-injured rats. Br J Pharmacol. 2013;170:796–806. doi: 10.1111/bph.12301. [DOI] [PMC free article] [PubMed] [Google Scholar]
- 28.Dhar S, Kolishetti N, Lippard SJ, Farokhzad OC. Targeted delivery of a cisplatin prodrug for safer and more effective prostate cancer therapy in vivo. Proc Natl Acad Sci U S A. 2011;108:1850–1855. doi: 10.1073/pnas.1011379108. [DOI] [PMC free article] [PubMed] [Google Scholar]
- 29.Dieudonné FX, Marion A, Marie PJ, Modrowski D. Targeted inhibition of T-cell factor activity promotes syndecan-2 expression and sensitization to doxorubicin in osteosarcoma cells and bone tumors in mice. J Bone Miner Res. 2012;27:2118–2129. doi: 10.1002/jbmr.1650. [DOI] [PubMed] [Google Scholar]
- 30.Hanly L, Figueredo R, Rieder MJ, Koropatnick J, Koren G. The effects of N-acetylcysteine on ifosfamide efficacy in a mouse xenograft model. Anticancer Res. 2012;32:3791–3798. [PubMed] [Google Scholar]
- 31.Ottewell PD, Mönkkönen H, Jones M, Lefley DV, Coleman RE, Holen I. Antitumor effects of doxorubicin followed by zoledronic acid in a mouse model of breast cancer. J Natl Cancer Inst. 2008;100:1167–1178. doi: 10.1093/jnci/djn240. [DOI] [PubMed] [Google Scholar]
- 32.Bielack S, Carrle D, Casali PG ESMO Guidelines Working Group. Osteosarcoma: ESMO clinical recommendations for diagnosis, treatment and follow-up. Ann Oncol. 2009;20(Suppl 4):137–139. doi: 10.1093/annonc/mdp154. [DOI] [PubMed] [Google Scholar]
- 33.Brugières L, Piperno-Neumann S. La chimiothérapie des ostéosarcomes. Oncologie. 2007;9:164–169. [Google Scholar]
- 34.Yang W, Soares J, Greninger P, Edelman EJ, Lightfoot H, Forbes S, Bindal N, Beare D, Smith JA, Thompson IR, Ramaswamy S, Futreal PA, Haber DA, Stratton MR, Benes C, McDermott U, Garnett MJ. Genomics of drug sensitivity in cancer (GDSC): a resource for therapeutic biomarker discovery in cancer cells. Nucleic Acids Res. 2013;41:D955–D961. doi: 10.1093/nar/gks1111. [DOI] [PMC free article] [PubMed] [Google Scholar]
- 35.Georges S, Chesneau J, Hervouet S, Taurelle J, Gouin F, Redini F, Padrines M, Heymann D, Fortun Y, Verrecchia F. A disintegrin and metalloproteinase 12 produced by tumour cells accelerates osteosarcoma tumour progression and associated osteolysis. Eur J Cancer. 2013;49:2253–2263. doi: 10.1016/j.ejca.2013.02.020. [DOI] [PubMed] [Google Scholar]
- 36.Cole HA, Ichikawa J, Colvin DC, O’Rear L, Schoenecker JG. Quantifying intra-osseous growth of osteosarcoma in a murine model with radiographic analysis. J Orthop Res. 2011;29:1957–1962. doi: 10.1002/jor.21474. [DOI] [PubMed] [Google Scholar]
- 37.Uluçkan Ö, Segaliny A, Botter S, Santiago JM, Mutsaers AJ. Preclinical mouse models of osteosarcoma. BoneKEy Rep. 2015;4:670. doi: 10.1038/bonekey.2015.37. [DOI] [PMC free article] [PubMed] [Google Scholar]
- 38.Eikenberry S. A tumor cord model for Doxorubicin delivery and dose optimization in solid tumors. Theor Biol Med Model. 2009;6:16. doi: 10.1186/1742-4682-6-16. [DOI] [PMC free article] [PubMed] [Google Scholar]
- 39.Lankelma J, Dekker H, Luque FR, Luykx S, Hoekman K, van der Valk P, van Diest PJ, Pinedo HM. Doxorubicin gradients in human breast cancer. Clin Cancer Res. 1999;5:1703–1707. [PubMed] [Google Scholar]
- 40.Primeau AJ, Rendon A, Hedley D, Lilge L, Tannock IF. The distribution of the anticancer drug doxorubicin in relation to blood vessels in solid tumors. Am Assoc Cancer Res. 2005;11:8782–8788. doi: 10.1158/1078-0432.CCR-05-1664. [DOI] [PubMed] [Google Scholar]
- 41.Brown JM, Wilson WR. Exploiting tumour hypoxia in cancer treatment. Nat Rev Cancer. 2004;4:437–447. doi: 10.1038/nrc1367. [DOI] [PubMed] [Google Scholar]
- 42.Minchinton AI, Tannock IF. Drug penetration in solid tumours. Nat Rev Cancer. 2006;6:583–592. doi: 10.1038/nrc1893. [DOI] [PubMed] [Google Scholar]
- 43.Sullivan R, Paré GC, Frederiksen LJ, Semenza GL, Graham CH. Hypoxia-induced resistance to anticancer drugs is associated with decreased senescence and requires hypoxia-inducible factor-1 activity. Am Assoc Cancer Res. 2008;7:1961–1973. doi: 10.1158/1535-7163.MCT-08-0198. [DOI] [PubMed] [Google Scholar]
- 44.Faye N. Thérapie cellulaire de l’angiogenèse tumorale: évaluation par imagerie morphologique et fonctionnelle en IRM et vidéomicroscopie de fluorescence. (Paris 11, 2011) [Google Scholar]
- 45.Jha AK, Tharp KM, Ye J, Santiago-Ortiz JL, Jackson WM, Stahl A, Schaffer DV, Yeghiazarians Y, Healy KE. Enhanced survival and engraftment of transplanted stem cells using growth factor sequestering hydrogels. Biomaterials. 2015;47:1–12. doi: 10.1016/j.biomaterials.2014.12.043. [DOI] [PMC free article] [PubMed] [Google Scholar]
- 46.Au JL, Jang SH, Wientjes MG. Clinical aspects of drug delivery to tumors. J Control Release. 2002;78:81–95. doi: 10.1016/s0168-3659(01)00488-6. [DOI] [PubMed] [Google Scholar]
- 47.Erapaneedi R, Belousov VV, Schäfers M, Kiefer F. A novel family of fluorescent hypoxia sensors reveal strong heterogeneity in tumor hypoxia at the cellular level. EMBO J. 2016;35:102–113. doi: 10.15252/embj.201592775. [DOI] [PMC free article] [PubMed] [Google Scholar]


