

Abstract
Increasing incidence of various cancers has been reported in diabetic patients. O‐linked N‐acetylglucosamine (O‐GlcNAc) modification of proteins at serine/threonine residues (O‐GlcNAcylation) is an essential post‐translational modification that is upregulated in diabetic patients and has been implicated in tumor growth. However, the mechanisms by which O‐GlcNAcylation promotes tumor growth remain unclear. Given that AMP‐activated kinase (AMPK) has been thought to play important roles in suppressing tumor growth, we evaluated the involvement of AMPK O‐GlcNAcylation on the growth of LoVo cells, a human colon cancer cell line. Results revealed that treatment with Thiamet G (TMG), an inhibitor of O‐GlcNAc hydrolase, increased both anchorage‐dependent and ‐independent growth of the cells. O‐GlcNAc transferase overexpression also increased the growth. These treatments increased AMPK O‐GlcNAcylation in a dose‐dependent manner, which led to reduced AMPK phosphorylation and mTOR activation. Chemical inhibition or activation of AMPK led to increased or decreased growth, respectively, which was consistent with the data with genetic inhibition of AMPK. In addition, TMG‐mediated acceleration of tumor growth was abolished by both chemical and genetic inhibition of AMPK. To examine the effects of AMPK O‐GlcNAcylation in vivo, the LoVo cells were s.c. transplanted onto the backs of BALB/c‐nu/nu mice. Injection of TMG promoted the growth and enhanced O‐GlcNAcylation of the tumors of the mice. Consistent with in vitro data, AMPK O‐GlcNAcylation was increased, which reduced AMPK phosphorylation and resulted in activation of mTOR. Collectively, the higher colon cancer risk of diabetic patients could be due to O‐GlcNAcylation‐mediated AMPK inactivation and subsequent activation of mTOR.
Keywords: AMP‐activated kinase, colon cancer, mTOR, O‐GlcNAcylation, tumor growth
Colon cancer is a major health problem because of high prevalence and high mortality rates in Western countries, such as North America, Australia, and Europe. In 2015, the American Cancer Society reported approximately 1.6 million people diagnosed with colon cancer and an annual mortality of 590 000 patients. Thus, colon cancer is the third most prevalent and most common cause of cancer‐related deaths in both men and women.1
Diabetes has been predicted to be a significant risk factor for various cancers, including colon cancer, in recent years.2 Many previous studies have suggested the association between type 2 diabetes and the prevalence of various cancers, including colon, liver, breast, pancreas, and endometrial cancers.3, 4, 5, 6, 7 Although insulin or insulin‐like growth factor‐1 has been associated with increased colon cancer risk in diabetic patients,8, 9 further studies are required to elucidate the mechanisms by which a diabetic condition increases the occurrence of colon cancer.
Protein O‐GlcNAcylation is a critical post‐translational modification in which an O‐GlcNAc residue is enzymatically transferred to serine/threonine residues of certain proteins.10, 11, 12 Like phosphorylation, protein O‐GlcNAcylation has been observed in various proteins, including transcriptional factors, cytoskeletal proteins, nuclear pore complex proteins, and tumor promoter proteins. Both protein modifications target the serine/threonine residues and have often been reported to participate in competitive interplay with each other.
Protein O‐GlcNAcylation is regulated by two enzymes, namely, OGT, which transfers GlcNAc from the donor substrate, UDP‐GlcNAc, to serine/threonine residues on certain proteins, and OGA, which in turn cleaves GlcNAc from the proteins.13 The production of UDP‐GlcNAc, as well as the activities of OGT and OGA, is one of the rate‐limiting steps for O‐GlcNAcylation. Uridine diphospho‐GlcNAc is synthesized from glucose through the hexosamine pathway, and GFAT is the rate‐limiting enzyme in the pathway. Thus, the rate of protein O‐GlcNAcylation is dependent on glucose concentrations and the activities of OGT, OGA, and GFAT.10 Uridine diphospho‐GlcNAc has been reported to be elevated under high blood sugar conditions by increased glucose influx, which in turn activates the hexosamine pathway, thereby resulting in increased O‐GlcNAcylation.14, 15 Elevated O‐GlcNAcylation has been observed in malignant carcinomas, such as pancreatic ductal carcinoma, and neurodegenerative diseases.16 Furthermore, increased protein O‐GlcNAcylation has been reported to play pivotal roles in the progression of colon cancer, as well as mammalian and lung cancers.17 Nevertheless, the mechanisms by which O‐GlcNAcylation accelerates cancer progression remain unclear.
AMP‐activated kinase plays pivotal roles in cellular energy homeostasis. It is regulated by an upstream kinase, LKB1, which is encoded by a tumor suppressor gene that was found to be mutated in Peutz–Jeghers syndrome in 1998.18, 19 Once activated, AMPK accelerates the catabolic pathway and simultaneously suppresses energy consumption, cellular growth, and the anabolic pathway by phosphorylating and inhibiting the key enzymes ACC and HMG‐CoA reductase.20 AMP‐activated kinase phosphorylates glycogen synthase, which inhibits glycogen synthesis,21 and also suppresses gluconeogenesis by phosphorylating CREB‐regulated transcription coactivator 2.22 The mTOR pathway, which accelerates cellular growth, is also regulated by AMPK. AMP‐activated kinase activation suppresses the mTOR pathway, which in turn inhibits the synthesis of new proteins.23 Intriguingly, in some cases, AMPK could also act as a tumor suppressor through induction of G1/S arrest in coordination with the p53 tumor suppressor.24 Thus, AMPK activation is expected to negatively regulate tumor growth25 and can therefore serve as a promising therapeutic strategy against tumors.
Recently, AMPK was reported to be modified through O‐GlcNAcylation under high‐glucose conditions.26 Here, we examined whether protein O‐GlcNAcylation promotes in vitro and in vivo growth of a human colon cancer cell line, LoVo cells, and determined the AMPK‐mediated mechanisms by which protein O‐GlcNAcylation promotes tumor growth.
Materials and Methods
Antibodies
Anti‐phospho‐AMPK (T172) (pAMPK), AMPK, phospho‐ACC (S79), ACC, phospho‐mTOR (S2448), mTOR, p70 phospho‐ribosomal kinase (S424) (pS6K), and p70 S6K (S6K) antibodies were purchased from Cell Signaling Technologies (Danvers, MA, USA). AMP‐activated kinase antibody was produced by immunizing animals with a synthetic peptide corresponding to the amino‐terminal sequence of human AMPKα. Anti‐O‐GlcNAc (RL‐2) and anti‐OGT antibodies were obtained from Novus Biologicals (Littleton, CO, USA) and Santa Cruz Biotechnology (Dallas, TX, USA), respectively. Anti‐β‐actin and α‐tubulin antibodies were obtained from Sigma‐Aldrich (St. Louis, MO, USA) and MBL (Nagoya, Japan).
Chemicals
Thiamet G was purchased from Enzo Life Science (Farmingdale, NY, USA). Both AICAR and BML‐275 were obtained from Wako Pure Chemical Industries (Osaka, Japan). Cell Counting Kit‐8 was purchased from Dojindo (Kumamoto, Japan).
Cell culture
LoVo cells were obtained from Riken Bioresource Center (Riken BRC, Tsukuba, Japan). Cells were maintained in DMEM/10% FBS containing 100 μg/mL streptomycin and 100 U/mL ampicillin.
Transfection
Transfection of pCAGGS/Ogt 27 for OGT overexpression or siRNA against AMPK (Santa Cruz Biotechnology) for AMPK silencing in LoVo cells was carried out using TransIT‐X2 system (Mirus Bio, Madison, WI, USA) according to the manufacturer's instructions.
Cell growth assays
WST‐8 assay
Anchorage‐dependent cell growth was measured spectrophotometrically using CCK‐8 (Wako Pure Chemical Industries) according to the manufacturer's instructions.28, 29 Briefly, LoVo cells were plated onto a 96‐well plate at 2 × 10⁵ cells/well and incubated overnight to allow cell attachment. The cells were then incubated with or without inhibitors for varying time periods (24 or 48 h) either in DMEM containing 10% FBS or in serum‐free DMEM. To measure cell proliferation, cells were incubated with a WST‐8 reagent for 1 h, and absorbance was measured at a wavelength of 450 nm using a microplate reader (Model 680; Bio‐Rad, Hercules, CA, USA).
Colony formation assay
Anchorage‐dependent cell growth on 6‐well plates was evaluated by colony formation assay as described previously.29 First, the bottom layer was prepared using 2.5 mL of 0.5% low‐melting agarose (Agarose SFR; Amresco, Solon, OH, USA) dissolved in growth medium as described earlier. LoVo cells were prepared at a density of 1 × 10⁶ cells/mL. Approximately 50 μL cell suspension and 1.4 mL of 0.3% low‐melting agarose in the growth medium were overlaid on the bottom of each well. To prevent moisture loss, an additional 0.5–1 mL growth media was overlaid, and PBS was added in between spaces. After 4 weeks, colonies were stained with 0.05% crystal violet, counted, and then imaged.
In vivo assay of LoVo cells
Transplantation of LoVo cells into BALB/c‐nu/nu mice
BALB/c‐ nu/nu mice (male, 5 weeks old) were purchased from Japan SLC (Shizuoka, Japan). The mice was maintained in pathogen‐free conditions, fed with standard chow (CLEA Japan, Tokyo, Japan) and kept in comfortable conditions at 20°C in appropriate humidity, and with 12:12‐h light : dark cycles, in the Division of Research Animal Laboratory, Osaka Medical College (Takatsuki, Japan) during the experiment. Painful procedures were carried out under appropriate anesthesia as described below. LoVo cells at a density of 5 × 10⁶ cells in 100 μL PBS were s.c. grafted onto the backs of BALB/c nu/nu mice (5 weeks old, n = 6 for PBS group; n = 6 for TMG group; total, n = 12) under anesthesia with tribromoethanol (300–400 mg/kg), i.p. Each mouse was grafted at two places (right and left side of the back). Thiamet G was given at 10 mg/kg prior to grafting, and subsequently every other day until the mice were killed. Tumor volumes were measured once a week and calculated using the formula: V = length × width2/2, length > width. After 6 weeks, mice were killed with excess pentobarbital sodium (150–200 mg/kg), i.p. Finally, 6 of 12 transplanted cells in each group formed tumors and were subjected to subsequent analyses. The developed tumors were excised, weighed, and then fixed with 4% paraformaldehyde in PBS for histological analyses. The Osaka Medical College Animal Experiment Ethical Committee approved the animal experiment (permission number: 28033) and all the procedures were carried out in accordance with The Regulations of Animal Experiments of Osaka Medical College (http://www.osaka-med.ac.jp/deps/eac/info.html#rule).
Western blot analysis
Preparation of cell lysates
Cells were lysed with a lysis buffer (1% Triton X‐100, 0.25% deoxycholic acid, and 0.1 M NaCl, pH 7.4) containing a protease inhibitor cocktail (Nacalai Tesque, Kyoto, Japan). Excised tumors were homogenized with a potter‐type homogenizer (Model LR‐41C; Yamato Scientific, Tokyo, Japan). Protein concentrations of the lysates were determined using a BCA protein assay kit (Pierce, Rockford, IL, USA). To detect AMPK O‐GlcNAcylation, lysates were subjected to co‐immunoprecipitation with anti‐AMPK antibody conjugated with magnetic beads (Bio‐Rad). Precipitates were subjected to Western blot analysis using the anti‐O‐GlcNAc antibody (RL‐2) as described below.
Sodium dodecylsulfate–PAGE and Western blot analysis
Proteins were subjected to SDS‐PAGE. Separated proteins were transferred onto a PVDF membrane (Millipore, Billerica, MA, USA) using a Trans‐blot SD semi‐dry electrophoretic transfer cell (Bio‐Rad). The membrane was blocked with 5% skim milk, incubated with the appropriate primary antibody, followed by the appropriate HRP‐conjugated secondary antibody, and then developed using a Luminata Forte Western HRP substrate (Millipore). Images were captured using a Chemidoc system (Bio‐Rad).
Statistical analysis
All experiments were carried out at least twice. Representative results were subjected to statistical analyses. All statistical analyses were undertaken using MEPHAS (http://www.gen-info.osaka-u.ac.jp/testdocs/tomocom/).
Results
Thiamet G, an OGA inhibitor, promoted growth of LoVo cells
The association between diabetes and cancer has received increasing research attention in recent studies. High blood sugar levels are known to increase O‐GlcNAcylation.30, 31 O‐GlcNAcylation has been reported to be elevated in various types of cancer, including colon cancer, and is often accompanied by increased OGT.32 To elucidate the effects of increased O‐GlcNAcylation on tumor growth of colon cancer in diabetic patients, we examined the growth of LoVo cells in the presence or absence of TMG, which increases O‐GlcNAcylation. The growth assay was carried out in serum‐free medium. As expected, the growth of LoVo cells was significantly higher both at 24 and 48 h after TMG treatment in a concentration‐dependent manner (Fig. 1a). Given that AMPK is recognized as a target for the treatment of metabolic syndrome and type 2 diabetes,33 and has been reported to be a metabolic tumor suppressor,34 we hypothesized that increased O‐GlcNAcylation with TMG treatment can affect AMPK activity by competing with phosphorylation with O‐GlcNAcylation at Thr172. Results showed that TMG treatment for 24 h led to the decreased phosphorylation and increased O‐GlcNAcylation of AMPK (Fig. 1b,c). We also examined the effect of O‐GlcNAcylation on anchorage‐independent growth. Results revealed that the numbers of colonies were higher in TMG‐treated cells compared to controls (Fig. 1d). Collectively, elevated O‐GlcNAcylation combined with TMG treatment enhanced the growth of LoVo cells in both anchorage‐dependent and ‐independent manners and simultaneously reduced AMPK phosphorylation, which is potentially mediated by increased O‐GlcNAcylation.
Figure 1.

Thiamet G (TMG) treatment accelerated the anchorage‐dependent and ‐independent growth and inactivated AMP‐activated kinase (AMPK) through its O‐GlcNAcylation in LoVo cells. (a) LoVo cells were cultured with the indicated concentrations of TMG for 48 h. Cell growth was measured using CCK‐8 assay after 24 and 48 h. *P < 0.05, Steel's test. (b, c) LoVo cells were cultured with the indicated concentrations of TMG for 24 h. Cells were collected, lysed, and subjected to Western blot analysis either directly or after co‐immunoprecipitation (IP) with anti‐AMPK antibody, and the bands were detected using anti‐phospho‐AMPK (pAMPK), ‐AMPK, and ‐RL2 antibodies. The experiment was carried out several times and representative data are shown. Band densities were analyzed statistically with Steel's test. *P < 0.05. Molecular weight markers are shown. (d) LoVo cells were seeded onto plates containing 0.7% low‐melting agar containing DMEM. Cells were cultured for 4 h to allow the formation of visible colonies (arrowheads). Colonies were stained with crystal violet and counted using Quantity One. Experiments were undertaken three times, and representative images are shown. Band densities were analyzed statistically with Student's t‐test. *0.01 < P < 0.05.
Ogt overexpression promoted growth of LoVo cells
O‐GlcNAcylation is regulated by OGT and OGA. Chemical inhibition of OGA with TMG treatment increased O‐GlcNAcylation. To further examine the influence of O‐GlcNAcylation on the growth of LoVo cells, we alternatively overexpressed Ogt in LoVo cells, which genetically increased O‐GlcNAcylation. As expected, O‐GlcNAcylation was increased with the overexpression of Ogt in the cells (Fig. 2a). The growth of Ogt‐overexpressing LoVo cells was also significantly higher both at 24 and 48 h compared to that of the mock‐transfected cells (Mock), which was consistent with the TMG treatment data (Fig. 2b). We next examined the phosphorylation of AMPK and the main downstream substrate, ACC,35 in Ogt‐overexpressing LoVo cells. As expected, the phosphorylation of both molecules was significantly compromised in the Ogt‐overexpressing cells (Fig. 2c,d). We also examined the phosphorylation of mTOR, which is strongly enhanced in various cancers,36 and its main downstream substrate, S6K. Intriguingly, the phosphorylation of mTOR as well as S6K was significantly increased in the Ogt‐overexpressing cells (Fig. 2e,f). Collectively, increased O‐GlcNAcylation by Ogt‐overexpression as well as TMG significantly accelerated the growth of LoVo cells, which was accompanied with a compromised AMPK pathway and reciprocally increased mTOR pathway.
Figure 2.
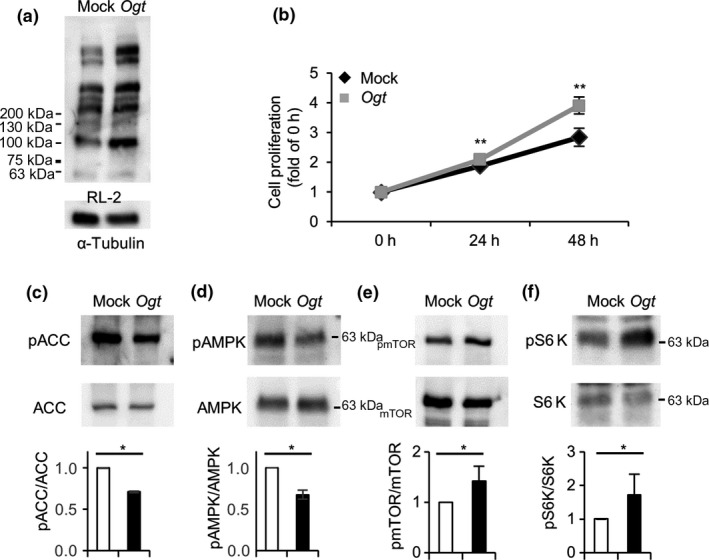
Ogt overexpression accelerated cell growth, and inactivated or activated the AMP‐activated kinase (AMPK) signaling pathway or mTOR pathway, respectively, in LoVo cells. Ogt cDNA or mock DNA was transfected into LoVo cells. Twenty‐four hours later, the cells was plated into 6‐well or 96‐well plates. (a) Cells in 6‐well plates were collected after 48 h, lysed, and subjected to Western blot analysis to examine O‐GlcNAcylation levels using RL‐2. (b) Cells in 96‐well plates were used to measure cell growth. The measurement was started the next day (0 h) using CCK‐8. Growth was measured at 0, 24, and 48 h. **0.01 < P < 0.05, Student's t‐test. (c–f) Lysates in (A) were also analyzed for the phosphorylation levels of acetyl CoA carboxylase (ACC) (c), AMPK (d), mTOR (e), and S6 kinase (S6K) (f) with Western blot analysis. The phosphorylation and expression levels of these proteins were analyzed using respective anti‐phospho‐ or total protein antibodies. The experiment was carried out several times and representative data are shown. Band densities were measured and ratios of phosphorylated to total proteins were analyzed statistically with Student's t‐test. *0.01 < P < 0.05. Molecular weight markers are indicated.
Treatment with BML‐275, a specific AMPK inhibitor, accelerated growth of LoVo cells
Treatment with TMG led to a dose‐dependent increase in AMPK O‐GlcNAcylation in parallel with AMPK dephosphorylation (Fig. 1b,c). To verify whether TMG‐induced growth promotion of LoVo cells was mediated by AMPK activity, we treated LoVo cells using an AMPK‐specific inhibitor, BML‐275, and measured cell growth. BML‐275 effectively inhibited AMPK phosphorylation in a dose‐dependent manner (Fig. 3a). Phosphorylation of mTOR was increased following BML‐275 treatment (Fig. 3a), consistent with previous results (Fig. 2e). The growth rates of LoVo cells increased in proportion to mTOR phosphorylation (Fig. 3b), which further supported the idea that inhibition of AMPK phosphorylation by O‐GlcNAcylation can enhance cell growth by activating the mTOR pathway.
Figure 3.
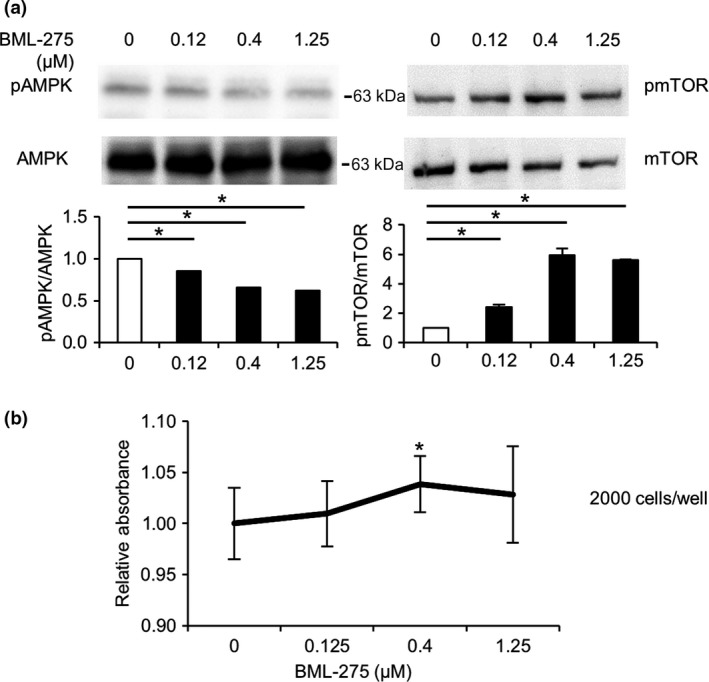
AMP‐activated kinase (AMPK) inhibition accelerated cell growth and inactivated the mTOR pathway in LoVo cells. (a) LoVo cells were cultured in serum‐free DMEM with the indicated concentrations of BML‐275 for 24 h. Cells were then lysed and subjected to Western blot analysis using anti‐phospho‐AMPK (pAMPK) and phospho‐mTOR (pmTOR) antibodies. The total expression levels of AMPK and mTOR were used as controls. Experiments were carried out several times and representative data are shown. Ratios of phosphorylated to total AMPK or mTOR were analyzed statistically with Dunnett's test. *P < 0.05. Molecular weight markers are shown. (b) LoVo cells were cultured with the indicated concentrations of BML‐275, an AMPK inhibitor, for 24 h. Growth was measured using CCK‐8. Absorbance rates of the cells with the indicated concentrations of BML‐275 relative to that of ones without BML‐275 were analyzed statistically with Steel's test, *P < 0.05.
Silencing of AMPK accelerated growth, but abolished TMG‐induced growth acceleration, in LoVo cells
To further verify that increased O‐GlcNAcylation by either TMG or Ogt overexpression accelerates the growth of LoVo cells through the AMPK signaling pathway, we silenced AMPK expression in LoVo cells using siRNA. The AMPK expression using an siRNA against AMPK (siAMPK) was silenced by approximately 50% compared to the control (Fig. 4a). We examined the growth of the siRNA‐treated cells at the basal state or with various concentrations of TMG treatment. The LoVo cells with siAMPK (siAMPK cells) grew significantly faster than ones with siCTR (siCTR cells) at the basal state (Fig. 4b). Growth acceleration in proportion to higher concentrations of TMG in siAMPK cells was significantly lower compared to that in siCTR cells, which directly indicated that TMG accelerated the growth of LoVo cells through the AMPK signaling pathway. O‐GlcNAcylation level at any concentration of TMG treatment was not significantly different between the cells (Fig. 4d). In contrast, phosphorylation of mTOR and S6K was significantly higher in siAMPK cells at the basal state (Fig. 4e,f). In siCTR cells, only high‐dose (1 μM) TMG treatment significantly upregulated both mTOR and S6K phosphorylation (Fig. 4e,f), which is consistent with the data that AMPK phosphorylation was downregulated by approximately 50% with 1 μM TMG treatment (Fig. 1b). These results strongly suggest that O‐GlcNAcylation regulated the growth of LoVo cells by control of the AMPK signaling pathway. The AMPK signaling pathway could be one of the potent effectors in O‐GlcNAcylation‐induced tumor growth.
Figure 4.
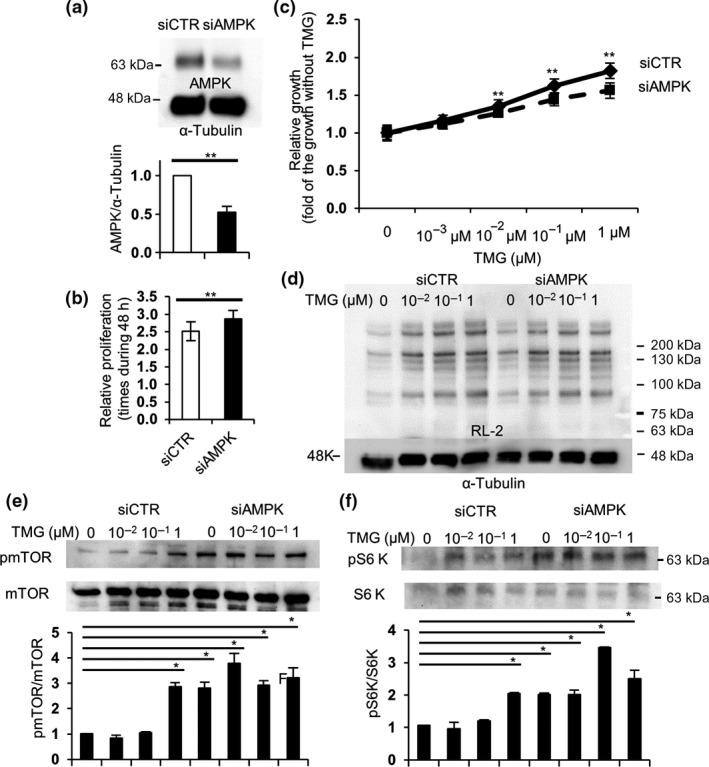
AMP‐activated kinase (AMPK) silencing accelerated cell growth through activation of the mTOR pathway, but impaired Thiamet G (TMG)‐mediated acceleration of the growth in LoVo cells. siRNA against AMPK (siAMPK) was transfected into LoVo cells. Twenty‐four hours later, the cells were plated into 6‐well or 96‐well plates at 104 cells/mL. (a) Cells in 6‐well plates were collected after 48 h, lysed, and subjected to Western blot analysis to evaluate the efficiency of siAMPK using anti‐AMPK antibody. (b, c) Cells in 96‐well plates were treated with the indicated concentrations of TMG (0–1 μM) the next day and incubated for 48 h. Growth was measured using CCK‐8. Basal growth without TMG was measured (b), and the growth acceleration with the indicated concentrations of TMG was analyzed statistically (c). **0.05 < P <0.01, Student's t‐test. (d–f) Cells treated with the indicated concentrations of TMG for 48 h were collected, lysed, and subjected to Western blot analysis with RL‐2 (d), anti‐phospho‐mTOR (pmTOR) and total mTOR (e), and S6 kinase (S6K) antibodies (f). Western blot analyses in (e, f) were carried out several times and representative data are shown. Ratios of pmTOR or pS6K against total mTOR or S6K were calculated and analyzed statistically with Dunnett's test, *P < 0.05. Molecular weight markers are shown.
Treatment with AICAR abolished TMG‐induced growth acceleration in LoVo cells
To further validate whether AMPK directly mediated TMG‐induced growth acceleration, LoVo cells were treated with AICAR, a specific AMPK activator. As shown in Figure 5(a), AICAR significantly increased AMPK phosphorylation and simultaneously reduced mTOR phosphorylation in a dose‐dependent manner. Next, we examined the effects of AICAR on the growth of LoVo cells. LoVo cells were cultured in DMEM containing 10% FBS, treated with AICAR at the indicated concentrations, and incubated for 24 h, after which cell growth was measured. Thiamet G treatment was found to inhibit the growth of LoVo cells in a dose‐dependent manner (Fig. 5b). Although 1 mM AICAR significantly suppressed cancer cell growth, lower AICAR concentrations did not produce significant effects (Fig. 1a). We next examined whether treatment with varying concentrations of AICAR influenced the growth‐promoting effects of TMG. Based on growth assay using 10% FBS containing medium, 1 μM TMG still significantly enhanced the growth of LoVo cells (Fig. 5c). Moreover, co‐administration of AICAR with TMG completely abolished the TMG‐induced cell growth (Fig. 5c), implying that TMG‐induced growth of LoVo cells was mediated, at least partly, by the AMPK pathway.
Figure 5.
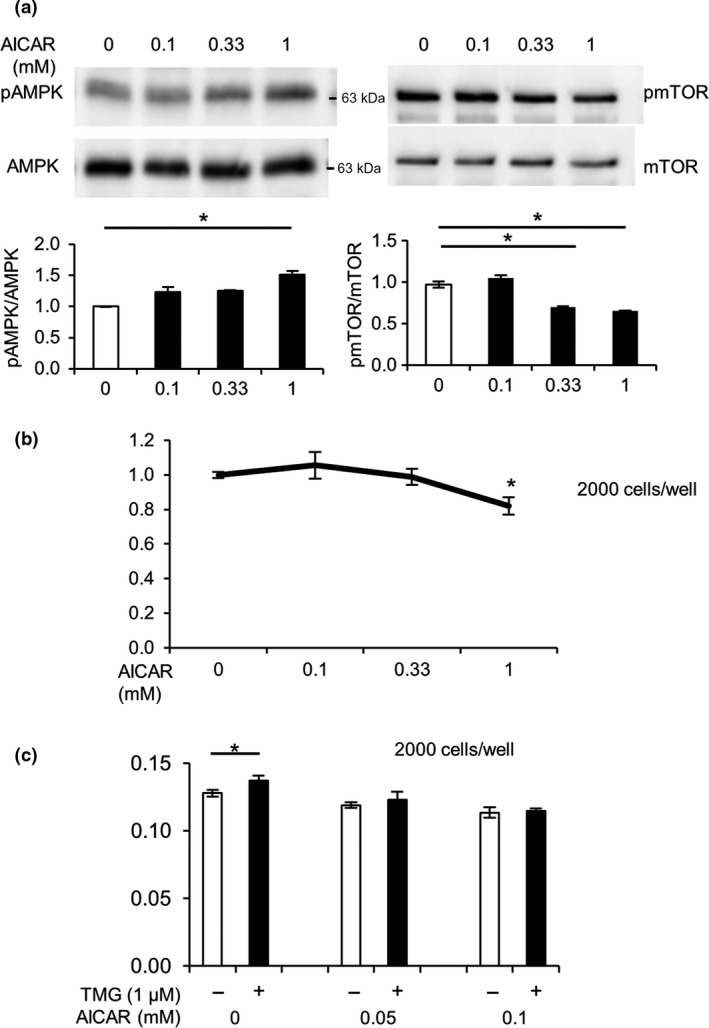
5‐Aminoimidazole‐4‐carboxamide ribonucleotide (AICAR) inhibited cell growth through inactivation of the mTOR pathway in LoVo cells. (a) Cells were cultured for 24 h with the indicated concentrations of AICAR and subjected to Western blot analysis using anti‐AMP‐activated kinase (AMPK), anti‐phospho‐AMPK (pAMPK), anti‐mTOR, and phospho‐mTOR (pmTOR) antibodies. Experiments were undertaken several times and representative data are shown. Ratios of phosphorylated to total AMPK or mTOR were densitometrically analyzed. *P < 0.05, Dunnett's test. (b) Growth rates of LoVo cells cultured for 24 h with the indicated concentrations of AICAR were estimated. *P < 0.05, Steel's test. (c) LoVo cells were cultured with the indicated concentrations of AICAR in the presence or absence of 1 μM Thiamet G (TMG). Cell growth was measured using CCK‐8. *P < 0.05, Student's t‐test.
LoVo cell‐derived tumors transplanted into TMG‐treated BALB/c‐nu/nu (nude) mice were larger than those transplanted into control mice
So far, we have shown that increased protein O‐GlcNAcylation accelerated the in vitro growth of LoVo cells, which could be due to inhibition of the AMPK activity and reciprocal activation of the mTOR pathway. We then used a TMG‐treated mouse model to determine whether the same results are observed in vivo. Daily i.p. injection of TMG at 10 mg/kg was reported to increase protein O‐GlcNAcylation in mice.37 LoVo cells were transplanted onto the backs of nude mice at 5 × 10⁶ cells per spot. Thiamet G was given following transplantation and then treated continuously every other day. Tumor sizes were measured weekly, and mice were killed at 6 weeks after transplantation. Tumors excised from TMG‐treated mice were observed to be larger than those excised from control mice (Fig. 6a). As shown in Figure 6(b), the sizes of tumors from mice with TMG were varied, but the average tumor volume was significantly larger in TMG‐treated mice than in control mice (Fig. 6c).
Figure 6.
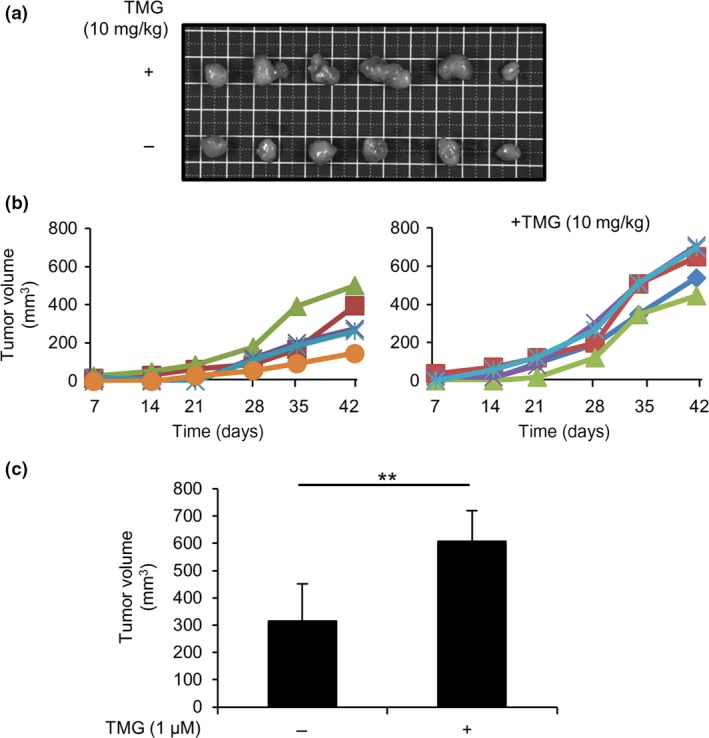
Transplanted LoVo cell‐derived tumor formation was accelerated in Thiamet G (TMG)‐treated BALB/c‐nu/nu mice. LoVo cells were s.c. transplanted onto the backs of Balb/c‐nu/nu mice (n = 6), with or without daily peritoneal TMG treatment, under anesthesia with tribromoethanol (300–400 mg/kg), i.p. (a) Tumors derived from LoVo cells were s.c. transplanted into BALB/c‐nu/nu mice. Tumors (n = 6, each group) were then surgically removed from mice treated with or without TMG. Images of the removed tumors are shown (top row, TMG treatment; bottom row, control). (b) The size of each tumor was measured weekly starting 1 week after transplantation. Tumor size was calculated using the formula (width × depth2/2; width > depth). (c) Average tumor volume (n = 5) was calculated. Tumors with sizes that deviated from the mean ± SD were excluded in each group. **P < 0.01, Student's t‐test.
Augmented O‐GlcNAcylation of AMPK in LoVo cell‐derived tumor tissues excised from TMG‐treated mice reduced AMPK phosphorylation and activated the mTOR pathway
We examined O‐GlcNAcylation and phosphorylation of proteins excised from LoVo cell‐derived tumor tissues. Tumors from nude mice were surgically removed and homogenized using a potter‐type homogenizer as described in “Materials and Methods”. O‐GlcNAcylation was higher in tumors derived from TMG‐treated mice than in tumors derived from control mice (Fig. 7a). Accordingly, AMPK phosphorylation was significantly lower in tumors derived from TMG‐treated mice than in tumors from control mice (Fig. 7b). Consistent with lower phosphorylation, O‐GlcNAcylation of AMPK was significantly higher in tumors of TMG‐treated mice (Fig. 7c). We examined the phosphorylation levels of AMPK, mTOR, and S6K, a downstream mTOR target, in tumors derived from control and TMG‐treated mice (Fig. 7d). Consistent with in vitro data derived from LoVo cells (Figs. 3a,4e,f), TMG treatment showed augmented O‐GlcNAcylation, which in turn led to AMPK inactivation and subsequent activation of the mTOR/S6K pathway (Fig. 7d). These results could be attributed to larger tumor volumes in TMG‐treated mice than in untreated mice.
Figure 7.
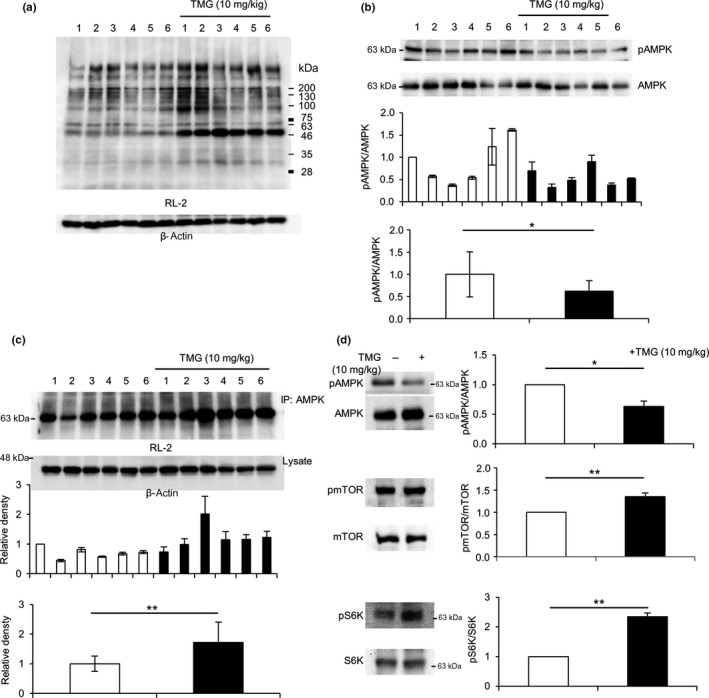
Augmented AMP‐activated kinase (AMPK) O‐GlcNAcylation induced AMPK inactivation and subsequent mTOR pathway activation in tumor tissues of BALB/c‐nu/nu mice. Tumors excised from BALB/c‐nu/nu mice with or without Thiamet G (TMG) treatment (n = 6, each group) were estimated by Western blot analysis. (a) O‐GlcNAcylation in tumor tissues was evaluated by Western blot analysis using an anti‐O‐GlcNAc antibody, RL‐2. (b) AMPK phosphorylation (pAMPK) in tumor tissues was analyzed by Western blot analysis (top panels), and the measured density of each band was statistically analyzed (middle panel). The average ratios of pAMPK to total AMPK in each group were compared among the different treatment groups (lower panel). (c) O‐GlcNAcylation of AMPK was analyzed by co‐immunoprecipitation (IP) with an anti‐AMPK antibody, followed by Western blot analysis using RL‐2 (upper panels). Densities were standardized against those of β‐actin (middle panel). The average density in each group was also determined (lower panel). (d) Proteins from tumors in each group were mixed and subjected to Western blot analysis to measure phosphorylation of AMPK (upper), mTOR (middle), and S6 kinase (S6K) (lower). The experiment was carried out several times and representative data are shown. Band densities were measured and ratios of phosphorylated to total proteins were analyzed statistically with Student's t‐test, *0.01 < P < 0.05, **P < 0.01. Molecular weight markers were shown.
Discussion
Here, we showed that protein O‐GlcNAcylation significantly enhanced the growth of colon cancer cells through AMPK inhibition and reciprocal activation of the mTOR/S6K pathway. The LKB1/AMPK pathway has increasingly gained attention as a connecting mechanism between diabetes and occurrence of cancers, including colon cancer.25 Although metformin, a biguanides class anti‐type II diabetic drug, is also known as an AMPK activator, it has been reported to inhibit breast cancer growth by activating the AMPK pathway.38 These findings imply that AMPK plays a pivotal role in regulating colon cancer physiology and can thus potentially act as a promising therapeutic target for the treatment of colon cancer.39 In this study, we showed that O‐GlcNAcylation of AMPK, which has been reported to be increased under diabetic conditions,26 was observed in a colon cancer cell line, LoVo, and was found to be correlated with cancer cell growth (Figs 1,2). Treatment with BML‐275, a specific AMPK inhibitor (Fig. 3a,b) as well as AMPK silencing (Fig. 4b), enhanced the growth of LoVo cells in a dose‐dependent manner. The mTOR activity in control LoVo cells was accelerated with TMG treatment, whereas the activity in AMPK‐silencing cells was not changed, indicating that the activation of the mTOR signaling pathway by TMG treatment is through AMPK, probably through the O‐GlcNAcylation of AMPK (Fig. 4e,f). In contrast, treatment with AICAR, a specific AMPK activator, disrupted O‐GlcNAcylation‐dependent growth of LoVo cells (Fig. 5c). Although O‐GlcNAcylation occurs on thousands of intracellular proteins and affects many signaling pathways that are critical for cell proliferation, our data strongly suggest that AMPK could be one of the major effectors for O‐GlcNAcylation‐mediated tumor growth. Importantly, suppression of AMPK by augmentation of O‐GlcNAcylation or specific inhibition of AMPK led to the activation of the mTOR/S6K pathway. Consistent with the above findings, inverse results were obtained through the specific activation of AMPK. Conceivably, activation of the mTOR pathway by augmented AMPK O‐GlcNAcylation is associated with increased cancer risk in diabetic patients.
O‐linked N‐acetylglucosamine signaling is strongly associated with cellular metabolism, given that the donor sugar for O‐GlcNAcylation, UDP‐GlcNAc, is synthesized from glucose, glutamine, and uridine triphosphate through the hexosamine biosynthetic pathway.30 Glucose influx is increased in diabetes and cancer and results in enhanced protein O‐GlcNAcylation.30 To examine whether increased O‐GlcNAcylation affects colon cancer development in vivo, we explanted LoVo cells onto TMG‐treated nude mice. As shown in Figure 6, TMG‐treated nude mice developed larger tumors compared to control nude mice. Consistent with in vitro results (Figs 2,4), AMPK O‐GlcNAcylation was also increased, along with reciprocal activation of the mTOR pathway (Fig. 7). Taken together, augmented O‐GlcNAcylation, which was observed in diabetic patients, would be directly associated with colon cancer development through inactivation of the antitumorigenic AMPK pathway.
AMP‐activated kinase is a therapeutic target for metabolic syndrome and type 2 diabetes, and metformin activates AMPK.40 AMP‐activated kinase is also activated by non‐steroidal anti‐inflammatory drugs and other anti‐inflammatory agents, indicating that AMPK activation can potentially alleviate inflammation and pancreatic cancer.41 Once activated, AMPK counteracts the effects of mTOR, a molecular target in various cancers.42 In addition, p53, a tumor suppressor,24 and some transcription factors43, 44, 45 have been shown to be regulated by AMPK. Furthermore, O‐GlcNAcylation, AMPK inhibitor, or siAMPK‐mediated suppression of AMPK accelerated tumor growth (Figs 1, 2, 3, 4), whereas AMPK activation suppressed tumor growth (Fig. 5), strongly suggesting that AMPK acts as a tumor suppressor.
The EGFR signaling pathway is upregulated in many primary and metastatic colon cancers.46 Anti‐EGFR mAbs, such as cetuximab and panitumumab, play important roles in chemotherapy against colon cancer and act by inhibiting the activation of the EGFR and its downstream pathways, namely, the RAS‐RAF‐MAPK the PI3K‐PTEN‐AKT pathways.47 The response rate to anti‐EGFR mAbs ranges from 10% to 20% in colon cancer patients,48 and several types of non‐responders have been widely accepted, such as patients who harbor mutations in the KRAS, BRAF, PIK3CA, and PTEN genes.49
Recently, activation of the autophagy pathway through AMPK activation has been reported to be associated with chemoresistance to BRAF V600E.50 Several studies have reported that autophagy induction in response to therapeutics could serve as a pro‐survival role that contributes to chemoresistance.51 Although AMPK can activate autophagy under certain conditions, AMPK activation with AICAR treatment reduced the growth of LoVo cells (Fig. 5c) despite autophagy activation in vitro (Fig. S1A). Surprisingly, autophagy was not detected in tumors excised from LoVo cell‐transplanted TMG‐treated nude mice, in which AMPK was activated (Fig. S1B). Therefore, it is likely that the accelerated growth of LoVo cells observed both in vitro and in vivo was not due to autophagy activation.
Taken together, our findings suggested that augmented O‐GlcNAcylation promotes the proliferation of LoVo cells through AMPK activation. We propose AMPK as a promising therapeutic target for the treatment of colon cancer, especially for patients who show resistance to chemotherapeutic drugs, such as those that target the EGFR pathway.
Disclosure Statement
The authors have no conflict of interest.
Abbreviations
- ACC
acetyl CoA carboxylase
- AICAR
5‐aminoimidazole‐4‐carboxamide ribonucleotide
- AMPK
AMP‐activated kinase
- EGFR
epidermal growth factor receptor
- GFAT
glucose‐6‐phosphate/fructose aminotransferase
- GlcNAc
N‐acetylglucosamine
- LKB1
liver kinase B1
- OGA
O‐GlcNAcase
- O‐GlcNAc
O‐linked N‐acetylglucosamine
- OGT
O‐GlcNAc transferase
- S6K
S6 kinase
- TMG
Thiamet G
- UDP‐GlcNAc
uridine diphospho‐N‐acetylglucosamine
Supporting information
Fig. S1. Autophagy was activated in 5‐aminoimidazole‐4‐carboxamide ribonucleotide (AICAR)‐treated LoVo cells, but not in cells transplanted in Thiamet G (TMG)‐treated BALB/c‐nu/nu mice.
Acknowledgments
The authors thank Ms. Segawa for technical assistance and the Division of Research Equipment and Device of Osaka Medical College for technical support. This work was partly supported by a KAKEN grant (#25460397 to MA) from the Japan Society for the Promotion of Science.
Cancer Sci 108 (2017) 2373–2382
Funding Information
The Japan Society for the Promotion of Science KAKENHI (M.A) (Grant/Award Number: no. 17590249)
References
- 1. Siegel RL, Miller KD, Jemal A. Cancer statistics, 2015. CA Cancer J Clin 2015; 65: 5–29. [DOI] [PubMed] [Google Scholar]
- 2. Coughlin SS, Calle EE, Teras LR, Petrelli J, Thun MJ. Diabetes mellitus as a predictor of cancer mortality in a large cohort of US adults. Am J Epidemiol 2004; 159: 1160–7. [DOI] [PubMed] [Google Scholar]
- 3. Peeters PJHL, Bazelier MT, Leufkens HGM, de Vries F, De Bruin ML. The risk of colorectal cancer in patients with type 2 diabetes: associations with treatment stage and obesity. Diabetes Care 2015; 38: 495–502. [DOI] [PubMed] [Google Scholar]
- 4. Adami H‐O, Chow W‐H, Nyrén O et al Excess risk of primary liver cancer in patients with diabetes mellitus. J Natl Cancer Inst 1996; 88: 1472–7. [DOI] [PubMed] [Google Scholar]
- 5. Hense H‐W, Kajüter H, Wellmann J, Batzler WU. Cancer incidence in type 2 diabetes patients – first results from a feasibility study of the D2C cohort. Diabetol Metab Syndr 2011; 3: 15. [DOI] [PMC free article] [PubMed] [Google Scholar]
- 6. Michels KB, Solomon CG, Hu FB et al Type 2 diabetes and subsequent incidence of breast cancer in the nurses’ health study. Diabetes Care 2003; 26: 1752–8. [DOI] [PubMed] [Google Scholar]
- 7. Friberg E, Orsini N, Mantzoros CS, Wolk A. Diabetes mellitus and risk of endometrial cancer: a meta‐analysis. Diabetologia 2007; 50: 1365–74. [DOI] [PubMed] [Google Scholar]
- 8. Cats A, Dullaart RPF, Kleibeuker JH et al Increased epithelial cell proliferation in the colon of patients with acromegaly. Can Res 1996; 56: 523–6. [PubMed] [Google Scholar]
- 9. Yin S, Bai H, Jing D. Insulin therapy and colorectal cancer risk among type 2 diabetes mellitus patients: a systemic review and meta‐analysis. Diagn Pathol 2014; 9: 91. [DOI] [PMC free article] [PubMed] [Google Scholar]
- 10. Comer FI, Hart GW. O‐GlcNAc and the control of gene expression. Biochim Biophys Acta 1999; 1473: 161–71. [DOI] [PubMed] [Google Scholar]
- 11. Zachara NE, Hart GW. O‐GlcNAc a sensor of cellular state: the role of nucleocytoplasmic glycosylation in modulating cellular function in response to nutrition and stress. Biochim Biophys Acta 2004; 1673: 13–28. [DOI] [PubMed] [Google Scholar]
- 12. Torres CR, Hart GW. Topography and polypeptide distribution of terminal N‐acetylglucosamine residues on the surfaces of intact lymphocytes. Evidence for O‐linked GlcNAc. J Biol Chem 1984; 259: 3308–17. [PubMed] [Google Scholar]
- 13. Iyer SP, Hart GW. Dynamic nuclear and cytoplasmic glycosylation: enzymes of O‐GlcNAc cycling. Biochemistry 2003; 42: 2493–9. [DOI] [PubMed] [Google Scholar]
- 14. Ma J, Hart GW. Protein O‐GlcNAcylation in diabetes and diabetic complications. Expert Rev Proteomics 2013; 10: 365–80. [DOI] [PMC free article] [PubMed] [Google Scholar]
- 15. Fülöp N, Wang P, Marchase RB, Chatham JC. Impact of type‐2 diabetes on the hexosamine biosynthesis pathway and protein O‐glycosylation. FASEB J 2006; 20: A297. [Google Scholar]
- 16. Hanover JA. Glycan‐dependent signaling: O‐linked N‐acetylglucosamine. FASEB J 2001; 15: 1865–76. [DOI] [PubMed] [Google Scholar]
- 17. Mi W, Gu Y, Han C et al O‐GlcNAcylation is a novel regulator of lung and colon cancer malignancy. Biochim Biophys Acta 2011; 1812: 514–9. [DOI] [PubMed] [Google Scholar]
- 18. Hemminki A, Markie D, Tomlinson I et al A serine/threonine kinase gene defective in Peutz‐Jeghers syndrome. Nature 1998; 391: 184–7. [DOI] [PubMed] [Google Scholar]
- 19. Shaw RJ, Lamia KA, Vasquez D et al The kinase LKB1 mediates glucose homeostasis in liver and therapeutic effects of metformin. Science 2005; 310: 1642–6. [DOI] [PMC free article] [PubMed] [Google Scholar]
- 20. Henin N, Vincent MF, Gruber HE, Van den Berghe G. Inhibition of fatty acid and cholesterol synthesis by stimulation of AMP‐activated protein kinase. FASEB J 1995; 9: 541–6. [DOI] [PubMed] [Google Scholar]
- 21. Jorgensen SB, Nielsen JN, Birk JB et al The alpha2‐5'AMP‐activated protein kinase is a site 2 glycogen synthase kinase in skeletal muscle and is responsive to glucose loading. Diabetes 2004; 53: 3074–81. [DOI] [PubMed] [Google Scholar]
- 22. Koo SH, Flechner L, Qi L et al The CREB coactivator TORC2 is a key regulator of fasting glucose metabolism. Nature 2005; 437: 1109–11. [DOI] [PubMed] [Google Scholar]
- 23. Inoki K, Zhu T, Guan KL. TSC2 mediates cellular energy response to control cell growth and survival. Cell 2003; 115: 577–90. [DOI] [PubMed] [Google Scholar]
- 24. Jones RG, Plas DR, Kubek S et al AMP‐activated protein kinase induces a p53‐dependent metabolic checkpoint. Mol Cell 2005; 18: 283–93. [DOI] [PubMed] [Google Scholar]
- 25. Shackelford DB, Shaw RJ. The LKB1‐AMPK pathway: metabolism and growth control in tumour suppression. Nat Rev Cancer 2009; 9: 563–75. [DOI] [PMC free article] [PubMed] [Google Scholar]
- 26. Bullen JW, Balsbaugh JL, Chanda D et al Cross‐talk between two essential nutrient‐sensitive enzymes: O‐GlcNAc transferase (OGT) and AMP‐activated protein kinase (AMPK). J Biol Chem 2014; 289: 10592–606. [DOI] [PMC free article] [PubMed] [Google Scholar]
- 27. Moriwaki K, Asahi M. Augmented TME O‐GlcNAcylation promotes tumor proliferation through the inhibition of p38 MAPK. Mol Cancer Res 2017; 15: 1287–98. [DOI] [PubMed] [Google Scholar]
- 28. Fujisue Y, Nakagawa T, Takahara K et al Induction of erythropoietin increases the cell proliferation rate in a hypoxia‐inducible factor‐1‐dependent and ‐independent manner in renal cell carcinoma cell lines. Oncol Lett 2013; 5: 1765–70. [DOI] [PMC free article] [PubMed] [Google Scholar]
- 29. Takai M, Nakagawa T, Tanabe A, Terai Y, Ohmichi M, Asahi M. Crosstalk between PI3K and Ras pathways via protein phosphatase 2A in human ovarian clear cell carcinoma. Cancer Biol Ther 2015; 16: 325–35. [DOI] [PMC free article] [PubMed] [Google Scholar]
- 30. Slawson C, Copeland RJ, Hart GW. O‐GlcNAc signaling: a metabolic link between diabetes and cancer? Trends Biochem Sci 2010; 35: 547–55. [DOI] [PMC free article] [PubMed] [Google Scholar]
- 31. Akimoto Y, Kreppel LK, Hirano H, Hart GW. Hyperglycemia and the O‐GlcNAc transferase in rat aortic smooth muscle cells: elevated expression and altered patterns of O‐GlcNAcylation. Arch Biochem Biophys 2001; 389: 166–75. [DOI] [PubMed] [Google Scholar]
- 32. Queiroz RM, Carvalho E, Dias WB. O‐GlcNAcylation: the sweet side of the cancer. Front Oncol 2014; 4: 132. [DOI] [PMC free article] [PubMed] [Google Scholar]
- 33. Ruderman N, Prentki M. AMP kinase and malonyl‐CoA: targets for therapy of the metabolic syndrome. Nat Rev Drug Discov 2004; 3: 340–51. [DOI] [PubMed] [Google Scholar]
- 34. Luo Z, Zang M, Guo W. AMPK as a metabolic tumor suppressor: control of metabolism and cell growth. Future Oncol 2010; 6: 457–70. [DOI] [PMC free article] [PubMed] [Google Scholar]
- 35. Park SH, Gammon SR, Knippers JD, Paulsen SR, Rubink DS, Winder WW. Phosphorylation‐activity relationships of AMPK and acetyl‐CoA carboxylase in muscle. J Appl Physiol 2002; 92: 2475–82. [DOI] [PubMed] [Google Scholar]
- 36. Menon S, Manning BD. Common corruption of the mTOR signaling network in human tumors. Oncogene 2009; 27: S43–51. [DOI] [PMC free article] [PubMed] [Google Scholar]
- 37. Andrés‐Bergós J, Tardio L, Larranaga‐Vera A, Gómez R, Herrero‐Beaumont G, Largo R. The increase in O‐linked N‐acetylglucosamine protein modification stimulates chondrogenic differentiation both in vitro and in vivo. J Biol Chem 2012; 287: 33615–28. [DOI] [PMC free article] [PubMed] [Google Scholar]
- 38. Zakikhani M, Dowling R, Fantus IG, Sonenberg N, Pollak M. Metformin is an AMP kinase–dependent growth inhibitor for breast cancer cells. Can Res 2006; 66: 10269–73. [DOI] [PubMed] [Google Scholar]
- 39. Vladimir NA. Metformin for prevention and treatment of colon cancer: a reappraisal of experimental and clinical data. Curr Drug Targets 2016; 17: 439–46. [DOI] [PubMed] [Google Scholar]
- 40. Zhou G, Myers R, Li Y et al Role of AMP‐activated protein kinase in mechanism of metformin action. J Clin Invest 2001; 108: 1167–74. [DOI] [PMC free article] [PubMed] [Google Scholar]
- 41. Yue W, Yang CS, DiPaola RS, Tan X‐L. Repurposing of metformin and aspirin by targeting AMPK‐mTOR and inflammation for pancreatic cancer prevention and treatment. Cancer Prev Res 2014; 7: 388–97. [DOI] [PubMed] [Google Scholar]
- 42. Wullschleger S, Loewith R, Hall MN. TOR signaling in growth and metabolism. Cell 2006; 124: 471–84. [DOI] [PubMed] [Google Scholar]
- 43. Leclerc I, Lenzner C, Gourdon L, Vaulont S, Kahn A, Viollet B. Hepatocyte nuclear factor‐4α involved in type 1 maturity‐onset diabetes of the young is a novel target of AMP‐activated protein kinase. Diabetes 2001; 50: 1515–21. [DOI] [PubMed] [Google Scholar]
- 44. Kawaguchi T, Osatomi K, Yamashita H, Kabashima T, Uyeda K. Mechanism for fatty acid “sparing” effect on glucose‐induced transcription: regulation of carbohydrate‐responsive element‐binding protein by AMP‐activated protein kinase. J Biol Chem 2002; 277: 3829–35. [DOI] [PubMed] [Google Scholar]
- 45. Liang J, Shao SH, Xu Z‐X et al The energy sensing LKB1‐AMPK pathway regulates p27kip1 phosphorylation mediating the decision to enter autophagy or apoptosis. Nat Cell Biol 2007; 9: 218–24. [DOI] [PubMed] [Google Scholar]
- 46. Markman B, Javier Ramos F, Capdevila J, Tabernero J. EGFR and KRAS in colorectal cancer. Adv Clin Chem 2010; 51: 72. [DOI] [PubMed] [Google Scholar]
- 47. Ciardiello F, Tortora G. EGFR antagonists in cancer treatment. N Engl J Med 2008; 358: 1160–74. [DOI] [PubMed] [Google Scholar]
- 48. Cunningham D, Humblet Y, Siena S et al Cetuximab monotherapy and cetuximab plus irinotecan in irinotecan‐refractory metastatic colorectal cancer. N Engl J Med 2004; 351: 337–45. [DOI] [PubMed] [Google Scholar]
- 49. Molinari F, Felicioni L, Buscarino M et al Increased detection sensitivity for KRAS mutations enhances the prediction of anti‐EGFR monoclonal antibody resistance in metastatic colorectal cancer. Clin Cancer Res 2011; 17: 4901–14. [DOI] [PubMed] [Google Scholar]
- 50. Sueda T, Sakai D, Kawamoto K et al BRAFV600E inhibition stimulates AMP‐activated protein kinase‐mediated autophagy in colorectal cancer cells. Sci Rep 2016; 6: 18949. [DOI] [PMC free article] [PubMed] [Google Scholar]
- 51. Sui X, Chen R, Wang Z et al Autophagy and chemotherapy resistance: a promising therapeutic target for cancer treatment. Cell Death Dis 2013; 4: e838. [DOI] [PMC free article] [PubMed] [Google Scholar]
Associated Data
This section collects any data citations, data availability statements, or supplementary materials included in this article.
Supplementary Materials
Fig. S1. Autophagy was activated in 5‐aminoimidazole‐4‐carboxamide ribonucleotide (AICAR)‐treated LoVo cells, but not in cells transplanted in Thiamet G (TMG)‐treated BALB/c‐nu/nu mice.