Mafessoni and Prüfer (1) (MP) make three points: (i) Low variation among Neanderthal genomes implies a small population, (ii) Neanderthal–Denisovan divergence is small relative to archaic-modern, and (iii) an analysis including singleton site patterns (in which the derived allele appears only once) supports a small Neanderthal population and a more recent Neanderthal–Denisovan separation.
Point i assumes that sequenced Neanderthals are representative of all Neanderthals, yet samples come primarily from the north, where DNA preserves well. The global population may have been larger if some unsampled populations were distantly related to those sampled. Point ii is subsidiary to point iii, because divergences can be calculated from site pattern frequencies. We therefore focus on point iii.
Our previous estimates (2) were biased, because our modern human data excluded invariant nucleotide sites (3). Mutations in an archaic lineage appear only if that lineage introgressed into moderns, leading to an undercount of pattern nd.
We now analyze the four genomes studied by MP. Because these have high coverage and are not restricted to variable sites they do not introduce bias. We fit two models, one excluding singleton site patterns [as in our previous publication (2)] and one including them (as MP advocate).
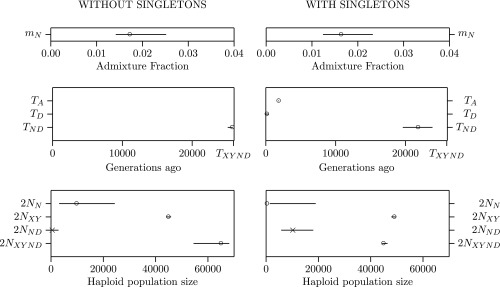
The left side of Fig. 1 presents results for the model without singletons. Our estimate of , the Neanderthal–Denisovan separation time, is only slightly smaller than , the archaic-modern separation. This supports an early separation of the two archaics. Parameter measures the haploid size of the population ancestral to Neanderthals and Denisovans. This estimate is small, implying an early bottleneck among archaics. The estimate of , the Neanderthal population size, is smaller than in our previous publication (2) but still larger than current estimates. These results are broadly consistent with those of our previous publication (2).
Fig. 1.
Legofit estimates and bootstrap confidence intervals. Open circles indicate unconstrained parameters and crosses constrained ones. and are the ages of the Altai Neanderthal and Denisovan fossils, respectively. Other parameters are as defined by Rogers et al. (2).
In their with-singleton analysis MP use genetic data to estimate the ages of the two fossils. We do the same in our own with-singleton analysis, by defining these ages as free parameters. The results (Fig. 1, Right) are more similar to those of MP. Compared with the without-singleton analysis, the Neanderthal population is smaller, the ancestral archaic bottleneck is less severe, and the two archaics separate more recently. Nonetheless, our separation time (632 kya) is still much older than that of MP (459 kya).
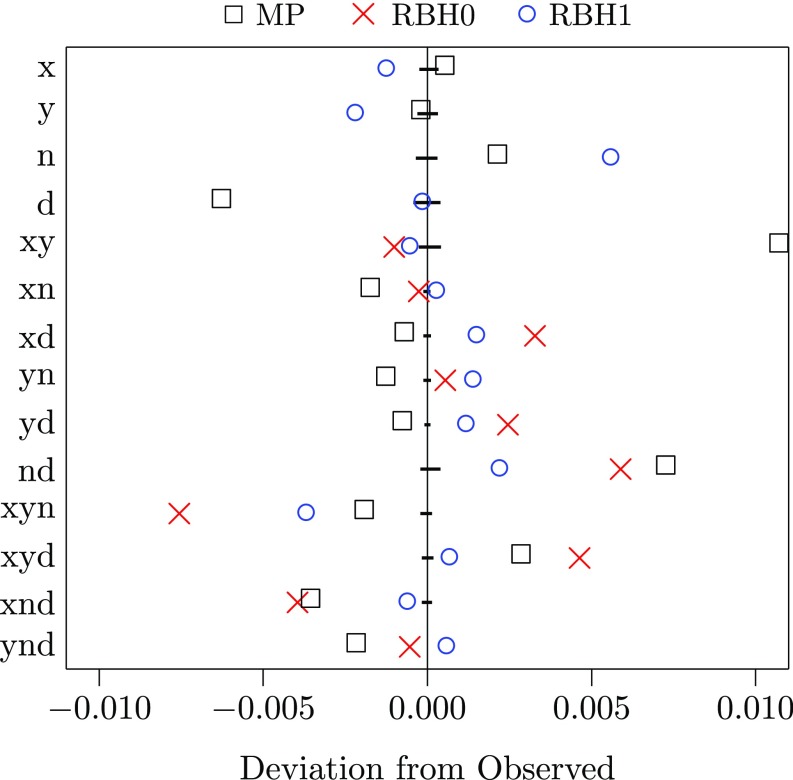
We are skeptical of the with-singleton analysis, because it implies that the Denisovan fossil lived only 4 kya. This is probably because site pattern d (derived allele only in Denisovan) is 10% more common than pattern n (only in Neanderthal). This may reflect diagenic changes in the Denisovan genome or hyperarchaic admixture into Denisova (4). Neither our models nor that of MP allows for this, so all may introduce bias. Residuals (Fig. 2) reinforce the view that something is missing from all three models.
Fig. 2.
Residuals for the three models. MP is the “av.” model of Mafessoni and Prüfer; RBH0 and RBH1 are the without- and with-singleton versions of the model fit in Fig. 1. Horizontal bars show 95% bootstrap confidence intervals. Kullback–Leibler divergence, which measures the discrepancy between model and data, is 0.002 for MP but 0.001 for RBH0 and RBH1. All three models have points well outside the confidence intervals.
We favor the without-singleton analysis, which implies a fairly large Neanderthal population. Both analyses imply an early separation of the two archaics and a bottleneck among their ancestors.
Supplementary Material
Acknowledgments
We thank Elizabeth Cashdan and Ilan Gronau for their comments. A.R.R. was supported by NSF Award BCS 1638840 and by the Center for High Performance Computing at the University of Utah. R.J.B. was supported by National Cancer Institute Awards R25CA057730 [principal investigator (PI): Shine Chang, PhD] and CA016672 (PI: Ronald Depinho, MD). The funders had no role in study design, data collection and analysis, decision to publish, or preparation of the manuscript.
Footnotes
The authors declare no conflict of interest.
Data deposition: Data files documenting these analyses are archived at https://osf.io/e6p2z.
References
- 1.Mafessoni F, Prüfer K. Better support for a small effective population size of Neandertals and a long shared history of Neandertals and Denisovans. Proc Natl Acad Sci USA. 2017;114:E10256–E10257. doi: 10.1073/pnas.1716918114. [DOI] [PMC free article] [PubMed] [Google Scholar]
- 2.Rogers AR, Bohlender RJ, Huff CD. Early history of Neanderthals and Denisovans. Proc Natl Acad Sci USA. 2017;114:9859–9863. doi: 10.1073/pnas.1706426114. [DOI] [PMC free article] [PubMed] [Google Scholar]
- 3.The 1000 Genomes Project Consortium An integrated map of genetic variation from 1,092 human genomes. Nature. 2012;491:56–65. doi: 10.1038/nature11632. [DOI] [PMC free article] [PubMed] [Google Scholar]
- 4.Prüfer K, et al. The complete genome sequence of a Neanderthal from the Altai Mountains. Nature. 2014;505:43–49. doi: 10.1038/nature12886. [DOI] [PMC free article] [PubMed] [Google Scholar]


