Abstract
Purpose
To determine whether reactive oxygen species (ROS) in semen samples could be measured with the Monolight™ 3010 Luminometer.
Methods
Using the Monolight™ 3010 Luminometer, the ROS was measured in the unprocessed semen samples of infertile male patients, as well as the luminescence of 190 semen samples. The samples were classified as “luminescence‐detectable” (n = 89) and “luminescence‐undetectable” (n = 101). Thereafter, the luminescence of the semen samples that had been obtained from the 715 infertile patients was measured and compared by using Sperm Motility Analyzing System measurements. Moreover, in order to investigate the ROS measurement consistency, the chemiluminescence values of 84 samples were measured concurrently by using the Monolight™ 3010 Luminometer and the 1251 Luminometer™.
Results
The semen volume, sperm motility, and progressive motility of the samples were significantly higher in the luminescence‐undetectable samples. The sperm motility, straight‐line velocity, curvilinear velocity, mean amplitude head displacement, beat cross frequency, and progressive motility showed an inverse correlation with the logarithmic‐transformed luminescence level in the luminescence‐detected samples. The integrated chemiluminescence levels in the 84 samples were correlated.
Conclusion
The substance that was measured in the unprocessed semen with the Monolight™ 3010 Luminometer and stimulated chemiluminescence is ROS.
Keywords: biomarker, male infertility, oxidative stress, reactive oxygen species, unprocessed semen
1. INTRODUCTION
Oxidative stress (OS) is due to an imbalance between the generation of reactive oxygen species (ROS) and their antioxidant scavengers.1 Oxidative stress contributes to several diseases, including male infertility, and ROS have been detected in the semen samples of ~30‐80% of infertile male patients.2, 3 Recently, the presence of ROS in semen has been attributed to both activated leukocytes and defective spermatozoa. Leukocytes produce 1000‐fold greater ROS than spermatozoa do.4
The membrane of spermatozoa contains high levels of polyunsaturated fatty acids (PUFA) because they retain their fluidity in order to fuse to the oocyte membrane. The PUFA are weak if they are attacked by ROS. The peroxidation of PUFA in sperm induces a decline in sperm motility.5, 6 Furthermore, ROS infiltrate into sperm and break down the sperm DNA.7 These adverse effects of ROS result in a decrease in the natural pregnancy rate8 and the fertilization rate of assisted reproductive technology.9 As a result of a negative correlation between the ROS levels with sperm motility and fertilization, the ROS levels in semen could serve as an independent marker of male factor infertility, particularly in cases of idiopathic infertility.10, 11 Numerous studies concerning ROS in semen have been reported.6, 7, 8, 9, 10, 11, 12
Chemiluminescence assays are widely adopted in ROS measurement.6, 8, 12, 13, 14, 15, 16, 17 Constant chemiluminescence after the addition of 5‐amino‐2,3‐dihydro‐1,4‐phthalazine‐dione (luminol) to unprocessed or washed semen is measured with a luminometer. The authors previously had measured ROS in semen samples by using the 1251 Luminometer™ (LKB Wallac, Turku, Finland); however, cuvettes were unavailable for ROS measurement with the 1251 Luminometer™. Nevertheless, it was possible to obtain the Monolight™ 3010 Luminometer (BD Biosciences Pharmingen, Ltd., San Diego, CA, USA) and the necessary cuvettes.
To the authors' knowledge, no previous study has measured ROS in semen by using the Monolight™ 3010 Luminometer. Therefore, ROS were measured in the unprocessed semen samples of infertile male patients by using this device. This study aimed to determine whether ROS in whole semen samples could be measured with the Monolight™ 3010 Luminometer.
2. MATERIALS AND METHODS
2.1. Semen samples and semen parameter assessment
All the participants provided written informed consent. This study's protocols were reviewed and approved by the Yokohama City University Review Board, Yokohama City, Japan.
Between February, 2013 and June, 2016, the semen samples from 715 infertile male patients (mean age: 36.9 years; range: 15‐79 years) who visited Yokohama City University's Reproduction Center were studied. The azoospermic patients were excluded. The patients who were included had idiopathic infertility (n = 243), untreated varicoceles (n = 206), spermatogenic failure due to cancer chemotherapy (n = 51), an infertile female partner (n = 178), treated undescended testis (n = 13), and other causes of infertility (n = 24). Semen specimens were collected by masturbation after 48‐120 hours of sexual abstinence.
The semen analyses were performed two or three times before treatment with the Sperm Motility Analyzing System (SMAS™; DITECT, Ltd., Tokyo, Japan). After measurement of the semen volume with a 10 mL serological pipet (FALCON®; Corning, Tewksbury, MA, USA), the following parameters were measured by using the SMAS™: sperm concentration (×106/mL); sperm motility (%); straight‐line velocity (VSL) (μm/s) (measured as the straight‐line distance from beginning to end of a sperm track divided by the time taken); curvilinear velocity (VCL) (μm/s) (measured as the total distance traveled by a given sperm divided by the time elapsed); linearity index (LIN), or the ratio of VSL to VCL; mean amplitude of lateral head displacement (ALH) (μm) (measured as the mean width of sperm head oscillation); beat cross frequency (BCF) (Hz), defined as the frequency of the sperm head crossing the average sperm path; and progressive motility (%), or the fraction of spermatozoa that progress at a rate >25 μm/s in liquefied, unprocessed semen.
2.2. Measurement of the chemiluminescence of the semen samples with the Monolight™ 3010 Luminometer
During each patient's first consultation, immediately after the semen analysis, the results of the chemiluminescence of the sufficiently liquefied semen samples, using the Monolight™ 3010 Luminometer, a double‐tube luminometer, at room temperature (~25°C) in a slightly dark laboratory room, were recorded after the addition of 40 μL of 100 mmol L–1 luminol to 500 μL of whole semen.16 First, the integrated chemiluminescence between 0 and 200 seconds, without the addition of luminol, was measured. Subsequently, the integrated chemiluminescence over a similar period of time after the addition of luminol to the samples was measured. The integrated chemiluminescence value was calculated as the difference between after and before the addition of luminol to the semen samples. When the integrated luminescence value was negative, the value was defined as zero. When comparing the sperm motile parameter and the luminescence value, the calculated chemiluminescence value was expressed with relative light units (RLU)/200 s/106 spermatozoa and logarithmized. The time course of chemiluminescence in the first 190 samples was recorded when the researchers began using the device, recorded the time‐course‐curve pattern, and investigated the time course and integral value of the samples.
2.3. Comparison of the data measured with the 1251 Luminometer™ and the Monolight™ 3010 Luminometer
The luminometer was changed from the 1251 Luminometer™ to the Monolight™ 3010 Luminometer because cuvettes for ROS measurement with the former were unavailable. The chemiluminescence of the semen samples from 84 patients was measured by using both the 1251 Luminometer™ and the Monolight™ 3010 Luminometer in order to investigate the compatibility of chemiluminescence between the two devices. Moreover, only 84 cuvettes for the 1251 Luminometer™ were available; hence, 84 samples were examined. The 1251 Luminometer™ was used to measure the whole‐semen ROS level according to a previously reported method.16 When the luminescence was ≥0.1 mv/s at peak value, ROS production in this sample was considered to be detectable (Figure 1). Additionally, the integrated ROS values were used to clarify the differences between the ROS‐detectable and the ROS‐undetectable cases. The integrated ROS levels between 0 and 30 min after the addition of luminol were expressed as mV/30 minutes and considered as a new ROS level of the sample.
Figure 1.
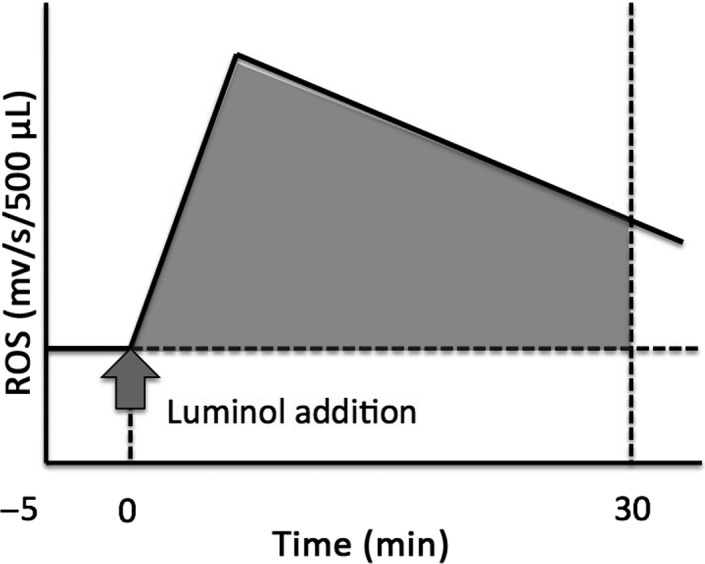
Reactive oxygen species (ROS), as measured by the chemiluminescence method with a 1251 Luminometer™.16 When the peak level was ≥.1 mv/s, the ROS formation was considered to be positive. The integral level of ROS production was calculated by subtracting the area under the baseline from the total chemiluminescence values, between 0 and 30 minutes after the addition of 40 μL of 100 mmol of luminol to 500 μL of unprocessed semen, and expressed as mV/30 min 106 spermatozoa
The integral ROS level, measured with both luminometers, was plotted on a graph and the correlation between the ROS levels, as measured by the two different luminometers, was investigated.
2.4. Statistical analysis
The statistical values are presented as the mean ± standard deviation. A chi‐square test was used to confirm bias in disease and the time‐course‐curve pattern, as well as disease and cases showing disease and emission values above the threshold. A Mann–Whitney U‐test was used to compare the luminescence values and semen parameters in the luminescence‐detectable and ‐undetectable groups. Correlations between the log (luminescence value) and the semen parameter, measured with the SMAS™, and those between the luminescence values that had been measured with the two luminometers were investigated by using Spearman's correlation coefficient. Differences were considered to be statistically significant when the P‐value was ≤.05. All the calculations were performed with the IBM SPSS statistics for Macintosh software (v. 22.0; IBM Corporation, Armonk, NY, USA).
3. RESULTS
3.1. Time course of chemiluminescence
When the chemiluminescence was measured with the Monolight™ 3010 Luminometer, the luminescence level increased for several seconds and then decreased rapidly before the addition of luminol. When multiple measurements were performed on the same specimen, the chemiluminescence values were almost the same (data not shown). Therefore, the data that were measured by using this study's method were reproducible and hence chemiluminesence measurement was performed once after the semen analysis. Moreover, the relationship between the time‐course‐curve pattern and the chemiluminescence value was investigated by using 190 sample data and the time course was recorded from the start of the study. The patients were diagnosed as having idiopathic infertility (n = 55), untreated varicocele (n = 80), spermatogenic failure due to cancer chemotherapy (n = 19), treatment of undescended testis (n = 2), or other causes (n = 6) and 29 had an infertile female partner. These 190 samples were divided into three groups, according to the time‐course pattern after the addition of luminol. The luminescence level increased rapidly and then decreased slowly for 100–150 s in Group A (n = 62). The integral luminescence value of the samples in this group was 51.62 ± 166.89‐fold higher than that observed before the addition of luminol. The luminescence level of the second sample group (Group B, n = 27) increased for several seconds and did not decrease during the measurement. The integral luminescence value of the samples in this group was 24.61 ± 31.84‐fold higher than that measured before the addition of luminol. In Group C (n = 101), although the peak value increased, the pattern of the time course was similar to that before the addition of luminol (Figure 2). The integral luminescence value was 1.68 ± 0.57‐fold higher than that measured before the addition of luminol (Table 1). Table 2 shows the number of patients, as classified according to the cause of male infertility and the time‐course‐curve pattern. More than 50% of the patients in the group with male factors, except the untreated varicocele group, had time‐course‐curve pattern A or B. Moreover, 21 (72.4%) of the 29 patients with an infertile female partner showed the waveform of the Group C pattern. However, no significant difference in the chi‐square test in all groups was noted (P = .065).
Figure 2.
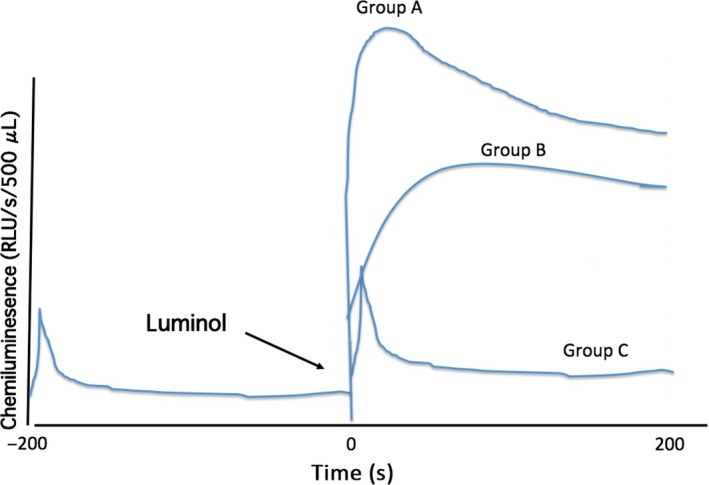
Time course of luminescence in the unprocessed semen samples. Before the addition of 40 μL of 100 mmol of luminol, the luminescence value increased for several seconds, before decreasing rapidly. After the addition of luminol, a rapid increase and then a slow decline in the luminescence level occurred in Group A, a rapid increase and then the maintenance of luminescence during the measuring time occurred in Group B, and a course similar to that observed before the addition of luminol, but with a slight increase in the integral luminescence level, occurred in Group C
Table 1.
Integrated chemiluminescence values and ratio of values
| After/before the addition of luminol according to the time course | Integrated chemiluminesence value (RLU/200 s) | Log chemiluminescence value | Value ratio after/before the addition of luminol |
|---|---|---|---|
| Group A (n = 62) | |||
| Mean ± SD | 135 886.75 ± 444 812.31 | 4.43 ± 0.67 | 51.62 ± 166.89 |
| Max. value | 3 310 733.00 | 6.52 | 1281.25 |
| Min. value | 4217.00 | 3.63 | 2.23 |
| Group B (n = 27) | |||
| Mean±SD | 58 681.10 ± 82 261.60 | 4.42 ± 0.55 | 24.61 ± 31.84 |
| Max. value | 286,310.96 | 5.46 | 111.74 |
| Min. value | 4320.81 | 3.64 | 2.69 |
| Group C (n = 101) | |||
| Mean ± SD | 1564.84 ± 1166.58 | 2.92 ± 0.69 | 1.68 ± 0.58 |
| Max. value | 4848.00 | 3.69 | 3.80 |
| Min. value | 0.00 | 0.00 | 1.00 |
Max., maximum; Min., minimum; RLU, relative light units; SD, standard deviation.
Table 2.
Distribution of the samples according to the time‐course‐curve pattern and cause of infertility
| Variable | Time‐course‐curve group | ||
|---|---|---|---|
| A (62) | B (27) | C (101) | |
| Idiopathic infertility (55) | 18 | 9 | 27 |
| Varicocele (80) | 25 | 14 | 41 |
| Postchemotherapy (19) | 9 | 1 | 9 |
| Undescended testis (2) | 1 | 1 | 0 |
| Other cause (6) | 2 | 1 | 3 |
| Partner of female patient (29) | 7 | 1 | 21 |
P = .065, according to the chi‐square test.
3.2. Determinants of the threshold level of chemiluminescence
When the measured luminescence values were arranged in order from the lowest, all the samples exhibiting a luminescence value of <4217 RLU/200 s had time‐course‐curve pattern C. The samples exhibiting luminescence values from 4217 to 4848 RLU/200 s showed all three time‐course‐curve patterns. When the luminescence value exceeded 4848 RLU/200 s, only time‐course‐curve patterns A and B were observed.
As investigator subjectivity could be involved in the evaluation of time‐course patterns, a threshold should be necessary. The threshold of this study's data was between 4217 and 4848 RLU/200 s. The mean, maximum, and minimum integrated and logarithmized chemiluminescence values of the samples in each group are shown in Table 1 and Figure 3. Both Groups A and B were classified as the chemiluminescence‐detectable group and Group C as the chemiluminescence‐undetectable group. In order to determine the threshold level of the luminescence‐detectable and ‐undetectable samples, a receiver operating characteristic curve analysis was performed. The area under the curve was 99.9% (95% confidence interval: 0.997‐1.000, P < .001) for the luminescence value. When the threshold level was at 4332.4 RLU/200 s, the sensitivity and specificity were 97.8% and 99.6%, respectively (Figure 4).
Figure 3.
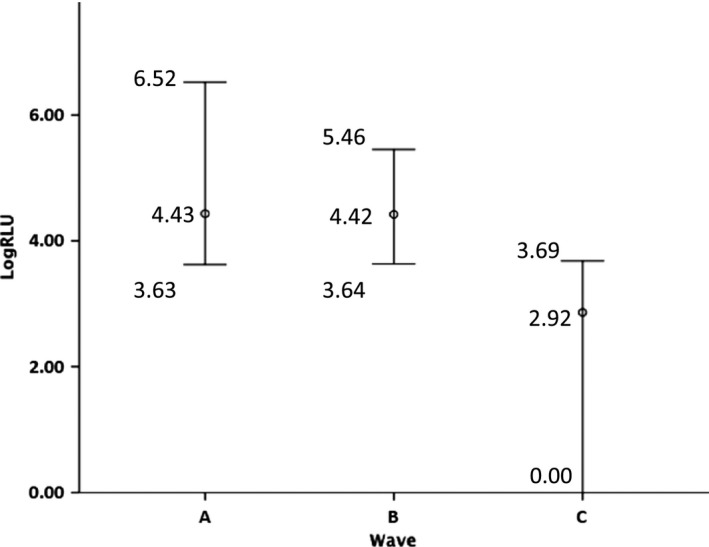
Comparison of the maximum, mean, and minimum logarithmized chemiluminescence values of each group, according to the time‐course pattern
Figure 4.
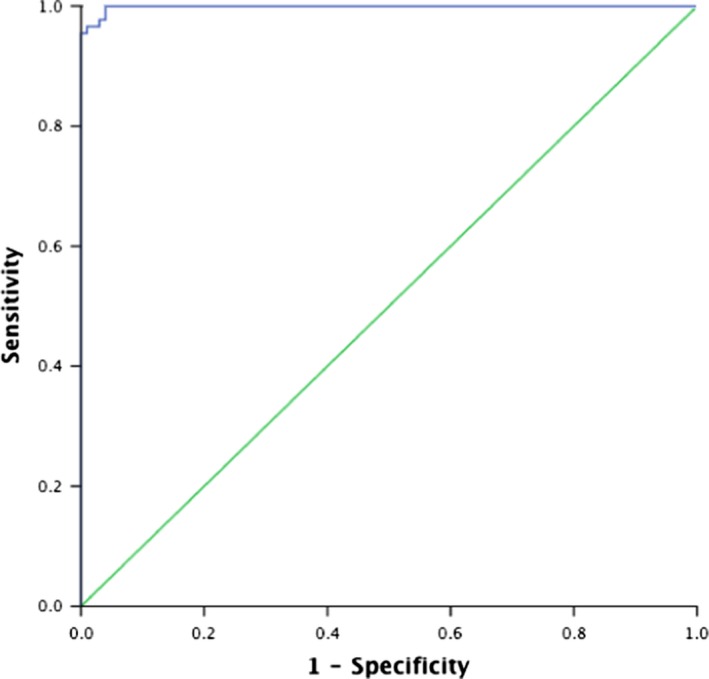
Receiver operating characteristic curve. The data show the area under the curve in the infertile male patients. The area under the curve was 99.9% (95% confidence interval: 0.997‐1.000, P < .001) for the luminescence value. When the threshold level was at 4332.4 RLU/200 s, the sensitivity and specificity were 97.8% and 99.6%, respectively
3.3. Correlation between the luminescence level of the chemiluminescence‐detectable samples and the semen motile parameters measured with the SMAS™
After identifying the threshold level, 525 samples additionally were analyzed; their luminescence was measured with the Monolight™ 3010 Luminometer. The 715 samples were divided into the luminescence‐detectable group (>4332.4 RLU/200 s of the integrated chemiluminescence value) and the luminescence‐undetectable group (<4332.4 RLU/200 s). The semen parameters (semen volume, sperm concentration, and motile parameters, measured with the SMAS™) of both groups were compared (Table 3). In total, 315 (44.1%) samples were luminescence‐detectable (over the threshold value) and 400 (55.9%) samples were luminescence‐undetectable. The semen volume, sperm motility, and progressive motility in the luminescence‐detectable group were significantly lower than those in the luminescence‐undetectable group (2.58 ± 1.48 vs 2.82 ± 1.44 mL, P = .007; 25.43% ± 17.34% vs 27.99% ± 16.98%; and 23.15% ± 16.73% vs 25.54% ± 16.04%, respectively). Furthermore, when classified according to disease, the lowest frequency of the luminescence‐detectable sample was found in the patients that were the partner of infertile women (49 out of 178 samples, 27.5%). More than 50% of the men in the group of infertile male patients were over the threshold level, with the exception of the idiopathic infertile group (111 out of 243 samples, 45.7%). Significant differences in the number of cases exhibiting luminescence values exceeding disease and threshold values in the chi‐square test were observed (Figure 5; P < .001).
Table 3.
Semen parameters and chemiluminescence values in the semen sample of greater or less than the threshold level (4332.4 RLU/200 s)
| Chemiluminescence | Volume (mL) | Concentration (×106/mL) | Motility (%) | VSL (μm/s) | VCL(μm/s) | LIN | Mean ALH (μm) | BCF (Hz) | Progressive motility (%) |
|---|---|---|---|---|---|---|---|---|---|
| Less than threshold (n = 400) | |||||||||
| Mean ± SD | 2.82 ± 1.44 | 30.63 ± 26.04 | 27.99 ± 16.98 | 19.72 ± 5.50 | 53.47 ± 16.81 | .41 ± .09 | 1.51 ± .77 | 12.69 ± 2.69 | 25.54 ± 16.04 |
| Greater than threshold (n = 315) | |||||||||
| Mean ± SD | 2.58 ± 1.48 | 28.78 ± 27.73 | 25.43 ± 17.34 | 19.79 ± 7.52 | 52.83 ± 21.11 | .39 ± .14 | 1.51 ± 1.01 | 12.50 ± 3.48 | 23.15 ± 16.73 |
| Mann‐Whitney U‐test (P‐value) | .007a | .112 | .038a | .115 | .545 | .615 | .843 | .868 | .036a |
ALH, amplitude of lateral head displacement; BCF, beat cross frequency; LIN, linearity index; SD, standard deviation; VCL, curvilinear velocity; VSL, straight‐line velocity.
Significant at P‐value < 0.05
Figure 5.
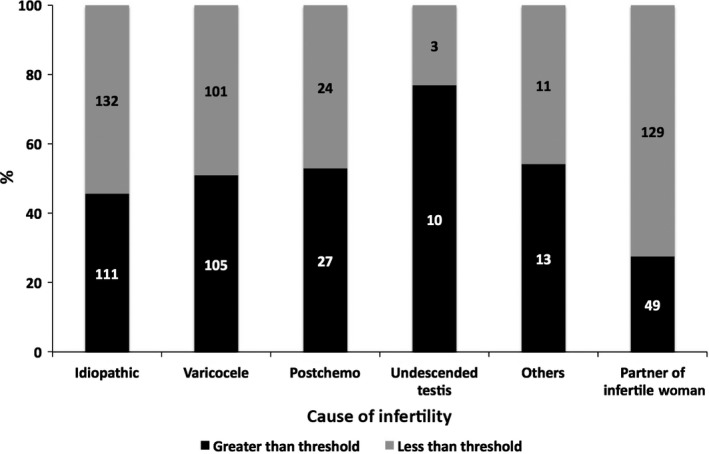
Number of patients with a chemiluminescence value greater or less than the threshold level. The patients are categorized according to the cause of their infertility. P < .001, according to the chi‐square test
In order to standardize the luminescence values, the luminescence values of the samples were converted to per 106 spermatozoa and the values were logarithmically transformed. The standardized chemiluminescence values of the samples above the threshold level of each group were compared. The gynecologic patients' partner group had the lowest value (log RLU/200 s/106 spermatozoa = 3.02 ± 0.70), which was significantly lower than that of the idiopathic infertility group (3.43 ± 0.73), untreated varicocele group (3.49 ± 0.86), and postchemotherapy group (3.84 ± 0.74). No significant difference among the patient groups with male factors was found (Figure 6).
Figure 6.
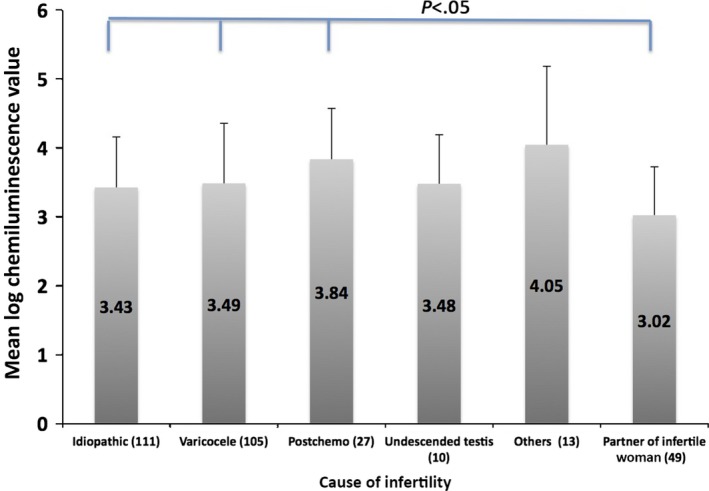
Chemiluminescence (mean ± standard deviation) value above the threshold level of the samples in each group of patients
The correlation between the luminescence level and the semen motile parameters (motility, VSL, VCL, LIN, mean ALH, BCF, and progressive motility) of the 315 patients in the chemiluminescence‐detectable group was investigated. The luminescence values of the samples in the chemiluminescence‐detectable group were significantly negatively correlated with all of the semen motile parameters, except the LIN (Figure 7).
Figure 7.
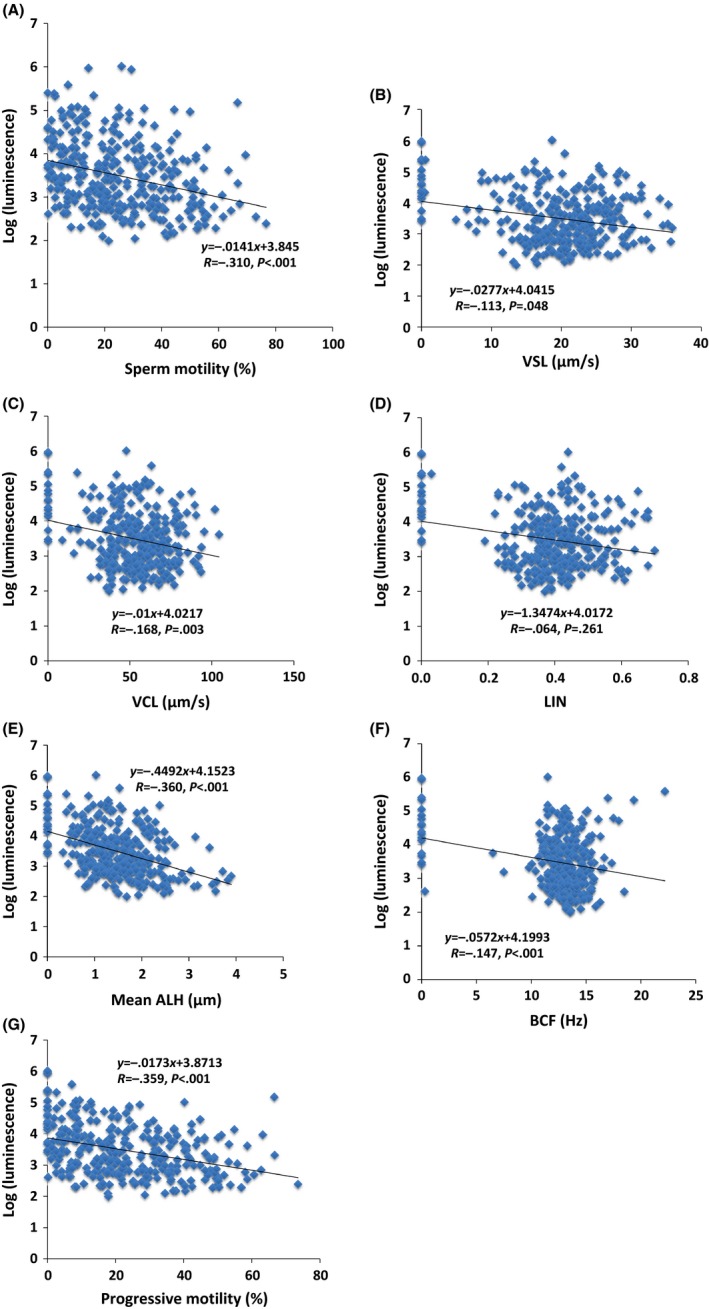
Scatter plot of the logarithmic‐transformed luminescence levels, showing each relationship between the luminescence levels and semen parameters that were measured with the SMAS ™ in the semen samples of the 315 patients in the chemiluminescence‐detectable group. (A) Sperm motility (B) straight‐line velocity (VSL), (C) curvilinear velocity (VCL), (D) linearity index (LIN), (E) mean amplitude of lateral head displacement (ALH), (F) beat cross frequency (BCF), and (G) progressive motility. The sperm motility (P < .001), VSL (P = .048), VCL (P = .003), mean ALH (P < .001), BCF (P < .001), and progressive motility (P < .001) showed inverse correlations with the chemiluminescence level
3.4. Correlation of the luminescence levels measured by the 1251 Luminometer™ and the Monolight™ 3010 Luminometer
The chemiluminescence values of the 84 samples were measured concurrently with the two luminometers and plotted to determine whether a correlation between the devices existed. The integrated luminescence level in the 84 semen samples, as measured by the Monolight™ 3010 Luminometer, was strongly correlated with that measured by the 1251 Luminometer™ (conversion formula: y = 31.974X + 1769.6; P < .001, R = 0.824) (Figure 8).
Figure 8.
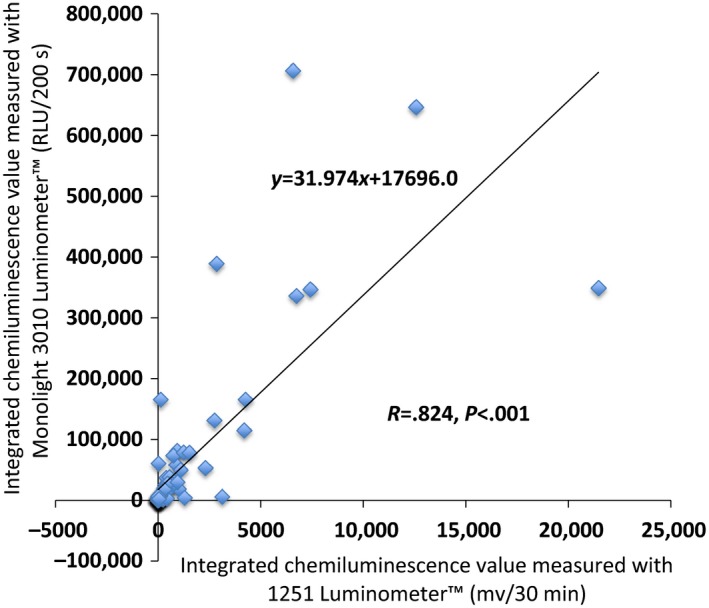
Correlation of the integrated reactive oxygen species (ROS) values, as measured with the 1251 Luminometer™ and the Monolight™ 3010 Luminometer. A strong correlation between the ROS values that were measured with the two luminometers was noted. Using a conversion formula, the ROS value that was measured with the 1251 Luminometer™ was converted to that measured with the Monolight™ 3010 Luminometer
4. DISCUSSION
Oxidative stress is one of the major factors that could result in male infertility.2, 3 A study reported that several male patients with infertility of unknown cause had OS.17 Moreover, testicular damage due to OS is induced by male infertility diseases, such as varicocele and cryptorchism,18 and by exposure to chemicals, such as anticancer drugs,18 heavy metals,19 and phthalates.18 Numerous studies on the relationship between ROS in semen and sperm motility, as well as fertility, have been published.
The methods of measuring OS in semen include the following: (i) a direct assay that measures the amount of ROS, including chemiluminescence, electron spin resonance, nitroblue tetrazolium test, and thiobarbituric acid assay; and (ii) an indirect assay that measures the effect of OS, including the measurement of antioxidants, lipid peroxidation, and DNA damage.11 Of these methods, the chemiluminescence assay is used widely to measure ROS in semen.6, 7, 8, 13, 14, 15, 18, 20 To the authors' knowledge, ROS measurement in semen by using the Monolight™ 3010 Luminometer has not been reported, although this device also has the same system as the other luminometer for measuring chemiluminescence.
Based on the time‐course curve after the addition of luminol, the samples were divided into three groups. The time‐course curve of Groups A and B was different from that observed before the addition of luminol. The integral values were ~50‐fold and 20‐fold higher in Groups A and B, respectively, than the value before the addition of luminol. The semen in these groups possibly contained a substance that stimulated chemiluminescence by luminol. Conversely, although the integral value of the samples in Group C was slightly increased (average: 1.68‐fold), no change in the time‐course curve was observed after the addition of luminol. The authors believe that the samples in this group did not contain the same substance as did the samples in Groups A and B.
In order to classify the samples according to whether chemiluminescence was detected or not and to exclude investigator subjectivity, a threshold level for the values that were generated by the luminometer needed to be determined. A receiver operating characteristic curve was generated from the pattern of the time‐course curve and the luminescence level and the threshold level was defined as 4332.4 RLU/200 s. The semen volume, sperm motility, and progressive motility of the samples with greater than the threshold luminescence level were significantly lower than those of the samples with less than the threshold luminescence level.
The luminescence values of the samples with greater than the threshold level, converted to per 106 spermatozoa and logarithmically transformed, were negatively correlated with the semen motile parameters that were measured by the SMAS™, except the LIN. These results were similar to those of other reports on the correlation between ROS in semen and semen parameters.6, 10, 16
Based on these results, the substances that stimulated chemiluminescence, measured with the Monolight™ 3010 Luminometer, were considered to be ROS in the unprocessed semen samples. The cause of the difference in the time‐course curve of Groups A and B remains unknown. No significant difference in the chi‐square test in all groups, classified according to the time‐course‐curve pattern and cause of infertility, was observed (Table 2; P = .065). This finding could be because the dose of luminol (100 mmol L–1 , 40 μL) in the current study was higher than that in other reports.6, 8, 13, 14, 15, 21 The authors assumed that increasing the dose of luminol would make ROS detection clearer and the authors adopted the luminol dose that was reported by a specific study.16 However, in this study's results, the percentage of the semen samples in Groups A and B were 31.9 and 14.1%, respectively. In all the patients, the percentage of samples that had greater than the threshold level was 44.1%. These percentages were almost similar to those in other reports. Moreover, Figure 3 shows that the ranges of logarithmized ROS values of the samples in Groups A and B overlapped. Thus, it is believed that the detectable ROS in the Group B samples were not false‐positives and that adversely affected sperm motility. As another cause, the proportion of the origin of ROS in each time‐course‐curve group might be different. The ROS in semen have been associated with activated leukocytes and defective spermatozoa. In addition, the time‐course pattern difference might depend on the ratio of activated leukocytes to defective spermatozoa in the semen. The authors are conducting further investigations in order to elucidate this cause.
The integral value of chemiluminescence was defined 200 seconds after the addition of luminol as the total amount of ROS because the authors consider that the integral ROS level reflects the effect of ROS on spermatozoa. The authors have adopted this method since starting measuring ROS using the 1251 Luminometer™.6, 8, 16
The samples were classified according to the cause of male infertility and the ROS detection rate of each group and the ROS value was compared. The ROS was detected in 27.5% of the patients with an infertile female partner (Figure 5). In the authors' department, gynecologists advised the male partners with abnormal semen findings in order to seek a consultation with the urological specialists. However, not all of the advised men underwent urological investigation. Those patients who did were assigned to one of the aforementioned male causes of infertility, while the remainder was included in the “male with an infertile female partner” group. Seminal findings might be normal and abnormal in these patients and the inclusion of those with male factors was possible. Therefore, ROS‐detectable patients could have been included in the group that was composed of men with an infertile female partner. Nevertheless, numerous patients in this group had good semen findings or mildly reduced ones; thus, the ROS detection rate was low and the value of positive cases was estimated to be significantly low. Moreover, the difference in the ROS detection rate among the patients who were grouped according to male causes was noted (Figure 6). Not all infertile male patients are affected by OS. The degree of OS involvement seems to be different, depending on the disease.
Lastly, the consistency of ROS was measured by the two devices. Although both devices measured chemiluminescence that was initiated by luminol, the unit for the luminescence values in the 1251 Luminometer™ was mv, while that in the Monolight™ 3010 Luminometer was RLU. Furthermore, the measuring time of both devices was different (30 minutes and 200 seconds for the 1251 Luminometer and the Monolight 3010 Luminometer, respectively). However, a strong correlation between the integral ROS values that were measured by both luminometers was noted. The luminescence values that were measured with the two devices, despite the difference in units and measuring time, also exhibited a strong correlation: much of the total chemiluminescence had accumulated within several minutes after the addition of luminol. The measuring time of the 1251 Luminometer™ therefore might be <30 minutes. The advantage of this study's ROS measuring method is its simplicity: washing the semen and adjusting the sperm count was unnecessary. The measurements that used the Monolight™ 3010 Luminometer shortened the time of examination of the ROS in the semen (from 35 minutes to 400 seconds). This result also supports the finding that the Monolight™ 3010 Luminometer can measure ROS in unprocessed semen.
As previously mentioned, the 1251 Luminometer™ was used to measure the ROS in semen. Related results have been reported.16 The computer‐assisted semen analyzer that was used and the amount of luminol that was added in the current method were exactly the same as those used in their method. However, this study's measured ROS values had a stronger correlation coefficient with each sperm motility parameter. Furthermore, this study's measured ROS values were correlated with the VSL and VCL, whereas no correlation between their ROS values and the two velocities was found. A strong correlation of the ROS values that were measured with the 1251 Luminometer™ and with the Monolight™ 3010 Luminometer was observed and the larger the ROS value, the bigger the dispersion (Figure 8). It was speculated that the Monolight™ 3010 Luminometer could measure ROS in semen more accurately than the 1251 Luminometer™.
The ROS in semen correlates with sperm motility and fertility1, 2, 3, 6, 7, 8, 9, 10, 11, 12, 16 and ROS might be one of the most effective biomarkers of male infertility.10, 11 Recently, due to advances in proteomics, a number of candidate biomarkers of male infertility have been reported.22, 23 However, no candidate biomarker could surpass ROS.
Although ROS could be one of the most effective biomarkers of male infertility,10 ROS are not routinely measured in clinical practice to investigate male infertility. Nevertheless, ROS tests, as sperm function tests in research procedures, were published in the latest World Health Organization laboratory manual.24 However, one study stated that despite its potential to provide additional prognostic information, ROS testing is not commonly performed during the initial assessment of male fertility because of its high cost, inconvenience, and lack of efficiency.11
This study's method is convenient and inexpensive as ROS were measured with unprocessed semen; that is, without the need for semen washing and preparation. Furthermore, it has been shown that, using this study's method, a negative correlation between ROS in whole semen and sperm motile parameters,6, 13 the natural pregnancy rate,8 and the sperm motility index20 exists. The ROS in the unwashed (unprocessed) semen, and measured by this study's method, was considered to reflect the fertility potential of a patient. However, this method does not adjust the sperm concentration because semen washing is not used. Therefore, it is necessary to divide the total amount of ROS detected by the sperm concentration and convert it into ROS per 106 sperm. The origin of ROS in semen has been associated with activated leukocytes and/or defective spermatozoa. The last calculated ROS value is the amount of ROS exposed to 106 spermatozoa for 200 s. In conclusion, chemiluminescence, measured with the Monolight™ 3010 Luminometer, was associated with ROS in the unprocessed semen samples. The threshold chemiluminescence level of ROS was defined, as measured with this luminometer, as 4332.4 RLU/200 s. The ROS in unprocessed semen samples is possibly one of the most effective biomarkers of male infertility.
DISCLOSURES
Conflict of interest: The authors declare no conflict of interest. Human and Animal Rights: All the procedures that were followed were in accordance with the ethical standards of the responsible committees on human experimentation (institutional and national) and with the Helsinki Declaration of 1964 and its later amendments. This article does not contain any study with animal participants that has been performed by any of the authors.
Yumura Y, Takeshima T, Kawahara T, et al. Reactive oxygen species measured in the unprocessed semen samples of 715 infertile patients. Reprod Med Biol. 2017;16:354‐363. https://doi.org/10.1002/rmb2.12052
REFERENCES
- 1. Sikka SC. Relative impact of oxidative stress on male reproductive function. Curr Med Chem. 2001;8:851‐862. [DOI] [PubMed] [Google Scholar]
- 2. Tremellen K. Oxidative stress and male infertility: a clinical perspective. Hum Reprod Update. 2008;14:243‐258. [DOI] [PubMed] [Google Scholar]
- 3. Agarwal A, Said TM, Bedaiwy MA, Banerjee J, Alvarez JG. Oxidative stress in an assisted reproductive techniques setting. Fertil Steril. 2006;86:503‐512. [DOI] [PubMed] [Google Scholar]
- 4. Plante M, de Lamirande E, Gannon C. Reactive oxygen species released by activated neutrophils, but not by deficient spermatozoa, are sufficient to affect normal sperm motility. Fertil Steril. 1994;62:386‐393. [DOI] [PubMed] [Google Scholar]
- 5. Alvarez JG, Storey BT. Differential incorporation of fatty acids into and peroxidative loss of fatty acids from phospholipids of human spermatozoa. Mol Reprod Dev. 1995;42:332‐346. [DOI] [PubMed] [Google Scholar]
- 6. Iwasaki A, Gagnon C. Formation of reactive oxygen species in spermatozoa of infertile patients. Fertil Steril. 1992;57:409‐416. [DOI] [PubMed] [Google Scholar]
- 7. Desai N, Sharma R, Makker K, Sabanegh E, Agarwal A. Physiologic and pathologic levels of reactive oxygen species in neat semen of infertile men. Fertil Steril. 2009;92:1626‐1631. [DOI] [PubMed] [Google Scholar]
- 8. Yumura Y, Iwasaki A, Saito K, Ogawa T, Hirokawa M. Effect of reactive oxygen species in semen on the pregnancy of infertile couples. Int J Urol. 2009;16:202‐207. [DOI] [PubMed] [Google Scholar]
- 9. Das S, Chattopadhyay R, Jana SK, et al. Cut‐off value of reactive oxygen species for predicting semen quality and fertilization outcome. System Biol Reprod Med. 2008;54:47‐54. [DOI] [PubMed] [Google Scholar]
- 10. Agarwal A, Sharma RK, Nallella KP, Thomas AJ, Alvarez JG, Sikka SC. Reactive oxygen species as an independent marker of male factor infertility. Fertil Steril. 2006;86:878‐885. [DOI] [PubMed] [Google Scholar]
- 11. Ko EY, Sabanegh ES, Agarwal A. Male infertility testing: reactive oxygen species and antioxidant capacity. Fertil Steril. 2014;102:1518‐1527. [DOI] [PubMed] [Google Scholar]
- 12. Agarwal A, Makker K, Sharma R. Clinical relevance of oxidative stress in male factor infertility: an update. Am J Reprod Immunol. 2008;59:2‐11. [DOI] [PubMed] [Google Scholar]
- 13. Agarwal A, Ahmad G, Sharma R. Reference values of reactive oxygen species in seminal ejaculates using chemiluminescence assay. J Assist Reprod Genet. 2015;32:1721‐1729. [DOI] [PMC free article] [PubMed] [Google Scholar]
- 14. Vessey W, Perez‐Miranda A, Macfarquhar R, Agarwal A, Homa S. Reactive oxygen species in human semen: validation and qualification of a chemiluminescence assay. Fertil Steril. 2014;102:1576‐1583. [DOI] [PubMed] [Google Scholar]
- 15. Homa ST, Vessey W, Perez‐Miranda A, Riyait T, Agarwal A. Reactive oxygen species (ROS) in human semen: determination of reference range. J Assist Reprod Genet. 2015;32:757‐764. [DOI] [PMC free article] [PubMed] [Google Scholar]
- 16. Takeshima T, Yumura Y, Yasuda K, et al. Inverse correlation between reactive oxygen species in unwashed semen and sperm motion parameters as measured by a computer‐assisted semen analyzer. Asian J Androl. 2016;18:1‐5. [DOI] [PMC free article] [PubMed] [Google Scholar]
- 17. Iammarrone E, Balet R, Lower AM, Gillot C, Grudzinskas JG. Male infertility. Best Prac Res Clin Obstet Gynaecol. 2003;17:211‐229. [DOI] [PubMed] [Google Scholar]
- 18. Turner TT, Lysiak J. Oxidative stress: a common factor in testicular dysfunction. J Androl. 2008;29:488‐498. [DOI] [PubMed] [Google Scholar]
- 19. Kiziler AR, Aydemir B, Onaran I, et al. High levels of cadmium and lead in seminal fluid and blood of smoking men are associated with high oxidative stress and damage in infertile subjects. Biol Trace Elem Res. 2007;120:82‐91. [DOI] [PubMed] [Google Scholar]
- 20. Kuroda S, Yumura Y, Mori K, et al. Negative correlation between presence of reactive oxygen species and Sperm Motility Index in whole semen samples of infertile males. Rev Int Androl. 2017;15:84‐89. [Google Scholar]
- 21. Hauser R, Meeker JD, Singh NP, et al. DNA damage in human sperm is related to urinary levels of phthalate monoester and oxidative metabolites. Hum Reprod. 2007;22:688‐695. [DOI] [PubMed] [Google Scholar]
- 22. Agarwal A, Duraurajanayagam D, Halabi J, Peng J, Vazquez‐Levin M. Proteomics, oxidative stress and male infertility. Reprod Biomed Online. 2014;29:32‐58. [DOI] [PubMed] [Google Scholar]
- 23. Gilany K, Minai‐Tehrani A, Savadi‐Shiraz E, Rezadoost H, Lakpour N. Exploring the human seminal plasma proteome: an unexplored gold mine of biomarker for male infertility and male reproduction disorder. J Reprod Infertil. 2015;16:61‐71. [PMC free article] [PubMed] [Google Scholar]
- 24. World Health Organization . WHO Laboratory Manual for the Examination and Processing of Human Semen. 5th edn Geneva: World Health Organization; 2010. [Google Scholar]


