

Abstract
Background and Purpose
Mitochondria‐associated membranes (MAMs) are specific endoplasmic reticulum (ER) domains that enable it to interact directly with mitochondria and mediate metabolic flow and Ca2+ transfer. A growing list of proteins have been identified as MAMs components, but how they are recruited and function during complex cell stress situations is still not understood, while the participation of mitochondrial matrix proteins is largely unrecognized.
Experimental Approach
This work compares mitochondrial/ER contact during combined ER stress/mitochondrial dysfunction using a model of human hepatoma cells (Hep3B cell line) treated for 24 h with classic pharmacological inducers of ER stress (thapsigargin), mitochondrial dysfunction (carbonyl cyanide m‐chlorophenyl hydrazone or rotenone) or both (the antiretroviral drug efavirenz used at clinically relevant concentrations).
Key Results
Markers of mitochondrial dynamics (dynamin‐related protein 1, optic atrophy 1 and mitofusin 2) were expressed differently with these stimuli, pointing to a specificity of combined ER/mitochondrial stress. Lon, a matrix protease involved in protein and mtDNA quality control, was up‐regulated at mRNA and protein levels under all conditions. However, only efavirenz decreased the mitochondrial content of Lon while increasing its extramitochondrial presence and its localization to MAMs. This latter effect resulted in an enhanced mitochondria/ER interaction, as shown by co‐immunoprecipitation experiments of MAMs protein partners and confocal microscopy imaging.
Conclusion and Implications
A specific dual drug‐induced mitochondria‐ER effect enhances the MAMs content of Lon and its extramitochondrial expression. This is the first report of this phenomenon and suggests a novel MAMs‐linked function of Lon protease.
Abbreviations
- CCCP
carbonyl cyanide m‐chlorophenyl hydrazone
- Drp1
dynamin‐related protein 1
- ER
endoplasmic reticulum
- ETC
electron transport chain
- IMM
inner mitochondrial membrane
- MAMs
mitochondria‐associated membranes
- Mfn1
mitofusin 1
- Mfn2
mitofusin 2
- MM
mitochondrial matrix
- OMM
outer mitochondrial membrane
- OPA1
optic atrophy 1
Introduction
The endoplasmic reticulum (ER) is a membrane‐bound organelle involved in the synthesis, storage, modification and transport of newly synthesized proteins, as well as regulation of intracellular Ca2+ trafficking (Lodish et al., 2000). Mitochondria, which also directly participate in cellular Ca2+ homeostasis, are subcellular compartments where ATP is generated and where many metabolic pathways take place (tricarboxylic acid cycle and synthesis of urea and phospholipids) (Lodish et al., 2000). It is well known that the tight functional link between ER and mitochondria is fundamental for the maintenance of cellular homeostasis, which is vital under stress conditions (Giorgi et al., 2009). However, in accordance with the traditional view of these organelles as independent entities, the bulk of the research regarding cell stress mechanisms has focused on either one of these organelles separately. A long list of human pathologies has been related to mitochondrial dysfunction and/or ER‐stress, but little is known about the spatio/temporal interconnection between these crucial phenomena. Nevertheless, it may have important clinical implications, for example, mitochondrial changes in response to ER‐stress conditions have been described for several human diseases, including type II diabetes and Alzheimer's disease (Vannuvel et al., 2013).
Additionally, in recent years, it has become evident that these two organelles are spatially connected through specific and tightly regulated contact sites known as mitochondria‐associated ER membranes (MAMs) (Vance, 1990). The composition and function of these structures are still far from being understood; however, current knowledge suggests that MAMs enable a two‐way supply of fundamental metabolites/messengers, such as lipids or Ca2+, while modulating the bioenergetic fate of the cell (Giorgi et al., 2009). Many proteins have been shown to participate in MAMs, and it is evident that the composition of these structures adapts in response to multiple internal and external stimuli (Bui et al., 2010). One of the most widely described complexes involves the mitochondrial voltage‐dependent anion channel (VDAC) and ER inositol trisphosphate receptor (IP3 receptor), which physically interact through the chaperone Grp75 (mitochondrial HSP70) (Szabadkai et al., 2006). In addition, abundant evidence points to the fact that the dynamics of both ER and mitochondria depend on the formation and dissolution of ER–mitochondrial contacts. In line with this, it is known that many proteins involved in ER tubule fusion and/or mitochondrial distribution and morphology are either integral components of MAMs or interact with it (Bui et al., 2010). For example, the dynamin‐related mitochondrial fusion protein mitofusin 2 (Mfn2), present at both the ER and mitochondrial surface (de Brito and Scorrano, 2008), not only enables intermitochondrial contacts but also regulates ER shape and ER–mitochondria tethering. Moreover, the ER has been shown to be associated with mitochondrial fission (Friedman et al., 2011), and numerous co‐immunoprecipitation experiments have revealed links between classic mitochondrial fission mediators [Fis1, dynamin‐related protein 1 (Drp1)] and typical ER‐bound proteins. The relative participation of ER and mitochondria in the fission complex triggered by different stimuli and how it affects the different physipathological outcomes is not yet fully understood. In this regard, the vast majority of mitochondrial proteins thought to be associated with MAMs and/or fission are outer mitochondrial membrane (OMM) proteins, while the specific connection between inner mitochondrial membrane (IMM)/mitochondrial matrix (MM) proteins and the ER has not been clarified.
The mitochondrial protein quality control protease Lon is located in the MM (Hori et al., 2002) and has been implicated in numerous processes, including degradation of oxidatively damaged mitochondrial proteins (Bota and Davies, 2002), assembly of electron transport chain (ETC) complexes (Fukuda et al., 2007) and regulation of mtDNA maintenance, transcription and replication (Matsushima et al., 2010). There is mounting evidence that Lon is up‐regulated upon ER stress in order to protect mitochondrial function from ER stress‐induced damage (Han et al., 2013; Rainbolt et al., 2014). However, unlike other mitochondrial quality control factors located in MM – such as Grp75/HSPA9, which has been related to MAMs and can have extramitochondrial localization – no clear connection exists regarding Lon and the mitochondria/ER coupling that occurs under stress conditions.
The aim of this work was to compare mitochondrial/ER contact during combined ER/mitochondrial stress using an in vitro model and to establish whether Lon is involved in this interorganelle interaction. In previous publications (Apostolova et al., 2013; Polo et al., 2015), we have described an intriguing dual phenomenon of mitochondrial and ER‐stress in human hepatic cells treated with the antiretroviral drug efavirenz. This non‐nucleoside analogue reverse transcriptase (RT) inhibitor exerts a rapid, direct inhibitory effect on mitochondrial respiration, which leads to a decrease in mitochondrial membrane potential (ΔΨm) and enhanced ROS levels (Apostolova et al., 2010; Polo et al., 2015). Secondary to its mitochondrial action, efavirenz activates unfolded protein response (UPR) and produces ER‐stress (Apostolova et al., 2013). Moreover, this dual effect of efavirenz is associated with an up‐regulation of Lon expression, an effect that is diminished in cells with compromised mitochondrial respiration (Polo et al., 2015). Having previously analysed the mitochondrial effect of efavirenz, we now anticipated that mitochondrial dynamics might be altered and that the expression of fusion/fission proteins might be modified. We compared this action with those exerted by other pharmacological cellular stressors that interfere with mitochondrial and ER‐function and thus display similarities with efavirenz ‐ thapsigargin, rotenone (Rot) and carbonyl cyanide m‐chlorophenyl hydrazone (CCCP). Additionally, many of the proteins involved in mitochondrial dynamics are direct or indirect participants of the MAMs, which lead us to analyse MAMs in our model.
The hypothesis that Lon is involved with MAMs was based on two observations: (i) Lon is a mitochondrial protein induced by ER stress, and (ii) there are reasonable similarities between Lon and Grp75, a notorious MAM protein. Our results support an association of Lon with MAMs and provide evidence that this relationship occurs specifically in a model of dual drug‐induced mitochondrial/ER‐stress.
Methods
Cell culture, treatments and transfections
Experiments were performed with the human hepatoblastoma cell line Hep3B (ATCC HB‐8064), which displays a certain degree of cytochrome P450 activity (specifically CYP2B6) capable of metabolizing efavirenz (Zhu et al., 2007; Lin et al., 2012). Cells were cultured in minimal essential medium (MEM), supplemented with 10% heat‐inactivated FBS, 2 mM L‐glutamine, 1 mM non‐essential amino acids, 1 mM sodium pyruvate. For comparison, in some experiments, we also employed the human glioma cell line U‐251MG (CLS 300385, European Collection of Cell Culture, Salisbury, UK), which was cultured as described previously (Funes et al., 2014), and the primary cell line HUVEC, which was isolated from fresh human umbilical cords by extraction with collagenase and cultured in EMG‐2 medium supplemented with 2.5 μg·mL−1 fungizone‐amphotericin B and BulletKit components (Clonetics, Lonza, Walkersville, MD, USA) according to the manufacturer's instructions (Apostolova et al., 2010). The protocol employed complied with European Community guidelines for the use of human experimental models and was approved by the Ethics Committee of the University of Valencia.
Cell cultures were used for experiments at passage number lower than 25 (for Hep3B and U‐251MG) or lower than 3 (for HUVEC). All cell cultures were maintained in the presence of penicillin (50 U·mL−1) and streptomycin (50 μg·mL−1). Unless stated otherwise, all the reagents employed in cell culture were purchased from ThermoFisher Scientific (Walthman, MA, USA). All cell cultures were maintained in an incubator (IGO 150, Jouan, Saint‐Herblain Cedes, France) at 37°C, in a humidified atmosphere of 5% CO2/95% air (AirLiquide Medicinal, Valencia, Spain). Treatments were performed for 24 h in complete cell culture medium.
To induce NF‐κB, we used ‘LPS cocktail’ that is composed of Escherichia coli endotoxin LPS (5 μg·mL−1), IFN‐γ (500 U·mL−1) and TNF‐α (25 ng·mL−1).
To analyse details of Lon's up‐regulation, we used the highly selective PERK inhibitor GSK2656157 (1 μM) and the SOD/catalase mimetic MnTMPyP (50 μM), purchased from Santa Cruz Biotechnology (Heidelberg, Germany) and Calbiochem (San Diego, CA, USA) respectively. In both cases, cells were pretreated for 1 h with the corresponding agent and then 24 h treatment was performed without refreshing the medium.
CHOP/DDIT3/GADD153 (CCAAT‐enhancer‐binding protein homologous protein) and LONP1 transient silencing were achieved with siRNA using SignalSilence® unconjugated control siRNA as a control (Cell Signalling, Danvers, MA, USA). Transient transfection was performed using Lipofectamine™ 2000 according to the manufacturer's instructions (ThermoFisher Scientific). siRNA/Lipofectamine complexes were formed in serum‐free OptiMEM using 12.5 μL of Lipofectamine™ 2000 and 50 nM of GADD153 siRNA(h) from Santa Cruz Biotechnology or 10 nM LONP1 siRNA(h) from Ambion® (Thermo Fisher Scientific). Transfections were performed in t‐25 flasks with complete cell culture medium without antibiotics over 24 h (CHOP) or 48 h (LONP1), and then cells were re‐fed with fresh complete medium containing antibiotics. Transfected cells were then treated as indicated above.
Immunoblotting for assessment of protein expression
Western blotting was performed using 50 μg of total cell protein extracts, 20 μg of mitochondria‐enriched extracts or 20 μg of cytosolic extract. Lysates were obtained, quantified and immunoblotted as described elsewhere (Apostolova et al., 2010). Primary antibodies: anti‐CIV subunit II (mouse monoclonal), anti‐FACL4 (rabbit polyclonal) and anti‐phospho‐PERK Thr981 (rabbit polyclonal) used at 1:1000 from ThermoFisher Scientific; anti‐porin at 1:1000, anti‐Lon at 1:1000, anti‐PTPIP51 (FAM82A2) at 1:2000, anti‐Grp75 at 1:500 (all rabbit polyclonal), anti‐ClpX at 1:1000 (rabbit monoclonal), anti‐Mfn2 at 1:1000, anti‐calnexin at 1:1000 (rabbit polyclonal) and anti‐CHOP at 1:1000 (mouse monoclonal) from Abcam, Cambridge, UK; anti‐actin (rabbit polyclonal) and anti‐tubulin (mouse monoclonal) at 1:1000 (Sigma‐Aldrich); anti‐TOM20 at 1:1000 (rabbit polyclonal from Proteintech, Rosemont, IL, USA); rabbit monoclonal anti‐Drp1 and rabbit polyclonal anti‐phospho‐Drp1 (Ser616) at 1:1000 (Cell Signalling, Danvers, MA, USA); anti‐optic atrophy 1 (OPA1), anti‐cytochrome c and anti‐IP3R3 at 1:1000 (mouse monoclonal antibodies from BD Biosciences, Franklin Lakes, NJ, USA); anti‐LDH and anti‐VAP B/C (rabbit polyclonal antibodies at 1:1000 from Santa Cruz, Dallas, TX, USA). Secondary antibodies: peroxidase‐labelled anti‐mouse at 1:2000 (ThermoFisher Scientific) and anti‐rabbit IgG at 1:5000 (Vector laboratories, Burlingame, CA, USA). Inmunolabelling was detected using the chemiluminescent substrate Luminata™ Crescendo or Forte (Merck Millipore, Billerica, MA, USA) and was visualized with a digital luminescent image analyser (FUJIFILM LAS 3000, Fujifilm). Multi Gauge software version 3.0. was used for densitometric analysis.
Co‐immunoprecipitation
Whole‐cell protein extracts were obtained using t‐150 flask cell cultures, as described elsewhere (Apostolova et al., 2010). For immunoprecipitation, 1 mg or 200 μg of protein was incubated overnight with polyclonal antibody against PTPIP51 (FAM82A2) (Abcam, Cambridge, UK) or porin (Proteintech), respectively, under agitation at 4°C. After being bound to protein A‐Sepharose CL‐4B beads (GE Healthcare, Buckinghamshire, UK) (4 h, 4°C under agitation), immunoprecipitates were washed three times with protein extraction buffer. In order to denature the protein and separate it from the protein‐A beads, Laemmli buffer 2X was added and boiled (99°C, 5 min). Finally, samples were centrifuged, and supernatants were analysed by immunoblotting to study VAP B/C‐PTPIP51 and Grp75‐porin interactions, for which VAP B/C and Grp75 were detected by immunoblotting for assessment of protein expression.
Confocal fluorescence microscopy
Treatment was performed in multi‐well coverslips (ThermoFisher Scientific), and where necessary, cells were incubated with 0.5 μM MitoView™ 633 (Biotium, Hayward, CA, USA) in the last 30 min of treatment. Then, cells were fixed with 4% formaldehyde (15 min, RT), blocked (60 min, RT) and incubated (overnight, 4°C) with primary antibodies: anti‐phospho‐Drp1 at 1:200 (Cell Signalling), anti‐TOM20 at 1:250 to identify mitochondria (BD Biosciences, NJ, USA), anti‐calnexin at 1:750 to identify ER (ThermoFisher Scientific) or anti‐Lon at 1:50 (Proteintech). Samples were washed and incubated with secondary antibodies (goat anti‐rabbit Alexa Fluor 488 or goat anti‐mouse Alexa Fluor 594 from ThermoFisher Scientific, 1 h, RT), and 5 μM of the fluorochrome Hoechst 33342 (Sigma‐Aldrich) was added for the last 30 min (to mark nuclei).
After the samples had been washed with PBS, images were acquired with a Leica TCS‐SP2 confocal laser scanning unit with argon and helium‐neon laser beams and attached to a Leica DMIRBE inverted microscope. Images were captured at 63× magnification with a HCX PL APO 40.0 x 1.32 oil UV objective. Colocalization analysis was performed with the programme Image J. Technical replicates – duplicates were employed to ensure the reliability of single values.
Fluorescence microscopy and static cytometry of live cells
All treatments were performed in 24‐well plates, and then, after a washing step (HBSS), 16–30 images per well were recorded with a fluorescence microscope (IX81, Olympus, Hamburg, Germany) coupled to static cytometry software ‘ScanR’ version 2.03.2 (Olympus). Technical replicates – duplicates were employed to ensure the reliability of single values. In order to assess mitochondrial function, specifically ΔΨm, superoxide production and mitochondrial mass, the fluorochromes 5 μM TMRM, 2.5 μM MitoSOX (both from Molecular Probes, Invitrogen) or 1 μM NAO (10‐N‐nonyl acridine orange, Sigma‐Aldrich) were added for the last 30 min of treatment. Nuclei were stained with the fluorochrome Hoechst 33342 (2.5 μM, Sigma‐Aldrich), also added for the last 30 min of the treatment, and this signal was employed to count nuclei and assess the viability/proliferation of cells (Polo et al., 2015).
Chromatin immunoprecipitation (ChIP) assay
In order to stabilize protein‐DNA complexes, treated cell cultures (t‐25 flasks) were cross‐linked with 1% formaldehyde (RT, 10 min) and incubated with 0.125 M glycine (RT, 2 min). Subsequently, cells were washed three times and collected with ice‐cold PBS and then centrifuged (4°C, 5 min, 500 g). Pellets were then resuspended in 0.3 mL of SDS sonication buffer [1% SDS, 5 mM EDTA, 50 mM Tris–HCl pH 8.0 and protease inhibitor cocktail (Roche Diagnostics GmbH, Mannheim, Germany)] and sonicated three times for 20 s (40 s in between) at 16 000× g (Branson Digital Sonifier, Emerson Electric Co., MO, USA). After centrifugation at maximum speed for 10 min at 4°C, supernatants (Chip extracts) were collected and immunoprecipitation was performed overnight at 4°C with anti‐NF‐κB antibody or with control IgG antibody (secondary antibody for anti‐NF‐κB) (both from ThermoFisher Scientific). Supernatants were then incubated with 60 μL protein A‐Sepharose CL‐4B beads (GE Healthcare) overnight at 4°C. Finally, precipitates were washed sequentially for 5 min; once with low‐salt wash buffer (1% Triton X‐100, 2 mM EDTA, 20 mM Tris–HCl pH 8.0, 150 mM NaCl), twice with high‐salt wash buffer (1% Triton X‐100, 2 mM EDTA, 20 mM Tris–HCl pH 8.0, 500 mM NaCl) and once with LiCl wash buffer (0.25 mM LiCl, 1% NP‐40, 0.1% Tween 20, 1 mM EDTA, 10 mM Tris–HCl pH 8.0), 5 min each. Precipitates were then washed twice with TE buffer (10 mM Tris–HCl pH 8.0, 1 mM EDTA) and extracted twice with elution buffer (1% SDS, 0.1 M NaHCO3). To reverse the formaldehyde cross‐linking, eluates were pooled and heated at 65°C for 16 h in the presence of 0.25 M NaCl. DNA fragments were purified with a PureLink™ Quick PCR purification kit (ThermoFisher Scientific), and DNA content was quantified using a NanoDrop® ND‐1000 spectrophotometer (NanoDrop Technologies, Wilmington, DE, USA). The same amount of DNA of all the samples was used to perform semiquantitative PCR for which we employed TaKaRa Taq™ (Takara Bio, Kusatsu, Japan) with the following primers: 5′‐CCACCAGCATCAACATCAG‐3′ and 5′‐CGCATGCTCAAGATTCAGG‐3′, detecting the region −121 to −307 in LONP1 promoter. PCR of 40 cycles was performed using GeneAmp PCR System 2400 (Perkin Elmer, Waltham, MA, USA), and the PCR products obtained were separated by electrophoresis in 2% agarose gel.
Isolation of mitochondria‐associated membranes (MAMs)
Subcellular fractioning – including MAMs isolation – was performed using cell pellets obtained from 12–14 confluent t‐150 flasks per condition (untreated cells and cells treated for 24 h with efavirenz 25 μM, thapsigargin 2 μM and CCCP 10 μM). Isolation was performed as described by Wieckowski et al. (2009). In brief, cells were homogenized using a Teflon pestle at 4°C, and serial centrifugations (all at 4°C) were performed to separate cytosolic, ER and mitochondrial fractions. In order to purify MAMs, crude mitochondria were fractionated in Percoll medium by centrifugation at 95 000 g for 30 min at 4°C in a Beckman Coulter Optima L‐100 XP Ultracentrifuge with a SW40 rotor (Beckman, Fullerton, CA, USA). Finally, the obtained subcellular protein fractions (0.5–6 μg·μL−1) were analysed by Western blots (see above).
Quantitative RT‐PCR
Real‐time RT‐PCR (in duplicate, to ensure the reliability of single measurements), of at least three independent experiments (n = 3), were performed using mRNA of t‐25 flask cell cultures treated with vehicles (Methanol or DMSO), efavirenz (10, 25 and 50 μM), thapsigargin (2 μM), rotenone (25 μM) and CCCP 10 μM. Total RNA was extracted (RNeasy Mini Kit, Qiagen, Hilden, Germany), eluted in 30 μL of water and quantified (NanoDrop® ND‐1000 spectrophotometer). cDNA was synthesized (SuperScript™ III Reverse Transcriptase, ThermoFisher Scientific) with 1 μg of total RNA in a final volume of 20 μL. PCR reactions (Carousel‐based LightCycler® 2.0 Real‐Time PCR System, Roche Applied Biosystems) were performed mixing 1 μL of cDNA with LightCycler® FastStart DNA MasterPLUS SYBR Green I master mix (Roche Applied Science). Primers: LONP1(s) ATGGAGGACGTCAAGAAACG, LONP1(as) GATCTCAGCCACGTCAGTCA; MFN1(s) ACCGAGGAGGTGGCAAACAAAG, MFN1(as) GCTGGGTCTGAAGCACTAAGGC; MFN2(s) GGTGCTCAACGCCAGGATTCAG, MFN2(as) TGCCGCTCTTCACGCATTTCC; OPA1(s) GGCATGGCTCCTGACACAAAGG, OPA1(as) GCTGAATCCTGCTTGGACTGGC; FIS1(s) AAGGGAGCAAGGAGGAACAGCG, FIS1(as) ACAGCAAGTCCGATGAGTCCGG; DRP1(s) GACTTTGCTGATGCTTGTGGGC, DRP1(as) CTCTCCAGTTGCCTGTGGTTGG and ACTB(s) GGACTTCGAGCAAGAGATGG, ACTB(as) AGCACTGTGTTGGCGTACAG employed as a housekeeping gene (TIB MOLBIOL, Berlin, Germany). All were used at 1 μM and were added to a 10 μL final reaction volume. The reaction was as follows: 30 s‐95°C; 5 s‐95°C, 20 s‐60°C (45 cycles); 15 s‐65°C and 30 s‐40°C.
Presentation of data and statistical analysis
Data were analysed with GraphPad Prism v.3 software (GraphPad Prism Software, La Jolla, CA, USA). For the comparison between efavirenz treatments and their vehicle (methanol), on the one hand, and the three pharmacological stressors (thapsigargin, rotenone and CCCP) and their vehicle (DMSO), on the other hand, one‐way ANOVA was used with Dunnett's multiple comparison test. In most cases, data are presented as % of control, the negative control (untreated cells) being considered 100%. Such normalization was performed in order to remove any unwanted sources of variation. All values are expressed as a mean ± SEM, The ‘n’ number in the figure legends, which denotes the number of biological replicates (independent repetitions) used for statistical analysis, was at least 5. Statistical significance was considered versus vehicle: methanol in the case of efavirenz (*P < 0.05) and DMSO in the case of rilpivirine, TG, rotenone and CCCP (# P < 0.05). Technical replicates in a run (at least in duplicate) were averaged and yielded a value for a biological replicate.
The study was performed in vitro using cell lines, and all the samples were analysed/quantified objectively, without randomization of samples or blinding of the operator due to technical limitations and a large number of assays. The data and statistical analyses comply with the recommendations on experimental design and analysis in pharmacology (Curtis et al., 2015).
Reagents and drugs
Unless stated otherwise, general chemical reagents were purchased from Sigma‐Aldrich (Steinheim, Germany). Efavirenz (Sequoia Research Products, Pangbourne, UK) was employed as the reference drug (in methanol, 3 mg·mL−1) at clinically relevant plasma concentrations (10, 25 and 50 μM), which were chosen taking into account the great inter‐individual varibility in the pharmacokinetics of this drug (Burger et al., 2006; Carr et al., 2010; Gounden et al., 2010). Rilpivirine (RPV, Sequoia Research Products) was dissolved in DMSO (1 mM) and employed at clinically relevant plasma concentrations (0.25, 0.5 and 1 μM).
Nomenclature of targets and ligands
Key protein targets and ligands in this article are hyperlinked to corresponding entries in http://www.guidetopharmacology.org, the common portal for data from the IUPHAR/BPS Guide to PHARMACOLOGY (Southan et al., 2016), and are permanently archived in the Concise Guide to PHARMACOLOGY 2015/16 (Alexander et al., 2015a,b,c).
Results
Mitochondrial dynamics are altered differently in cells presenting dual mitochondrial/ER stress
Firstly, we analysed the gene and protein expression of several markers of mitochondrial dynamics in cells treated with efavirenz, thapsigargin or two mitochondrial stressors for 24 h. As shown in Figure 1A, immunoblot analysis using whole‐cell extracts revealed no changes in the level of total Drp1 under any of the conditions assayed, whereas the effect in the case of p‐Drp1 (Ser616) was different. Moderate mitochondrial/ER stress, such as that triggered by efavirenz 10 and 25 μM, increased p‐Drp1 levels, an increase that was not observed with severe stress (efavirenz 50 μM). In sharp contrast, a decrease in p‐Drp1 expression was detected in cells exposed to thapsigargin, rotenone or CCCP. Complex I inhibitor rotenone (25 μM) is a widely used pharmacological inhibitor of mitochondrial respiration and, like efavirenz, inhibits complex I of the ETC, leading to a drop in ΔΨm and an enhancement of mitochondrial superoxide production (Li et al., 2003). The protonophore carbonyl cyanide m‐chloro phenyl hydrazone CCCP (10 μM) is a potent chemical uncoupler of oxidative phosphorylation, which, unlike efavirenz or rotenone, stimulates mitochondrial respiration while dissipating ΔΨm. ER stress was modelled with the widely utilized sesquiterpene alkaloid thapsigargin (2 μM), a highly selective inhibitor of sarcoplasmic/ER Ca2+ ATPase (SERCA). Through the inhibition of SERCA, thapsigargin prevents Ca2+ transport into the ER lumen, which leads to its subsequent increase in the cytosol (Lytton et al., 1991), thus promoting accumulation of unfolded proteins and perturbation of intracellular Ca2+ homeostasis, an effect with a huge impact on mitochondrial functioning.
Figure 1.
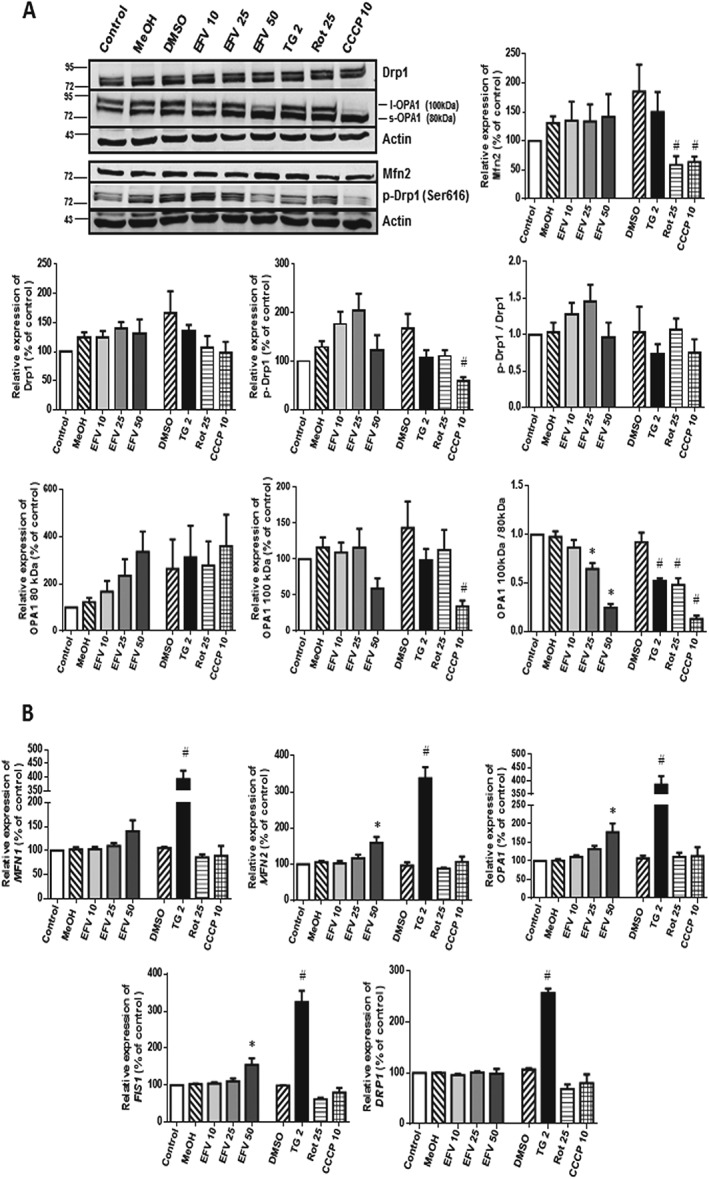
Expression of the main molecular mediators of mitochondrial dynamics. Cells were treated for 24 h with increasing concentrations of efavirenz (EFV), vehicles (MeOH or DMSO), thapsigargin (TG) 2 μM, rotenone (Rot) 25 μM or CCCP 10 μM. (A) Immunoblot analysis showing representative Western blotting image and histograms expressing quantification of the main regulators of mitochondrial fusion and fission. Data (mean ± SEM, n = 6 for OPA1; n = 5 for Drp1 y p‐Drp1; n = 8 for Mfn2) are expressed as % of control, the negative control (untreated cells) being considered 100%. (B) Gene expression analysed by quantitative RT‐PCR. Data (mean ± SEM, n = 5) are expressed as mRNA content in relation to that of control (untreated cells, considered 100%) after normalization with the expression of the housekeeping gene ACTB (β‐actin). Statistical analysis was performed by one‐way ANOVA (* P < 0.05 for efavirenz vs. MeOH and # P < 0.05 for thapsigargin, rotenone or CCCP vs. DMSO).
Regarding OPA1, an increase in the expression of its 80 kDa (s‐OPA1) form was recorded with all stimuli (including efavirenz), which occurred in a concentration‐dependent manner. Unlike this effect, the expression of 100 kDa OPA1 (l‐OPA1) showed no alterations with thapsigargin or rotenone and the moderate concentrations of efavirenz (10 and 25 μM), while a marked down‐regulation was observed with treatment with efavirenz 50 or CCCP. Finally, the expression of Mfn2 was severely diminished with rotenone and CCCP treatment, while no significant changes were recorded with either thapsigargin or efavirenz. Importantly, quantitative RT‐PCR analysis showed that ER‐stress (thapsigargin treatment) is related to a major increase in the expression of several genes employed as markers of dynamics – MFN1, MFN2, OPA1, FIS1 and DRP1 (Figure 1B). With the exception of DRP1, the expression of these genes was also enhanced with efavirenz in a concentration‐dependent fashion, whereas the classical mitochondrial stressors rotenone and CCCP not only failed to trigger up‐regulation (MFN2, OPA1) but actually provoked the contrary effect (MFN1, FIS1 and DRP1). Considered together, these data provide evidence of a different expression of mitochondrial fusion and fission markers under conditions of ER stress and/or different types of mitochondrial dysfunction.
Altered mitochondrial morphology was also confirmed with confocal fluorescent microscopy using the expression of the OMM protein TOM20 as a marker. Enhanced presence of ‘fragmented’ mitochondria (small rod‐like or spherical mitochondria) was observed in all treatments (Figure 2C), an effect indicative of increased fission relative to fusion. This result is in accordance with our previously published data in the same model, where mitochondria were visualized using NAO fluorescence (Polo et al., 2015).
Figure 2.
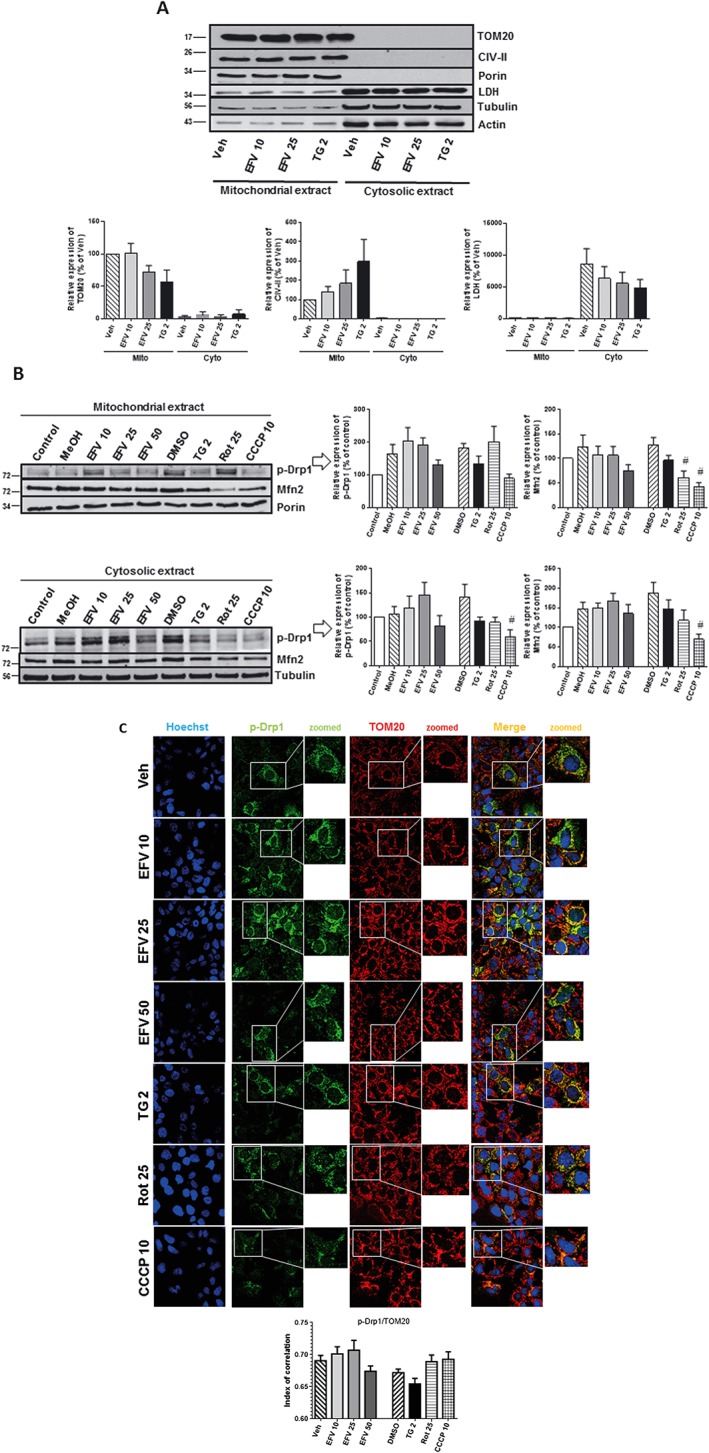
Subcellular protein expression p‐Drp1 and Mfn2. (A) Analysis of the purity of mitochondria‐enriched and cytosolic protein extracts. Representative Western blotting image and histograms expressing quantification of several mitochondrial (TOM20, CIV‐II and porin) and cytosolic (LDH, tubulin and β‐actin) proteins after 24 h of treatment. Data (mean ± SEM, n = 6) are expressed as % of control in the mitochondrial fraction, untreated cells considered 100%. (B) Western blotting analysis of p‐Drp1 and Mfn2 in mitochondrial and cytosolic extracts in cells treated for 24 h with increasing concentrations of efavirenz (EFV), vehicles (MeOH and DMSO), thapsigargin (TG) 2 μM, rotenone (Rot) 25 μM or CCCP 10 μM. A representative image and histograms of the quantified data are shown. Data (mean ± SEM, n = 6) are expressed as % of control, untreated cells considered 100%. (C) Translocation of p‐Drp1 to mitochondria. Cells were treated for 24 h with increasing concentrations of efavirenz, vehicle, thapsigargin 2 μM, rotenone 25 μM or CCCP 10 μM. Representative confocal microscopic images (63×) of cells labelled with Hoechst 33342 (nuclei), anti‐p‐Drp1 (Ser616) and anti‐TOM20 (mitochondria). Histogram showing the index of correlation between p‐Drp1 and mitochondria (mean ± SEM, n = 5). Statistical analysis was performed by one‐way ANOVA (# P < 0.05 for rotenone or CCCP vs. DMSO).
MAM – evidence for different effect during dual mitochondrial/ER stress
Several proteins involved in mitochondrial dynamics have been shown to be associated with MAMs, including p‐Drp1 and Mfn2. In this regard, we determined their specific location by studying their presence in mitochondria‐enriched and cytosolic protein extracts. Firstly, we confirmed the purity of these extracts by assessment of several mitochondrial (TOM20, CIV‐II and porin) and cytosolic (LDH, tubulin and β‐actin) proteins under basal conditions and after 24 h treatments (Figure 2A). We then analysed the abundance of specific proteins related to mitochondrial dynamics. Intriguingly, cells under combined mitochondrial/ER stress tended to exhibit a slightly increased expression of p‐Drp1 and Mfn2 in the cytosolic fraction although the effect was not concentration‐dependent as it was not produced by the highest concentration of efavirenz (50 μM). This quite high concentration of efavirenz severely damages mitochondria, and the effects induced can be beyond the cellular adaptive response. In contrast, a clear decrease was seen in cells treated with classic mitochondrial (rotenone and CCCP) or ER stressors (thapsigargin) (Figure 2B). We considered that a possible explanation for the observed response was that efavirenz triggered de novo synthesis of these proteins and the time frame of 24 h may not have been ample enough to have the protein inside mitochondria. However, this possibility was ruled out when analysis of the expression of p‐Drp1 after prolonged treatment (48 h) revealed that a different response continued to be present (Supporting Information Figure S1). Of note, the level of cell stress was crucial for this response; the highest concentration of efavirenz, which triggered severe mitochondrial damage, failed to produce the same effects as efavirenz 10 and 25 μM and exerted similar actions to those of the rest of the stimuli.
The different effect exerted by efavirenz in comparison with the rest of the stimuli was also confirmed by confocal microscopy experiments; there was an increase in the colocalization of p‐Drp1 with the mitochondrial protein TOM20 in 10 or 25 μM efavirenz‐treated cells, which was absent with the rest of the treatments (Figure 2C).
Furthermore, we performed co‐immunoprecipitation experiments to analyse the contact between specific MAM protein partners. To do this, we assessed two protein pairs: (i) PTPIP51 and VAP B/C; and (ii) porin and Grp75. In both cases, the contact was enhanced in efavirenz‐treated cells, while no increase or a significant decrease was observed with the rest of the treatments (Figure 3A, B). We also assessed the general expression of these proteins in whole‐cell extracts. Interestingly, the mitochondrial protein PTPIP51 displayed a major enhancement in efavirenz‐exposed cells (Figure 3C), an effect that was not evident with the rest of the stressors. In summary, these data reveal an enhancement of MAMs in cells exposed to combined ER stress/mitochondrial dysfunction.
Figure 3.
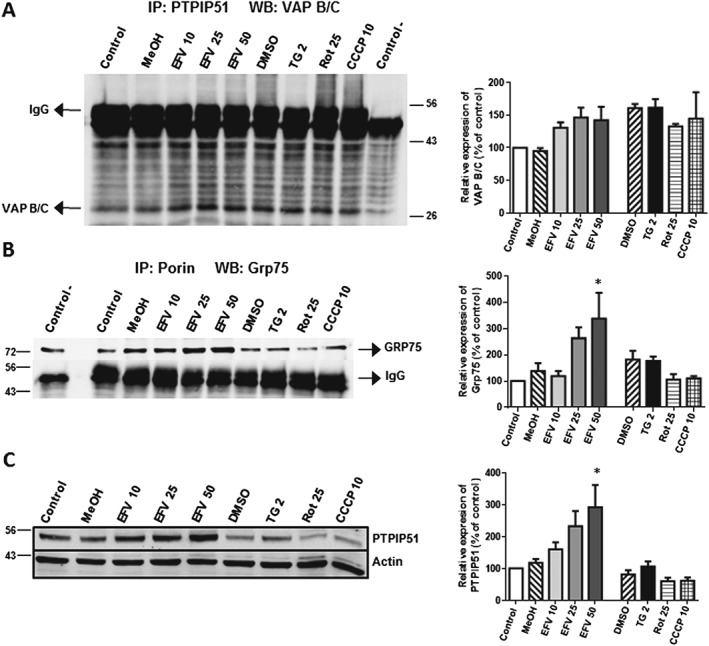
Study of MAMs. Cells were treated for 24 h with increasing concentrations of efavirenz (EFV), vehicles (MeOH or DMSO), thapsigargin (TG) 2 μM, rotenone (Rot) 25 μM or CCCP 10 μM. (A, B) Analysis of contact between specific MAM protein partners by co‐immunoprecipitation using protein A sepharose beads. Representative Western blotting images and histograms expressing quantification of (A) VAP B/C after immunoprecipitation of PTPIP51 and (B) Grp75 after immunoprecipitation of porin. A negative control (without primary antibody) was used as a control for the immunoprecipitation. (C) Western blotting analysis of PTPIP51 expression in whole‐cell extracts. Data (mean ± SEM, n = 5) are expressed as % of control (untreated cells, considered 100%). Statistical analysis was performed by one‐way ANOVA (*P < 0.05 for efavirenz vs. MeOH).
Lon: up‐regulation and extramitochondrial location under mitochondrial/ER stress
Next, we compared the different effects observed between the expression of several MAM proteins with those exerted by another MAM participant, Grp75 (mitochondrial HSP70), which is not directly related to mitochondrial dynamics. In this case, efavirenz treatment showed a similar pattern to that observed for p‐Drp1 and Mfn2, with increased cytosolic content and a tendency towards a drop in mitochondrial content. In contrast, upon treatment with the other three stimuli, levels of Grp75 inside mitochondria did not diminish (Figure 4A).
Figure 4.
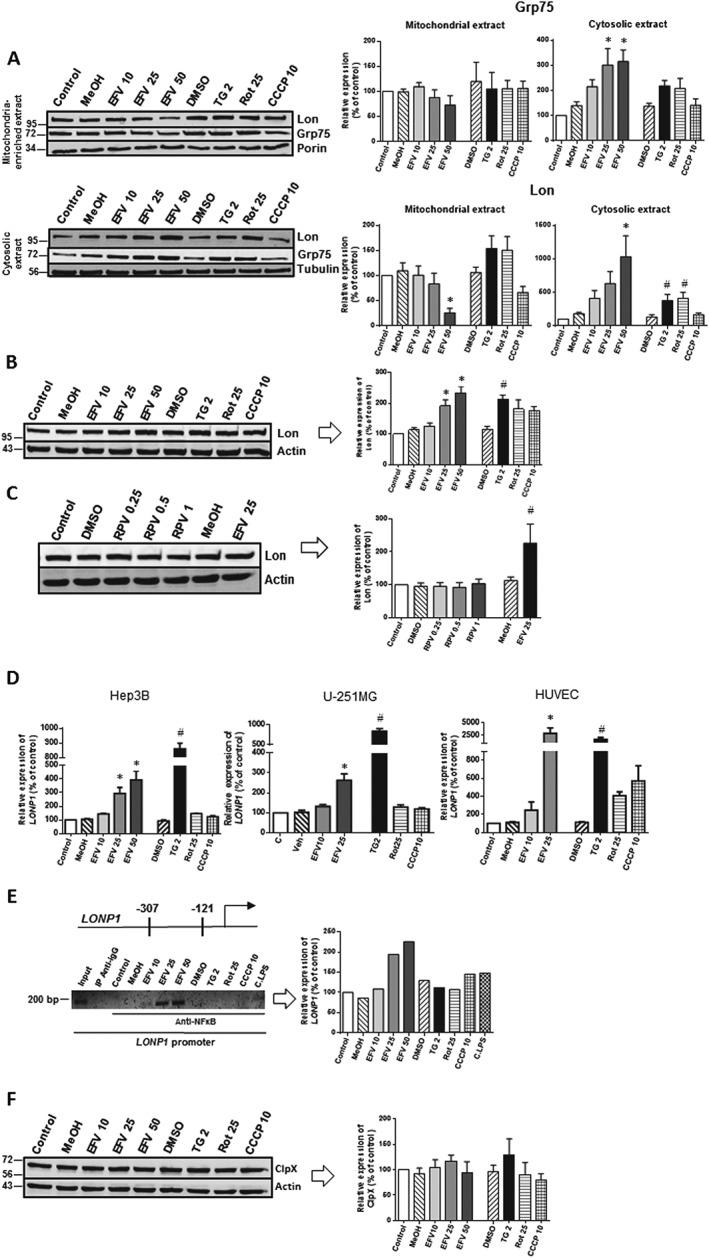
Analysis of the expression of Lon. Cells were treated for 24 h with increasing concentrations of efavirenz (EFV), vehicles (MeOH or DMSO), thapsigargin (TG) 2 μM, rotenone (Rot) 25 μM or CCCP 10 μM except for (C). (A) Representative Western blotting images and histograms expressing quantification of Grp75 and Lon in mitochondria‐enriched and cytosolic protein extracts (mean ± SEM, n = 6). (B) Western blotting analysis of Lon expression in whole‐cell protein extracts (mean ± SEM, n = 6). (C) Western blotting analysis of Lon expression in whole‐cell protein extracts obtained from Hep3B cells after 24 h treatment with rilpivirine (RPV; mean ± SEM, n = 5). (D) Quantitative RT‐PCR analysis (mean ± SEM) of LONP1 in Hep3B (n = 6 except for MeOH, rotenone and thapsigargin n = 7), U‐251MG (n = 6 except for efavirenz 10 n = 5, efavirenz 25 and thapsigargin n = 7) and HUVEC (n = 6). (E) Analysis of the recruitment of NF‐κB to the promoter of LONP1. Representative image of semiquantitative PCR after ChIP with anti‐NF‐κB; a non‐related antibody anti‐IgG and a sample of the input chromatin were used as controls. Aside from the aforementioned stimuli, cells were also treated with a pro‐inflammatory stimulus a cocktail of LPS, IFN‐γ and TNF‐α (C.LPS), a known activator of NF‐κB, which was employed as an additional control condition. (F) Study of ClpX expression by immunoblot in total cell extracts showing a representative image and a histogram of the quantified data (mean ± SEM, n = 6). Results are expressed as % of control (untreated cells considered 100%). Statistical analysis was performed by one‐way ANOVA (*P < 0.05 for efavirenz vs. MeOH and # P < 0.05 for thapsigargin, rotenone or CCCP vs. DMSO).
Knowing that Grp75 is involved in mitochondrial proteostasis, we were interested to know whether a similar effect would be observed with another mitochondrial protein involved in protein maintenance in this organelle, namely, the protease Lon. Also, Lon and Grp75 seem to be closely linked as the Hsp60‐Grp75 complex is part of the Lon interactome and the maintenance of the stability this complex by Lon's chaperone function is crucial for cell survival (Kao et al., 2015). As shown in Figure 4A, the analysis of Lon expression in cytosolic versus mitochondria‐enriched fractions of efavirenz‐treated cells revealed a very similar result to that exerted by Grp75: a decrease in the mitochondrial fraction and an increase in the extramitochondrial fraction. Once again, this was not the case with the rest of the stimuli. As mentioned previously, in Hep3B cells, efavirenz leads to a concentration‐dependent increase in Lon protein expression in whole‐cell extracts (Polo et al., 2015). A similar increase was also detected in HepaRG cells (Polo et al., 2015), a terminally differentiated hepatic cell line derived from human hepatic progenitor cells, which rules out the possibility of the effect being related to the cancerous nature of Hep3B and confirms that Hep3B cells are reliable cellular model for this research. In the present study, we compared this effect with that exerted by thapsigargin, rotenone or CCCP and found a similar up‐regulation (Figure 4B). In order to assess the drug‐specificity of this effect, we analysed the protein expression of Lon after treatment with a range of clinically relevant plasma concentrations of rilpivirine, another antiretroviral drug, which as efavirenz belongs to the family of non‐nucleoside analogues reverse transcriptase inhibitors. As shown in Figure 4C, rilpivirine did not alter the expression of Lon. Moreover, we assessed the gene expression of LONP1 and observed that all four stimuli – efavirenz, thapsigargin, rotenone and CCCP – produced an increase in LONP1 mRNA, although to varying extents: while the increase in the case of rotenone and CCCP was modest, that induced by thapsigargin was notable (Figure 4D). A similar result was obtained when we treated the other two cell lines, namely, U‐251MG, a cancerous cell line, and HUVECs, primary cell line (Figure 4D), which indicates a general and not cell type‐specific response. Also, we observed that Lon mRNA and protein levels did not fully correlate, an effect often reported in mammalian cells, resulting from extensive effects on mRNA and protein content at different levels, particularly observed in cells subjected to protein misfolding stress (Cheng et al., 2016).
The mechanisms involved in Lon up‐regulation: evidence for the significance of dual mitochondrial/ER stress
In order to assess the mechanism involved in the up‐regulation of Lon, we transiently silenced the transcription factor CHOP and examined the protein level of Lon in whole‐cell extracts by Western blotting. We confirmed the expected increase in CHOP induced by efavirenz, rotenone and thapsigargin (in accordance with our previously published work) and found that siCHOP‐treated cells exhibited similar Lon levels as siControl cells, which would suggest that this transcription factor is not involved in the regulation of Lon expression (Supporting Information Figure S2). Another transcription factor that we speculated could be involved in LONP1 up‐regulation in our model is NF‐κB. In order to test this possibility, we performed a ChiP assay, a technique used for probing protein‐DNA interactions within the natural chromatin context of the cell. These experiments revealed that efavirenz treatment concentration‐dependently increased the contact between NF‐κB and the promoter of LONP1 (Figure 4E). While LONP1 expression was regulated by NF‐κB upon efavirenz treatment, we did not observe this transcriptional effect in thapsigargin‐treated cells, a finding which may point to an alternative transcription factor involved under classical ER stress (thapsigargin) probably signalled by one or several of the UPR signal transduction arms. One possibility is NRF2, which is regulated via the PERK‐ATF4 branch and is among the major transcriptional regulators of LONP1. Moreover, the specificity of Lon expression was demonstrated by the finding that neither of the treatments altered the expression of ClpX, another ATP‐dependent MM protease (Figure 4F).
To further delve into the mechanism by which Lon is up‐regulated, we assessed the activation of PERK, one of the master regulators of the UPR in mammalian cells. During conditions of ER stress, PERK undergoes autophosphorylation of its kinase domain, which increases its activity. Twenty‐four hours of treatment with efavirenz led to a slight increase in the presence of p‐PERK studied by Western blotting (Figure 5A), which was visible with efavirenz 10 and 25 μM but not efavirenz 50 μM. A similar increasing effect was observed with CCCP while thapsigargin led to a significant decrease in the protein content of p‐PERK. However, pharmacological inhibition of PERK phosphorylation achieved with the selective inhibitor GSK2656157 had only a minor effect on efavirenz‐induced Lon protein expression as observed with efavirenz 10 and 25 μM (Figure 5A). The lack of a major regulatory effect of p‐PERK was confirmed by RT‐PCR analysis of LONP1 in cells exposed to efavirenz in the presence of p‐PERK inhibitor (Figure 5B).
Figure 5.
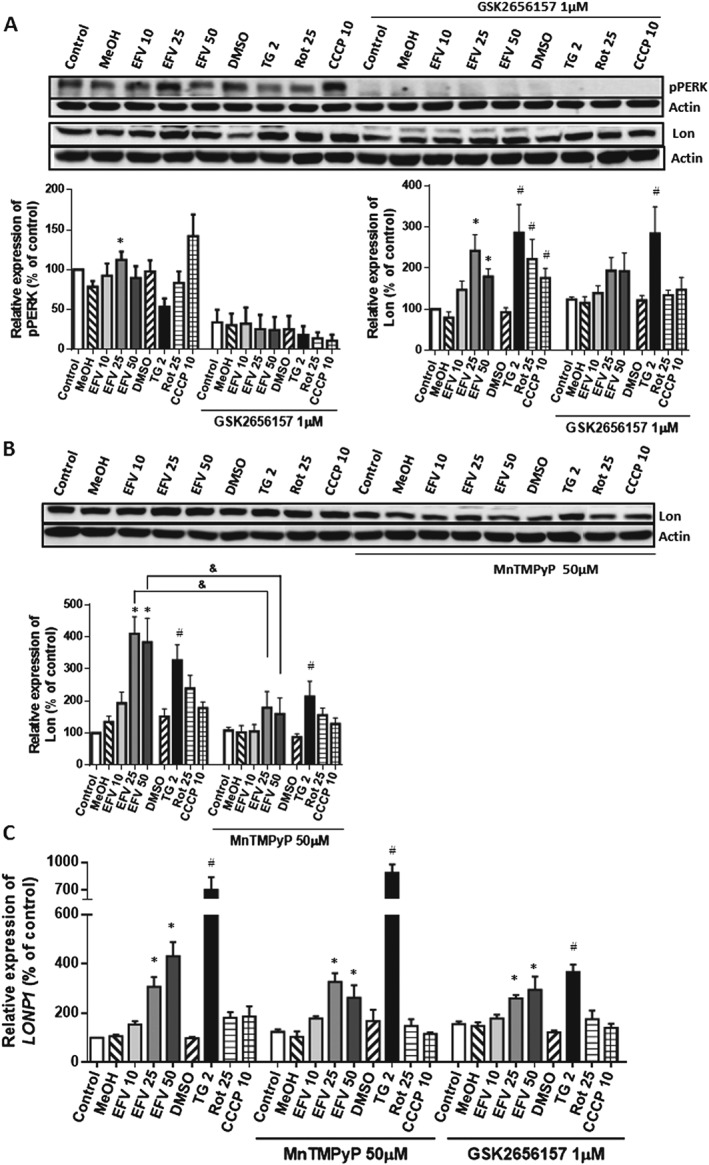
Analysis of the regulation of the expression of Lon. Cells were pretreated with the pPERK‐inhibitor GSK2656157 or the catalase/SOD mimetic MnTMPyP for 1 h and then treated for 24 h with increasing concentrations of efavirenz (EFV), vehicle, thapsigargin (TG) 2 μM, rotenone (Rot) 25 μM or CCCP 10 μM. (A) and (B) Western blotting analysis of PERK phosphorylation and Lon expression in whole‐cell extracts. Representative immunoblots and histograms of the quantified data are shown. (C) Quantitative RT‐PCR analysis of LONP1. Results (mean ± SEM) are expressed as % of control (untreated cells considered 100%); (A) left panel n = 7 for cells without pretreatment and n = 5 for pretreated cells; (B) n = 5 and (C) n = 9 for cells without pretreatment and n = 5 for pretreated cells. Statistical analysis was performed by one‐way ANOVA (*P < 0.05 for efavirenz vs. MeOH and # P < 0.05 for thapsigargin or rotenone vs. DMSO and & P < 0.05 for cells with vs. those without pretreatment).
It is widely known that LONP1's transcription is promoted in conditions of oxidative stress. Given that efavirenz increments mitochondrial superoxide production in this model (Apostolova et al., 2010; Polo et al., 2015), we sought to explore the participation of oxidative species in Lon up‐regulation. For this, 24 h treatments were performed in the presence of MnTMPyP, a metalloporphyrin‐based SOD/catalase mimetic. Both protein (Figure 5A) and mRNA expression (Figure 5B) analysis revealed that oxygen radicals participate in efavirenz‐induced Lon up‐regulation.
Implications of the increase in Lon: protection against oxidative stress
Having observed that Lon was up‐regulated in cells exposed to efavirenz, we wished to assess the role of this increase in the cellular effect of the drug. To this end, efavirenz treatment was performed in cells where LONP1 was transiently silenced (Figure 6A) and compared to that performed in siControl cells. As mentioned previously, 24 h exposure to efavirenz compromises cell viability and alters mitochondrial function (increased mitochondrial mass, enhanced ROS generation and diminished ΔΨm). As depicted in Figure 6B, while Lon does not seem to influence the effect of efavirenz on cell viability (assessed as number of nuclei), mitochondrial mass (NAO fluorescence) and ΔΨm (TMRM fluorescence), we observed that siLONP1 cells displayed a higher level of efavirenz‐induced mitochondrial superoxide production (MitoSox fluorescence).
Figure 6.
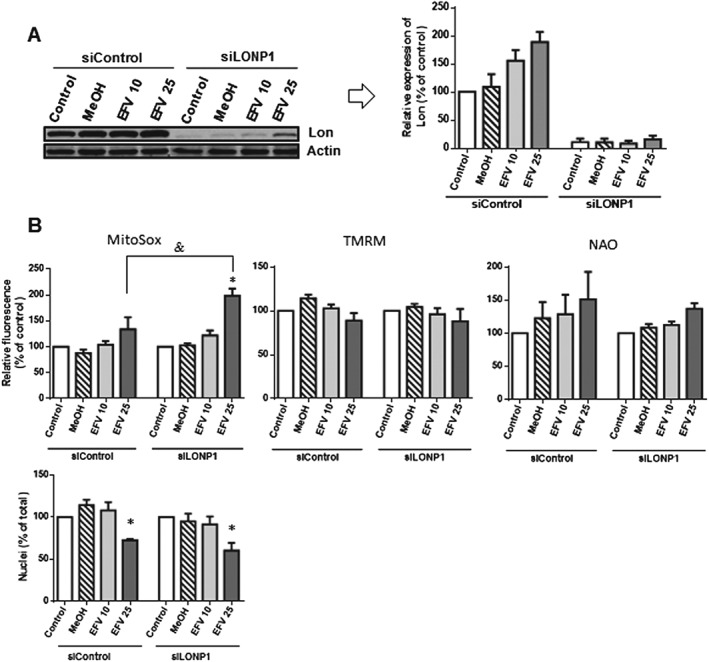
Analysis of the participation of Lon in the effect of efavirenz. Cells were transfected with siRNA Control or siLONP1 and treated for 24 h with efavirenz (EFV) or vehicle (MeOH). (A) Representative Western blotting image and histogram expressing quantification of Lon expression. (B) Histograms showing mean MitoSox (mitochondrial superoxide production), TMRM (mitochondrial membrane potential) and NAO fluorescence (mitochondrial mass – upper panel) and number of nuclei (visualized with Hoechst fluorescence) – lower panel. Data [mean ± SEM, n = 5 in (A) and in (B)‐upper panel, and n = 9 in (B)‐lower panel] are expressed as % of control (considered 100%). Statistical analysis was performed by one‐way ANOVA (*P < 0.05 for efavirenz vs. MeOH).
Lon is associated with the ER/MAMs in dual mitochondrial/ER stress
Having observed that the expression of Lon in the extramitochondrial fraction increases following efavirenz treatment, we sought to analyse its intracellular location. To do this, we performed double‐staining immunocytochemistry experiments by confocal fluorescence microscopy using the chaperone calnexin as a protein marker for ER. Colocalization analysis revealed an increased overlapping between the Lon signal and the ER in cells exposed to efavirenz, while no changes were observed with the rest of the stimuli (Figure 7A). In view of this finding and the results we obtained previously by immunoblot experiments (Figure 4A), we decided to use the same approach of confocal microscopy to assess mitochondrial Lon localization by studying its association with the mitochondrial matrix signal coming from the fluorochrome MitoView, which accumulates in the matrix of polarized mitochondria. As depicted in Figure 7B, efavirenz leads to a decrease in Lon's presence in the mitochondrial matrix.
Figure 7.
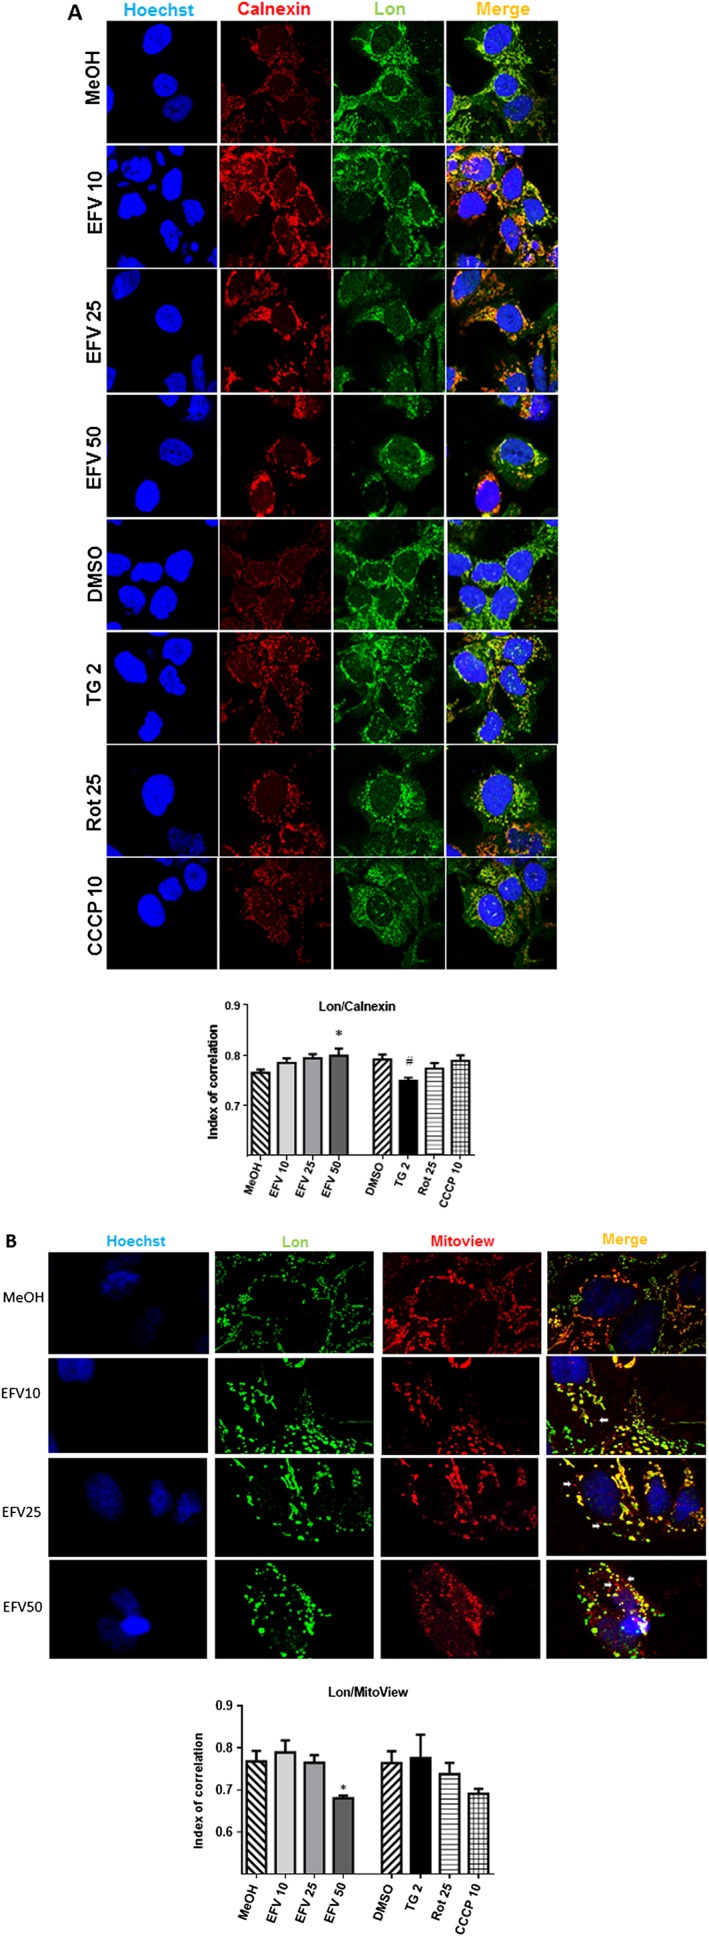
Analysis of the presence of Lon in the ER and mitochondria by confocal microscopy. Cells were treated for 24 h with increasing concentrations of efavirenz EFV), vehicle, thapsigargin (TG) 2 μM, rotenone (Rot) 25 μM or CCCP 10 μM and stained with (A) Hoechst 33342 (nuclei), anti‐calnexin (ER) antibody and anti‐Lon antibody or (B) Hoechst 33342 (nuclei), anti‐Lon antibody and Mitoview (MM fluorescent marker). Representative confocal microscopy images of 63× maginification with 3× optical zoom (A) or 3× optical + 1.5× digital zoom (B), and a histogram showing the index of correlation between Lon and ER (A) and Lon and mitochondria (B). White arrows show mitochondria that do not overlap with Lon. Data are shown as mean ± SEM, n = 5. Statistical analysis was performed by one‐way ANOVA (*P < 0.05 for efavirenz vs. MeOH and # P < 0.05 for thapsigargin, rotenone or CCCP vs. DMSO).
Calnexin itself is considered a MAM protein, which made us speculate about Lon's location in MAMs. In order to assess this possibility, we next obtained subcellular fractions (crude mitochondria, ER, cytosol and MAMs) of cells treated with efavirenz, thapsigargin or CCCP and explored the presence of several protein markers. The grade of purity of the samples was assessed by studying the abundance of specific proteins in the untreated cell extracts (Figure 8A), and the results obtained were similar to those reported elsewhere (Wieckowski et al., 2009). While porin, a MAM protein, was observed both in crude mitochondria and MAM fractions, MAMs lacked cytochrome c, a MM protein, as expected. The mitochondrial protein and reported MAM component FACL4 was highly abundant in crude mitochondria and MAMs but was also detected in the ER and the cytosol. Virtually all Lon was located in the mitochondria, as anticipated. Subsequently, we compared the presence of two mitochondrial proteins recognized as MAM members (Grp75 and PTPIP51) under different pharmacological treatments and contrasted this with the expression of Lon (Figure 8B). PTPIP51 was detected only in the crude mitochondria fraction, while efavirenz induced a large increase in its expression, in accordance with the experiments using whole‐cell extracts (Figure 3C). Grp75 was present in all four fractions, and efavirenz increased its presence notably in the cytosol, ER and MAMs. Interestingly, the pattern of Lon expression was very similar to that of Grp75, indicating the possibility that Lon is itself a MAM protein whose presence in MAM is greatly increased under combined ER/mitochondrial stress. We also assessed the levels of calnexin, an ER‐resident chaperone and Ca‐binding protein, and itself a MAM component, in the same extracts (Supporting Information Figure S3). The cytosolic samples obtained after treatment with the different stimuli (efavirenz, thapsigargin and CCCP) displayed no changes in the content of calnexin in comparison to the control, while the presence of the protein in the ER fraction in all three cases decreased. Interestingly, this was paralleled by an increase in the presence of calnexin in the MAM fraction, which was modest in the case of efavirenz and dramatic in the case of thapsigargin. Such evident difference in the levels of calnexin in the MAMs between thapsigargin (classical ER stressor) and efavirenz points again to the specificity of the action of efavirenz.
Figure 8.
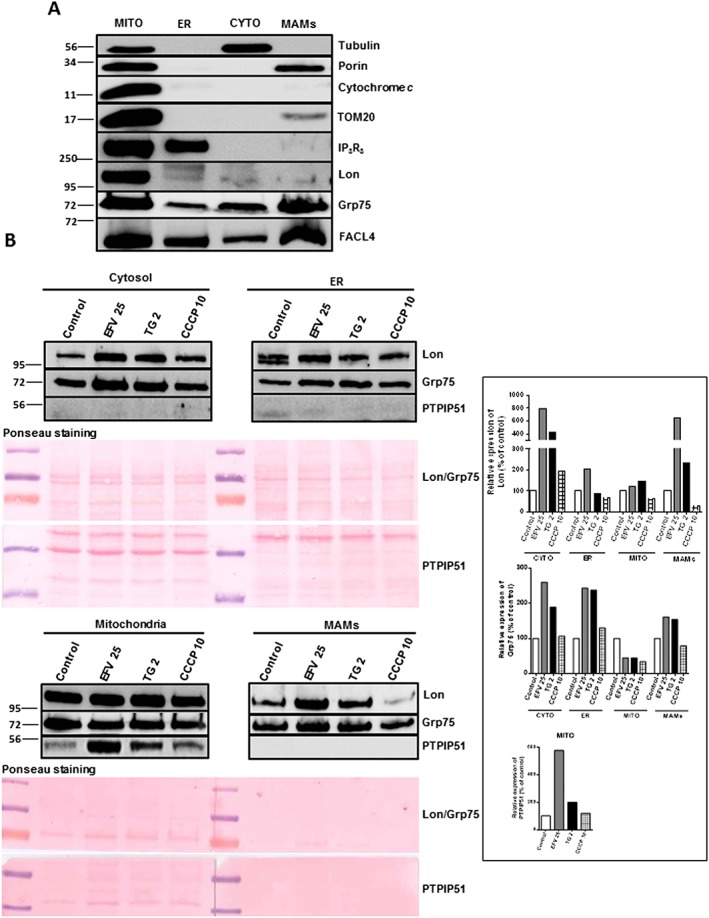
Analysis of the extramitochondrial expression of Lon. (A) Analysis of the purity of different cell fractions (mitochondrial, ER, cytosolic and MAMs) in untreated cells. Representative Western blotting image showing the expression of several mitochondrial (porin, cytochrome c, TOM20, Lon), ER (IP3R3), cytosolic (tubulin) and MAMs (FACL4, Grp75) proteins in basal conditions. (B) Western blotting analysis of Lon, Grp75 and PTPIP51 in cytosolic, ER, mitochondrial and MAM fraction obtained in cells treated for 24 h with efavirenz (EFV), thapsigargin (TG) 2 μM or CCCP 10 μM. A representative experiment is shown, quantified data are expressed as % of control (with the expression in the untreated cells in each fraction considered 100%). Ponceau staining of proteins was used as a loading control to normalize the results – equal relative amounts of protein were loaded per lane for each extract.
Discussion
Regulation of mitochondrial dynamics/morphology is paramount for proper mitochondrial functioning (Vannuvel et al., 2013). While mitochondrial fusion facilitates the exchange of vital metabolites and mtDNA between different mitochondria to ensure their functional maintenance (Nakada et al., 2009), mitochondrial fission is required to ensure biogenesis, to respond to changes in local energy demands and to separate/eliminate damaged or old mitochondria through a selective autophagic process called mitophagy. Mitochondrial fusion and fission are tightly controlled processes that require several highly evolutionary conserved GTPases: mitofusins, anchored in the OMM (Santel and Fuller, 2001); OPA1, located in the IMM (Smirnova et al., 1998); and Drp1 (Otera and Mihara, 2011). During the import of OPA1 into the MM, the N‐terminal matrix‐targeting signal is cleaved by mitochondrial processing peptidase to form the mature OPA1 isoform (L‐isoform) (Ishihara et al., 2006), which undergoes further processing events at two distinct sites – S1 and S2 – generating shorter isoforms. L‐isoform has a mitochondrial fusion‐stimulating activity, a feature that is lost following proteolytic cleavage into the S‐isoform (Ishihara et al., 2006). There is evidence that mitochondrial dysfunction, characterized by low mitochondrial ATP production and ΔΨm dissipation, is associated with loss of the long isoform (Vannuvel et al., 2013). This is in line with other results in the present study, which demonstrate that mitochondrial/ER stressors reduce the l‐OPA1/s‐OPA1 ratio, which is particularly evident under the conditions that cause massive ΔΨm loss. The master regulator of mitochondrial division in most eukaryotic organisms, Drp1, is mostly cytosolic, with only approximately 3% associated to the OMM (Smirnova et al., 2001). In order to promote fusion, Drp1 is recruited to mitochondria, where it oligomerizes around the mitochondrion, thus constricting it. Many studies have failed to report an increase in fission through the alteration of protein levels of Drp1, which is in line with the results shown here. On the contrary, it seems that post‐translational modifications target Drp1 to mitochondria and enable it to mediate fission. One such regulation is phosphorylation at Ser616, which occurs through Cdk1/cyclin B (Taguchi et al., 2007) and triggers mitotic Drp1‐dependent mitochondrial fission. Since this modification does not directly affect GTPase activity, the increase in fission may be mediated by alterations in Drp1 interactions with other proteins. In the present model, the dual effect of ER stress/mitochondrial dysfunction led to an increase in p‐Drp1 expression and its co‐localization with mitochondria, an effect that was not achieved with the rest of the stimuli. In summary, it is crucial to understand that different stimuli that produce ER‐stress and/or different types of mitochondrial dysfunction regulate markers of mitochondrial dynamics in a different way.
Abundant evidence demonstrates that mitochondria function in close collaboration with the ER, but precisely how this is affected by distinct pathophysiological conditions remains to be determined. On examining the role of Lon, we have found that its content in the mitochondrion is depleted upon dual ER stress/mitochondrial dysfunction, while its extramitochondrial presence – in both the ER and MAMs – is increased. This, however, is not the case when cells are exposed to classical mitotoxic stimuli such as rotenone or CCCP, which underlines, once more, the importance of the role of ER‐stress in this phenomenon. A considerable body of evidence shows that Lon is up‐regulated during ER‐stress and that this occurs through the PERK‐ATF4 pathway (Hori et al., 2002; Rainbolt et al., 2014) or with the participation of the transcription factor CHOP (Han et al., 2013). In the present model, PERK phosphorylation seems to be only partially involved in Lon up‐regulation while CHOP does not seem to participate, and LONP1 expression is controlled by NF‐κB, as suggested by other studies (Pinti et al., 2011). The uncoupler CCCP can induce ER stress as seen in SH‐SY5Y exposed to 10 μM CCCP for 24 h (Bouman et al., 2011), an experimental setting similar to ours. Although we have not addressed whether this occurs specifically in our model, it is evident that in the majority of the parameters, efavirenz and CCCP do not produce the same effect. In this regard, while efavirenz (25 μM) and CCCP (10 μM) lead to similar drop in ΔΨm after 24 h treatment (Polo et al., 2015), the extent of up‐regulation of LONP1 induced by the two stressors differs greatly.
Although the regulatory mechanisms governing Lon expression are still somewhat elusive, there is a growing body of evidence that pinpoints Lon as a human stress protein whose levels increase after exposure to multiple independent stressors including heat shock, hypoxia, serum starvation and oxidative stress (Ngo et al., 2013). In this regard, we have proven the participation of oxidants in Lon's up‐regulation and the protective role of Lon with regard to oxidative stress in our model.
In the light of our results, it is tempting to speculate on Lon's location during specific cellular insults. Moreover, Lon is regarded as a MM protease, hence its up‐regulation by these particular stress stimuli would be assumed to enhance its canonical mitochondrial function. With this, studies that report stress‐induced Lon up‐regulation do not assess its subcellular localization (Hori et al., 2002).
The pattern of Lon and Grp75 expression under thapsigargin and efavirenz treatment studied by Western blotting show both similarities and differences. However, the specificity of the Western blot analysis of mitochondria‐enriched versus cytosolic extracts is not sufficient and extracts representing extramitochondrial protein fractions may include MAMs proteins (specifically OMM‐associated), which is why we performed a more accurate analysis of subcellular fractionation. This experiment clearly showed an increase of both Grp75 and Lon induced by thapsigargin and efavirenz in MAMs. Regarding ER fraction, thapsigargin does not increment Lon's level, which is in line with the result obtained by confocal microscopy that revealed no increased association between Lon and calnexin, used as an ER‐marker, in thapsigargin‐treated cells. Also, the present study reflects that there are several differences between the effect of thapsigargin and that of efavirenz on Lon regulation; however, whether this would be the case with other pharmacological ER stressors remains to be elucidated.
Our study leads to several conclusions: firstly, mitochondrial dynamics and mitochondria/ER contact are differently regulated by different types of mitochondrial and ER‐stress; secondly, Lon is transcriptionally up‐regulated under these conditions – this effect is not cell type‐specific as it occurs in different cell types and is not related to the drug family of efavirenz as it was not recorded with rilpivirine, a member of the same family of antiretroviral drugs, which does not affect either mitochondrial or ER function in Hep3B cells (Blas‐García et al., 2014); and thirdly, and most importantly, Lon is involved in the interorganellar crosstalk between the ER and mitochondria as a MAMs component itself. Exactly what its putative role in the MAMs is not known and remains to be explored. The mechanisms involved in MAMs assembly are still not understood, which limits our knowledge of how signal transduction might impact the association between the ER and mitochondria. It is plausible, however, that changes in the physiological demands of the cell (e.g. requirements for increased mitochondrial ATP, altered Ca2+ flux or altered lipid production) might signal to induce morphological changes in ER–mitochondria contact sites that could facilitate such demands. In this work, we have used Grp75 as a reference mitochondrial MAMs component due to its similarities with Lon. Both are MM proteins which even physically interact (Kao et al., 2015), they are involved in the proteostasis of this organelle and both are induced by ER‐stress (Hori et al., 2002). Whether the mechanism by which Lon participates in the MAMs is similar to that of Grp75 is yet to be studied. Lon is a matrix protein; however, it can be recruited to the IMM and interact with prohibitins (Bulteau and Bayot, 2011).
In control cells and upon ectopic expression of the WT protein, Lon can be found in the MM (Hori et al., 2002). We provide evidence of its alternative location in stressed cells. This finding is in line with a recent proteomics study, which identified Lon as a mitochondrial antiviral‐signalling (MAVS)‐interacting protein during RNA virus infection in vitro (Horner et al., 2015). MAVS, an OMM protein and itself considered a MAMs component, is recognized as a crucial participant in the innate immune response to RNA virus infections in mammalian cells. The fact that Lon regulation occurs in the presence of an antiretroviral drug, as shown by our results, significantly bolsters the findings of the present study and opens up a new and very promising route for research. The presence of Lon in MAMs could also be cell type‐specific – Lon was identified in an in‐depth proteomic analysis of MAMs obtained from mouse brain samples under basal conditions but not from liver samples (Poston et al., 2013).
We believe that the findings presented here contribute in a considerable way to the growing knowledge regarding the interaction between mitochondria and ER. Indeed, we hope they are a starting point for a more comprehensive understanding of the role of Lon under complex stressful conditions. The findings shown here are potentially clinically relevant due to the fact that the effects were observed with efavirenz, one of the most widely used antiretroviral drugs.
Author contributions
M.P., F.A., A.B.M. and A.M.‐R. performed experiments, analysed data and prepared the figures; L.G. analysed data, prepared figures, critically revised data and critically read the MS; N.A., A.B.‐G. and J.V.E. designed experiments, critically revised data, drafted and wrote the MS.
Conflicts of interest
J.V.E. has received funds for speaking at symposia organized by Abbvie Farmacéutica S.L.U., Astra Zeneca and Gilead Sciences. All other authors have none to declare.
Declaration of transparency and scientific rigour
This Declaration acknowledges that this paper adheres to the principles for transparent reporting and scientific rigour of preclinical research recommended by funding agencies, publishers and other organisations engaged with supporting research.
Supporting information
Figure S1 Analysis of p‐Drp1 protein expression after 48 h of treatment. Cells were treated for 24 h with increasing concentrations of efavirenz (EFV), vehicle, thapsigargin (TG) 2 μM, rotenone (Rot) 25 μM or CCCP 10 μM. Representative WB images and histograms showing quantification of p‐Drp1 in mitochondria‐enriched and cytosolic protein extracts. Results (mean ± SEM, n = 5) are expressed as % of control (untreated cells, considered 100%). Statistical analysis was performed by One‐way ANOVA (* P < 0.05 for EFV vs. MeOH).
Figure S2 Lon expression studied in cells where CHOP/DDIT3 has been silenced by siRNA. Representative WB image and histogram expressing quantification of Lon expression in cells transfected with siRNA Control or siCHOP and treated for 24 h with efavirenz (EFV), vehicle (MeOH or DMSO), thapsigargin (TG) 2 μM or rotenone (Rot) 25 μM. Data (mean ± SEM, n = 5 for siControl samples y n = 6 for siCHOP) are expressed as % of control of siControl cells (considered 100%). Statistical analysis was performed by One‐way ANOVA (* P < 0.05 for EFV vs. MeOH).
Figure S3 Analysis of the expression of calnexin in different subcellular fractions. (A) Representative WB images showing the expression of calnexin in basal conditions in cytosolic, ER, mitochondrial and MAMs fraction. (B) WB analysis of calnexin in subcellular fractions obtained in cells treated for 24 h with efavirenz (EFV), thapsigargin (TG) 2 μM, or CCCP 10 μM. Ponceau staining of proteins was used as a loading control – equal relative amounts of protein load per lane in each extract.
Acknowledgements
The authors thank Brian Normanly for his English language editing and Dr Ricardo Flores Pedauyé (Research Professor, CSIC) for assistance with the cellular subfractionation experiments, which were performed at Instituto de Biología Molecular y Celular de Plantas (UPV‐CSIC), Valencia, Spain. This work was supported by the Instituto de Salud Carlos III, Ministerio de Economía, Industria y Competitividad (research grant PI14/00312 and CIBER CB06/04/0071, postgraduate fellowship FI12/00198 to F.A. and ‘Juan de la Cierva’ postdoctoral contract JCI‐2012–15124 to A.B.‐G.); the Conselleria d'Educació, Formació i Ocupació, Generalitat Valenciana (research grants PROMETEOII/2014/035, ACOMP/2013/236 and GVA/2014/118, and postgraduate fellowship ACIF/2013/136 to M.P.) and Ministerio de Educación, Cultura y Deporte (postgraduate fellowship FPU13/00151 to A.M.‐R.). A.B.M. is the recipient of Postgraduate Trainee Research Grant from Fundación Juan Esplugues. We would also like to acknowledge the support of the TRANSAUTOPHAGY COST Action, CA15138.
Polo, M. , Alegre, F. , Moragrega, A. B. , Gibellini, L. , Marti‐Rodrigo, A. , Blas‐Garcia, A. , Esplugues, J. V. , and Apostolova, N. (2017) Lon protease: a novel mitochondrial matrix protein in the interconnection between drug‐induced mitochondrial dysfunction and endoplasmic reticulum stress. British Journal of Pharmacology, 174: 4409–4429. doi: 10.1111/bph.14045.
References
- Alexander SPH, Kelly E, Marrion N, Peters JA, Benson HE, Faccenda E et al (2015a). The Concise Guide to PHARMACOLOGY 2015/16: Overview. Br J Pharmacol 172: 5729–5143. [DOI] [PMC free article] [PubMed] [Google Scholar]
- Alexander SPH, Peters JA, Kelly E, Marrion N, Benson HE, Faccenda E et al (2015b). The Concise Guide to PHARMACOLOGY 2015/16: Ligand‐gated ion channels. Br J Pharmacol 172: 5870–5903. [DOI] [PMC free article] [PubMed] [Google Scholar]
- Alexander SPH, Fabbro D, Kelly E, Marrion N, Peters JA, Benson HE et al (2015c). The Concise Guide to PHARMACOLOGY 2015/16: Enzymes. Br J Pharmacol 172: 6024–6109. [DOI] [PMC free article] [PubMed] [Google Scholar]
- Apostolova N, Gomez‐Sucerquia LJ, Moran A, Alvarez A, Blas‐Garcia A, Esplugues JV (2010). Enhanced oxidative stress and increased mitochondrial mass during efavirenz‐induced apoptosis in human hepatic cells. Br J Pharmacol 160: 2069–2084. [DOI] [PMC free article] [PubMed] [Google Scholar]
- Apostolova N, Gomez‐Sucerquia LJ, Alegre F, Funes HA, Victor VM, Barrachina MD et al (2013). ER stress in human hepatic cells treated with Efavirenz: mitochondria again. J Hepatol 59: 780–789. [DOI] [PubMed] [Google Scholar]
- Blas‐García A, Polo M, Alegre F, Funes HA, Martínez E, Apostolova N et al (2014). Lack of mitochondrial toxicity of darunavir, raltegravir and rilpivirine in neurons and hepatocytes: a comparison with efavirenz. J Antimicrob Chemother 69: 2995–3000. [DOI] [PubMed] [Google Scholar]
- Bota DA, Davies KJ (2002). Lon protease preferentially degrades oxidized mitochondrial aconitase by an ATP‐stimulated mechanism. Nat Cell Biol 4: 674–680. [DOI] [PubMed] [Google Scholar]
- Bouman L, Schlierf A, Lutz AK, Shan J, Deinlein A, Kast J et al (2011). Parkin is transcriptionally regulated by ATF4: evidence for an interconnection between mitochondrial stress and ER stress. Cell Death Differ 18: 769–782. [DOI] [PMC free article] [PubMed] [Google Scholar]
- de Brito OM, Scorrano L (2008). Mitofusin 2 tethers endoplasmic reticulum to mitochondria. Nature 456: 605–610. [DOI] [PubMed] [Google Scholar]
- Bui M, Gilady SY, Fitzsimmons RE, Benson MD, Lynes EM, Gesson K et al (2010). Rab32 modulates apoptosis onset and mitochondria‐associated membrane (MAM) properties. J Biol Chem 285: 31590–31602. [DOI] [PMC free article] [PubMed] [Google Scholar]
- Bulteau AL, Bayot A (2011). Mitochondrial proteases and cancer. Biochim Biophys Acta 1807: 595–601. [DOI] [PubMed] [Google Scholar]
- Burger D, van der Heiden I, la Porte C, van der Ende M, Groeneveld P, Richter C et al (2006). Interpatient variability in the pharmacokinetics of the HIV non‐nucleoside reverse transcriptase inhibitor efavirenz: the effect of gender, race, and CYP2B6 polymorphism. Br J Clin Pharmacol 61: 148–154. [DOI] [PMC free article] [PubMed] [Google Scholar]
- Carr DF, la Porte CJ, Pirmohamed M, Owen A, Cortes CP (2010). Haplotype structure of CYP2B6 and association with plasma efavirenz concentrations in a Chilean HIV cohort. J Antimicrob Chemother 65: 1889–1893. [DOI] [PMC free article] [PubMed] [Google Scholar]
- Cheng Z, Teo G, Krueger S, Rock TM, Koh HW, Choi H et al (2016). Differential dynamics of the mammalian mRNA and protein expression response to misfolding stress. Mol Syst Biol 12: 855. [DOI] [PMC free article] [PubMed] [Google Scholar]
- Curtis MJ, Bond RA, Spina D, Ahluwalia A, Alexander SPA, Giembycz MA et al (2015). Experimental design and analysis and their reporting: new guidance for publication in BJP. Br J Pharmacol 172: 3461–3471. [DOI] [PMC free article] [PubMed] [Google Scholar]
- Friedman JR, Lackner LL, West M, DiBenedetto JR, Nunnari J, Voeltz GK (2011). ER tubules mark sites of mitochondrial division. Science 334: 358–362. [DOI] [PMC free article] [PubMed] [Google Scholar]
- Fukuda R, Zhang H, Kim JW, Shimoda L, Dang CV, Semenza GL (2007). HIF‐1 regulates cytochrome oxidase subunits to optimize efficiency of respiration in hypoxic cells. Cell 129: 111–122. [DOI] [PubMed] [Google Scholar]
- Funes HA, Apostolova N, Alegre F, Blas‐Garcia A, Alvarez A, Marti‐Cabrera M et al (2014). Neuronal bioenergetics and acute mitochondrial dysfunction: a clue to understanding the central nervous system side effects of efavirenz. J Infect Dis 210: 1385–1395. [DOI] [PubMed] [Google Scholar]
- Giorgi C, De Stefani D, Bononi A, Rizzuto R, Pinton P (2009). Structural and functional link between the mitochondrial network and the endoplasmic reticulum. Int J Biochem Cell Biol 41: 1817–1827. [DOI] [PMC free article] [PubMed] [Google Scholar]
- Gounden V, van Niekerk C, Snyman T, George JA (2010). Presence of the CYP2B6 516G> T polymorphism, increased plasma Efavirenz concentrations and early neuropsychiatric side effects in South African HIV‐infected patients. AIDS Res Ther 7: 32. [DOI] [PMC free article] [PubMed] [Google Scholar]
- Han J, Back SH, Hur J, Lin YH, Gildersleeve R, Shan J et al (2013). ER‐stress‐induced transcriptional regulation increases protein synthesis leading to cell death. Nat Cell Biol 15: 481–490. [DOI] [PMC free article] [PubMed] [Google Scholar]
- Hori O, Ichinoda F, Tamatani T, Yamaguchi A, Sato N, Ozawa K et al (2002). Transmission of cell stress from endoplasmic reticulum to mitochondria: enhanced expression of Lon protease. J Cell Biol 157: 1151–1160. [DOI] [PMC free article] [PubMed] [Google Scholar]
- Horner SM, Wilkins C, Badil S, Iskarpatyoti J, Gale M Jr (2015). Proteomic analysis of mitochondrial‐associated ER membranes (MAM) during RNA virus infection reveals dynamic changes in protein and organelle trafficking. PLoS One 10: e0117963. [DOI] [PMC free article] [PubMed] [Google Scholar]
- Ishihara N, Fujita Y, Oka T, Mihara K (2006). Regulation of mitochondrial morphology through proteolytic cleavage of OPA1. EMBO J 25: 2966–2977. [DOI] [PMC free article] [PubMed] [Google Scholar]
- Kao TY, Chiu YC, Fang WC, Cheng CW, Kuo CY, Juan HF et al (2015). Mitochondrial Lon regulates apoptosis through the association with Hsp60‐mtHsp70 complex. Cell Death Dis 6: e1642. [DOI] [PMC free article] [PubMed] [Google Scholar]
- Li N, Ragheb K, Lawler G, Sturgis J, Rajwa B, Melendez JA et al (2003). Mitochondrial complex I inhibitor rotenone induces apoptosis through enhancing mitochondrial reactive oxygen species production. J Biol Chem 278: 8516–8525. [DOI] [PubMed] [Google Scholar]
- Lin J, Schyschka L, Mühl‐Benninghaus R, Neumann J, Hao L, Nussler N et al (2012). Comparative analysis of phase I and II enzyme activities in 5 hepatic cell lines identifies Huh‐7 and HCC‐T cells with the highest potential to study drug metabolism. Arch Toxicol 86: 87–95. [DOI] [PubMed] [Google Scholar]
- Lodish H, Berk A, Zipursky SL, Matsudaira P, Baltimore D, Darnell J (2000). Molecular Cell Biology, 4th edn. W. H. Freeman: New York. [Google Scholar]
- Lytton J, Westlin M, Hanley MR (1991). Thapsigargin inhibits the sarcoplasmic or endoplasmic reticulum Ca‐ATPase family of calcium pumps. J Biol Chem 266: 17067–17071. [PubMed] [Google Scholar]
- Matsushima Y, Goto Y, Kaguni LS (2010). Mitochondrial Lon protease regulates mitochondrial DNA copy number and transcription by selective degradation of mitochondrial transcription factor A (TFAM). Proc Natl Acad Sci U S A 107: 18410–18415. [DOI] [PMC free article] [PubMed] [Google Scholar]
- Nakada K, Sato A, Hayashi J (2009). Mitochondrial functional complementation in mitochondrial DNA‐based diseases. Int J Biochem Cell Biol 41: 1907–1913. [DOI] [PubMed] [Google Scholar]
- Ngo JK, Pomatto LC, Davies KJ (2013). Upregulation of the mitochondrial Lon Protease allows adaptation to acute oxidative stress but dysregulation is associated with chronic stress, disease, and aging. Redox Biol 1: 258–264. [DOI] [PMC free article] [PubMed] [Google Scholar]
- Otera H, Mihara K (2011). Discovery of the membrane receptor for mitochondrial fission GTPase Drp1. Small GTPases 2: 167–172. [DOI] [PMC free article] [PubMed] [Google Scholar]
- Pinti M, Gibellini L, De Biasi S, Nasi M, Roat E, O'Connor JE et al (2011). Functional characterization of the promoter of the human Lon protease gene. Mitochondrion 11: 200–206. [DOI] [PubMed] [Google Scholar]
- Polo M, Alegre F, Funes HA, Blas‐Garcia A, Victor VM, Esplugues JV et al (2015). Br J Pharmacol 172: 1713–1727. [DOI] [PMC free article] [PubMed] [Google Scholar]
- Poston CN, Krishnan SC, Bazemore‐Walker CR (2013). In‐depth proteomic analysis of mammalian mitochondria‐associated membranes (MAM). J Proteomics 79: 219–230. [DOI] [PubMed] [Google Scholar]
- Rainbolt TK, Saunders JM, Wiseman RL (2014). Stress‐responsive regulation of mitochondria through the ER unfolded protein response. Trends Endocrinol Metab 25: 528–537. [DOI] [PubMed] [Google Scholar]
- Santel A, Fuller MT (2001). Control of mitochondrial morphology by a human mitofusin. J Cell Sci 114 (Pt 5): 867–874. [DOI] [PubMed] [Google Scholar]
- Smirnova E, Shurland DL, Ryazantsev SN, Van Der Bliek AM (1998). A human dynamin‐related protein controls the distribution of mitochondria. J Cell Biol 143: 351–358. [DOI] [PMC free article] [PubMed] [Google Scholar]
- Smirnova E, Griparic L, Shurland DL, van der Bliek AM (2001). Dynamin‐related protein Drp1 is required for mitochondrial division in mammalian cells. Mol Biol Cell 12: 2245–2256. [DOI] [PMC free article] [PubMed] [Google Scholar]
- Southan C, Sharman JL, Benson HE, Faccenda E, Pawson AJ, Alexander SPH et al (2016). The IUPHAR/BPS guide to PHARMACOLOGY in 2016: towards curated quantitative interactions between 1300 protein targets and 6000 ligands. Nucl Acids Res 44: D1054–D1068. [DOI] [PMC free article] [PubMed] [Google Scholar]
- Szabadkai G, Bianchi K, Várnai P, De Stefani D, Wieckowski MR, Cavagna D et al (2006). Chaperone‐mediated coupling of endoplasmic reticulum and mitochondrial Ca2+ channels. J Cell Biol 175: 901–911. [DOI] [PMC free article] [PubMed] [Google Scholar]
- Taguchi N, Ishihara N, Jofuku A, Oka T, Mihara K (2007). Mitotic phosphorylation of dynamin‐related GTPase Drp1 participates in mitochondrial fission. J Biol Chem 282: 11521–11529. [DOI] [PubMed] [Google Scholar]
- Vance JE (1990). Phospholipid synthesis in a membrane fraction associated with mitochondria. J Biol Chem 265: 7248–7256. [PubMed] [Google Scholar]
- Vannuvel K, Renard P, Raes M, Arnould T (2013). Functional and morphological impact of ER stress on mitochondria. J Cell Physiol 228: 1802–1818. [DOI] [PubMed] [Google Scholar]
- Wieckowski MR, Giorgi C, Lebiedzinska M, Duszynski J, Pinton P (2009). Isolation of mitochondria‐associated membranes and mitochondria from animal tissues and cells. Nat Protoc 4: 1582–1590. [DOI] [PubMed] [Google Scholar]
- Zhu XH, Wang CH, Tong YW (2007). Growing tissue‐like constructs with Hep3B/HepG2 liver cells on PHBV microspheres of different sizes. J Biomed Mater Res B Appl Biomater 82: 7–16. [DOI] [PubMed] [Google Scholar]
Associated Data
This section collects any data citations, data availability statements, or supplementary materials included in this article.
Supplementary Materials
Figure S1 Analysis of p‐Drp1 protein expression after 48 h of treatment. Cells were treated for 24 h with increasing concentrations of efavirenz (EFV), vehicle, thapsigargin (TG) 2 μM, rotenone (Rot) 25 μM or CCCP 10 μM. Representative WB images and histograms showing quantification of p‐Drp1 in mitochondria‐enriched and cytosolic protein extracts. Results (mean ± SEM, n = 5) are expressed as % of control (untreated cells, considered 100%). Statistical analysis was performed by One‐way ANOVA (* P < 0.05 for EFV vs. MeOH).
Figure S2 Lon expression studied in cells where CHOP/DDIT3 has been silenced by siRNA. Representative WB image and histogram expressing quantification of Lon expression in cells transfected with siRNA Control or siCHOP and treated for 24 h with efavirenz (EFV), vehicle (MeOH or DMSO), thapsigargin (TG) 2 μM or rotenone (Rot) 25 μM. Data (mean ± SEM, n = 5 for siControl samples y n = 6 for siCHOP) are expressed as % of control of siControl cells (considered 100%). Statistical analysis was performed by One‐way ANOVA (* P < 0.05 for EFV vs. MeOH).
Figure S3 Analysis of the expression of calnexin in different subcellular fractions. (A) Representative WB images showing the expression of calnexin in basal conditions in cytosolic, ER, mitochondrial and MAMs fraction. (B) WB analysis of calnexin in subcellular fractions obtained in cells treated for 24 h with efavirenz (EFV), thapsigargin (TG) 2 μM, or CCCP 10 μM. Ponceau staining of proteins was used as a loading control – equal relative amounts of protein load per lane in each extract.