Abstract
Intramuscular pressure (IMP) has been used to estimate muscle stress indirectly. However, the ability of this technique to estimate muscle stress under dynamic conditions is poorly characterized. Therefore, the purpose of this study was to determine the extent to which IMP is a valid surrogate for muscle stress during dynamic contractions. IMP and muscle stress were compared under steady-state isotonic conditions and during complex dynamic length changes. During concentric contractions the shape of the IMP–velocity curve mimicked the basic shape of the force–velocity curve but with much higher variability. For eccentric contractions, a precipitous drop in IMP was observed despite increased muscle stress. The dissociation between muscle stress and IMP during dynamic contractions was partially explained by sensor movement. When the muscle was not moving, IMP explained 89% ± 5% of the variance in muscle force. However, when transducer movement occurred the linear relationship between IMP and stress was no longer observed. These findings demonstrate the difficulty in interpreting IMP under dynamic conditions when sensor movement occurs. They also illustrate the need to control transducer movement if muscle stress is to be inferred from IMP measurements such as might be desired during clinical gait testing.
Keywords: fluid mechanics, force–velocity relationship, interstitial fluid pressure, intramuscular pressure, isotonic contraction
The fact that skeletal muscles generate significant intramuscular pressure (IMP) during active contraction was established by the eminent physiologist A.V. Hill in the 1940s.16 Since that time, IMP has been studied in order to understand normal muscle function and the etiology of such pathological states as compartment syndromes (for review, see Hargens et al.14). Although there is evidence in the literature that IMP is a good predictor of relative isometric joint torque in humans14 and relative passive and active isometric stress in animal models,7 the extent to which such a relationship is maintained during dynamic muscle movement is not known. For IMP to serve a useful role in understanding in vivo human muscle function, it must provide unique information that reflects muscle force under all conditions, not just the precisely controlled conditions that may be created in a laboratory setting. There is reason to believe that IMP might not accurately reflect muscle force under all conditions since previous work using a very small pressure transducer19 showed that pressure was a much better surrogate for predicting isometric muscle force at longer muscle lengths during both active contraction and passive load bearing.7 It was postulated that long muscle lengths secured the transducer during contraction. Anecdotal observations indicated that, at shorter muscle lengths, transducer movement resulted in aberrant pressure readings.
Normal joint movements involve complex dynamic muscle length changes. In vivo, these contractions have been shown to vary in terms of strain magnitude and strain rate even within the same muscle.12 As mentioned, muscle length changes may be accompanied by transducer movement that may affect the pressure–stress relationship. To date, the pressure–stress relationship has not been explicitly studied under conditions of either laboratory controlled isotonic contraction or during more complex in vivo muscle movements. Since the muscle force–velocity relationship is well understood during isotonic shortening15 and lengthening,18 dynamic isotonic experiments provide the ideal opportunity to probe the pressure–stress relationship under dynamic conditions. Our objective was to determine the extent to which IMP serves as a force surrogate during dynamic contraction conditions. This relationship was investigated under both steady-state isotonic conditions as well as during dynamic length changes that included eccentric contractions.
MATERIALS AND METHODS
The experimental model used was the tibialis anterior (TA) muscle of the New Zealand White rabbit (mass, 2.5 kg ± 0.5; n = 10). This model was selected primarily for the accessibility of the TA, its 3° pennation angle, and parallel fiber arrangement.20 Since it is believed that fiber curvature may affect IMP, we chose the TA, as any curvature even during shortening is negligible.20 The muscle size also permitted pressure transducer insertion without significant muscle trauma, as repeated insertions resulted in no change in contractile force.7 All experimental procedures adhered to the guidelines set forth by the National Institutes of Health.
Anesthesia was induced with 4% halothane and maintained on 2% halothane (2 L/min). Heart rate and oxygen saturation were monitored (VetOx; Heska Co., Fort Collins, Colorado) throughout the test duration and anesthesia was adjusted as needed. A midline incision was made from the ankle to the mid-thigh. Fascia was removed in order to minimize confounding effects of fascial restriction on IMP,11,26,27 thus exposing the entire TA muscle. The leg was immobilized using 3.2 mm Steinmann pins placed in the mid-tibia and distal femur and secured to a custom jig. A cuff electrode was placed around the exposed peroneal nerve for direct muscle activation (Pulsar 6Bp Stimulator; FHC Inc., Bowdoinham, Maine). The TA was released at the retinaculum and attached to a servomotor (Cambridge Model 310B; Aurora Scientific Inc., Ontario, Canada) aligned with the force-generating axis of the motor. A 360-µm diameter fiber optic pressure sensor (Luna Innovations Inc., Blacksburg, Virginia) was inserted via an 18-gauge angiocatheter in line with the force-generating axis of the fibers and at the thickest proximal portion of the muscle. The pressure transducer was adjusted to provide a zero volt output (defined as zero mmHg) after insertion into the muscle. (Absolute pressure readings obtained immediately after transducer insertion ranged from approximately +5 to −5 mmHg.) Sensor calibration was performed by comparison with a National Institute of Standards and Technology (NIST) traceable pressure sensor. The microsensor had an accuracy, repeatability, and linearity better than 2% full-scale output (FSO) and hysteresis slightly higher than 4.5% FSO.19
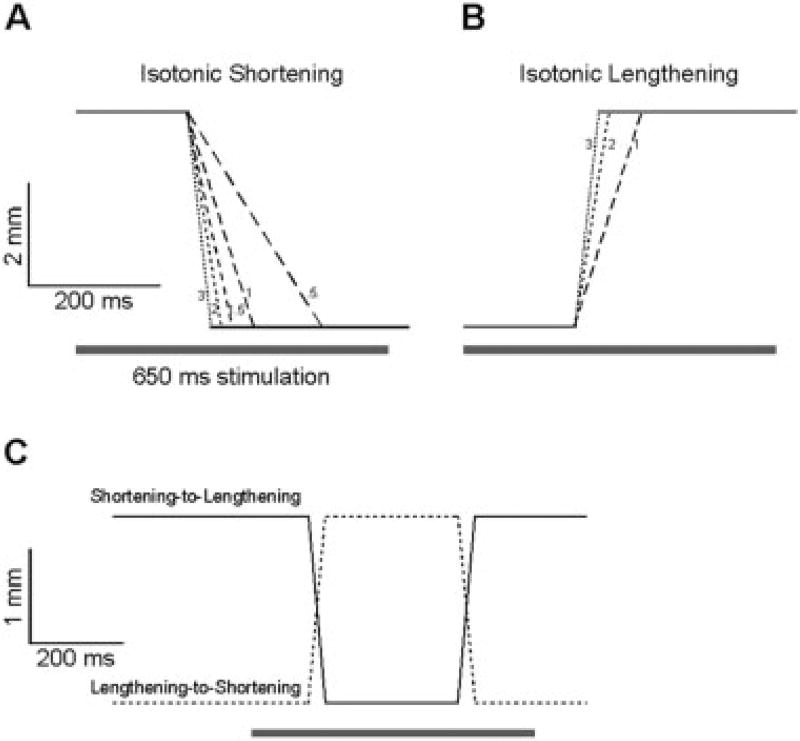
The TA force–velocity relationship was created by repeated activation of the muscle at 60 Hz over a 650-ms period with a 2-min rest interval interposed between each contraction to avoid complications of fatigue. Muscle fiber length (Lf) was calculated from muscle length for each subject using the rabbit TA fiber length-to-muscle length ratio of 0.67.20 For concentric contractions, muscle length was first set to L0 + 5%Lf. After the muscle activation, length was held constant for 200 ms, during which time isometric force was generated. Then, length was decreased by 10% Lf at a selected velocity (Fig. 1A) and the TA was again held at a constant length, permitting redevelopment of isometric tension at the new, shorter length. Shortening velocity was increased in 0.5 Lf/s increments ranging from 0–5.5 Lf/s to generate the force–velocity relationship for concentric contractions. For the eccentric contractions, length was first set to L0−5%Lf and the timing of the concentric protocol duplicated except that positive length ramps of 1, 2, and 3 Lf/s were applied (Fig. 1B). The smaller velocity increment and range compared to concentric contractions were chosen based on the observation that muscle stress is relatively insensitive to lengthening velocity18 and that repetitive eccentric contractions cause muscle injury in this system.22 The experiment ended with two contractions that combined both shortening and lengthening. Specifically, a 10% shortening contraction at 1 Lf/s (PC) was followed by an isometric contraction for 200 ms at the new length (PO) and then a 10% lengthening contraction at 1 Lf/s that returned the muscle to its original length (PE) for a second isometric contraction of 200 ms duration (PO2). Next, a 10% lengthening contraction at 1 Lf/s (PE) was followed by an isometric contraction for 200 ms at the new length (PO), and then a 10% shortening contraction at 1 Lf/s that returned the muscle to its original length (PC) for a second isometric contraction of 200 ms duration (PO2) (Fig. 1C). The order of these contraction paradigms was randomized. Length, tension, pressure, and temperature were recorded for each contraction using a data acquisition board (610E series; National Instruments, Austin, Texas) in the LabView environment (National Instruments) acquiring data at 4,000 Hz.
FIGURE 1.
Length changes imposed on the isolated rabbit tibialis anterior muscle during isotonic testing. Muscle length is plotted as a function of time and is approximated by motor position. Muscle velocity is depicted graphically by decreasing dash length as velocity increases and small numbers refer to velocity in units of Lf/s. (A) Shortening ramps ranging from 0.5 to 3 Lf/s are shown. In practice, velocities up to 5 Lf/s were used but are not discernable graphically on this time base. (B) Lengthening ramps ranged from 1 to 3 Lf/s. (C) Combined shortening then lengthening (solid line) and lengthening then shortening (dashed line) protocol described in the text. Bar represents the timing of the 650 ms nerve stimulation period. Note different calibration bars for isotonic experiments (A,B) compared to combined experiments (C).
Tension records were converted to stress by dividing tension by the muscle’s calculated physiological cross-sectional area (PCSA), using the equation described by Sacks and Roy.25 Stress and IMP values were averaged across 10 animals for each velocity and data are presented graphically as mean ± SEM.
A high-speed video system (OmniSpeed, Model LR400; Speedvision Technologies, San Diego, California) was used to measure transducer position relative to the muscle surface. The video system was placed above and orthogonal to the long axis of the muscle. The muscle surface was marked with a small hair and the transducer tip was easily visualized just beneath the muscle surface because of its white tip (see online supplemental video). Video data were acquired at 400 frames/s for ~1.5 s, exported to AVI format, and manually analyzed frame-by-frame using the NIH ImageJ package (ImageJ, a public domain image analysis program freely available at http://rsb.info.nih.gov/ij/index.html). Final spatial resolution provided by the optical system (70 mm focal length, 1:3.5 macro lens) was 8 µm/pixel after exporting to the digital format.
RESULTS
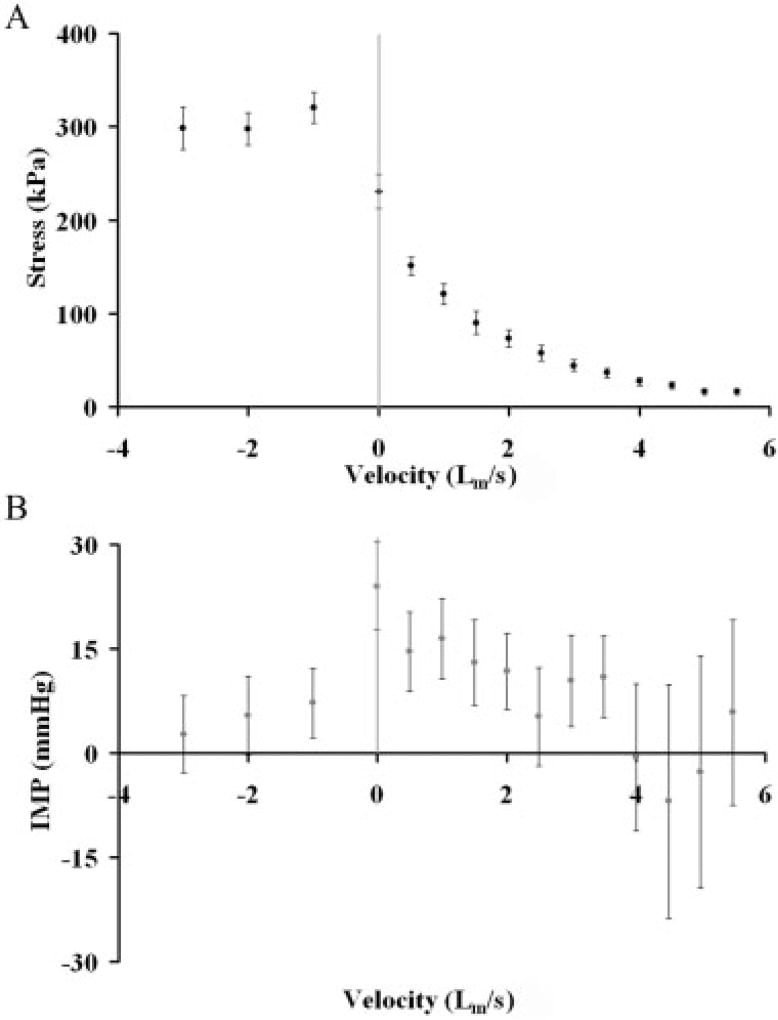
The TA muscle stress–velocity curve had the classic shape of a rectangular hyperbola which was characterized by a Vmax of 5.5 ± 0.33 Lf/s and a P0 of 230 ± 23 kPa (Fig. 2A) which compares favorably with literature values for fast mammalian muscle.4 The shape of the IMP–velocity curve roughly mimicked the shape of the force–velocity curve for concentric contractions but with much higher variability (Fig. 2B). The corresponding points on the IMP–velocity curve demonstrated a maximum IMP (I0) at P0 of 25 ± 8.4 mmHg and, at Vmax IMP decreased to 4.9 ± 11.8 mmHg. These IMP values are generally lower than those recorded in human subjects during muscle contraction.2,6
FIGURE 2.
(A) Relationship between muscle stress and velocity for lengthening (negative velocities) or shortening (positive velocities). These data follow the classic force–velocity relationship described in the literature. (B) Relationship between intramuscular pressure (IMP) and velocity across all velocities tested. Each symbol represents mean ± SEM for 10 animals. Note the increased variability of the IMP records compared to stress. Note also that IMP decreases with lengthening in spite of the fact that stress increases.
During eccentric contractions (negative velocities), muscle stress was higher compared to all values recorded during concentric contraction and relatively constant as previously demonstrated,18 with active stress ranging from 291 ± 22 kPa to 323 ± 28 kPa across velocities (Fig. 2A). However, in contrast to concentric contractions, where pressure and stress covaried, for the eccentric portion of the IMP–velocity curve a precipitous decline in pressure relative to I0 was observed (Fig. 2B). Furthermore, in some cases negative pressures were even recorded during eccentric contractions.
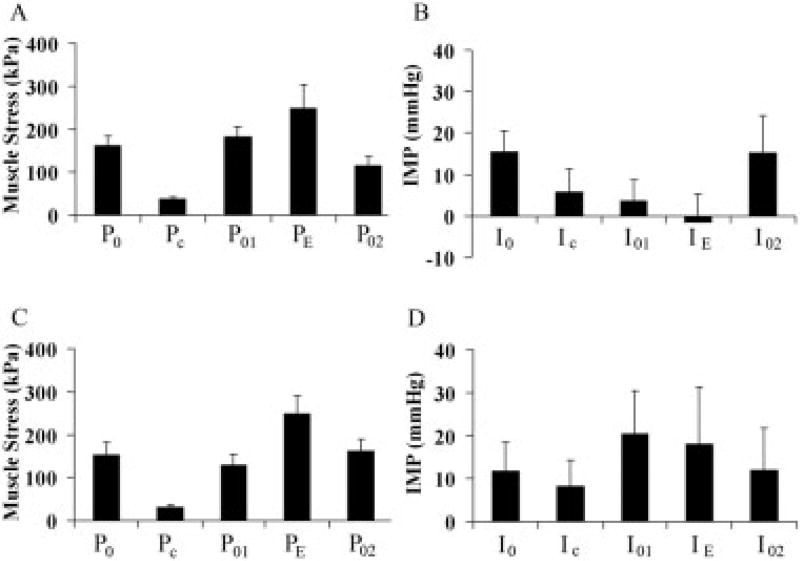
The steady-state IMP–velocity relationship roughly mimicked the form of the muscle force–velocity relationship during concentric contractions, but when the experimental paradigm was changed to a more complex form, the covariation previously noted was completely lost. These complex contraction paradigms demonstrated a profound yet repeatable effect of history. For purposes of discussion, the forces at various points during the protocol were defined as: P0, the initial isometric force, PC, the force developed during concentric contraction, P01, the isometric force developed after the first length change, PE, the force developed during eccentric contraction, and P02, the isometric force developed at the end of this series of length changes when the muscle returned to its original length. The pressures corresponding to these timepoints were defined as I0, IC, I01, IE, and I02.
For the combined protocol that began with shortening (Fig. 3A), muscle stress behaved as expected based on classic muscle mechanics17,18: PC was lower than P0, P01 recovered to a level slightly less than P0 due to shortening onto the ascending limb of the length–tension curve, PE was higher than P01 due to the eccentric contraction, and P02 was slightly higher than P0, presumably due to force enhancement after stretching onto the descending limb of the length–tension curve.9,10 These stresses were significantly different from one another as revealed by one-way ANOVA and post-hoc Fisher’s tests (P < 0.0001). Values for IMP at each of these points displayed reproducible yet unexpected values compared to stress. For example, whereas IC decreased with PC as seen during the steady-state force–velocity experiment (Fig. 2B), I01 was greater than I0 in spite of the fact that P01 was lower than P0. Further, whereas PE was significantly greater than P01 due to eccentric contraction, IE was slightly lower than I01. Thus, a clear dissociation between stress and IMP was measured for complex contractions that began with shortening.
FIGURE 3.
Muscle stress and intramuscular pressure achieved during combined protocols shown in Figure 1C. Data have been rearranged so that corresponding pressures and stresses are in the same location to illustrate the history effect (see text). (A) Stress achieved during the shortening/lengthening protocol. (B) Intramuscular pressure achieved during the shortening/lengthening protocol. (C) Stress achieved during the lengthening/shortening protocol. (D) Intramuscular pressure achieved during the lengthening/shortening protocol. P0, initial isometric force, PC, force developed during concentric contraction, P01, isometric force developed after the first length change, PE, force developed during eccentric contraction, and P02, isometric force developed at then end of this series of length change with the muscle returned to the starting length. Corresponding pressures are defined as I0, IC, I01, IE, and I02. Each bar represents mean ± SEM for 10 animals.
For the combined protocol that began with lengthening, a similar dissociation between IMP and stress was observed, but the nature of the change was different even compared to the protocol that began with shortening. In other words, the combined lengthening/shortening and shortening/lengthening protocols demonstrated a history effect within a contraction combination and also an order effect between combinations. Thus, IE decreased (Fig. 3B) even though PE increased, but then I01 decreased relative to I0 at the new, longer muscle length even though P01 increased. Then, while PC decreased significantly in the subsequent concentric contraction, IC increased slightly, unlike the steady state force–velocity results presented above (Fig. 2). Thus, a clear dissociation between stress and IMP was measured for complex contractions that began with lengthening. To demonstrate this dissociation analytically, we subjected the data set to a two-way ANOVA using contraction number and order (shortening first or lengthening first) as the grouping variables. This analysis demonstrated significant main effects of contraction number and order as expected (P < 0.0001) and, most important, a highly significant interaction term between order and contraction number (P < 0.001).
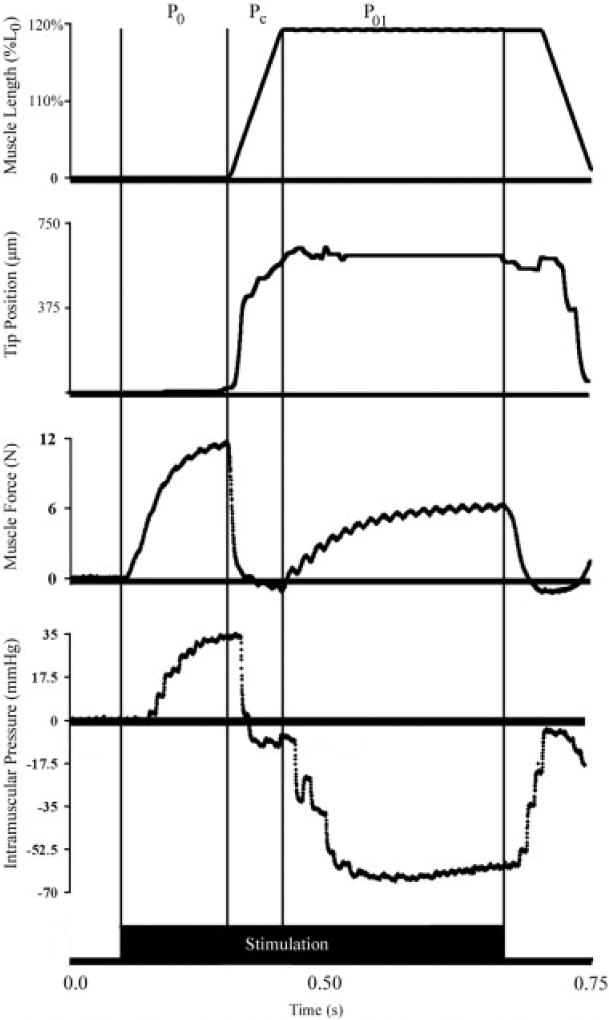
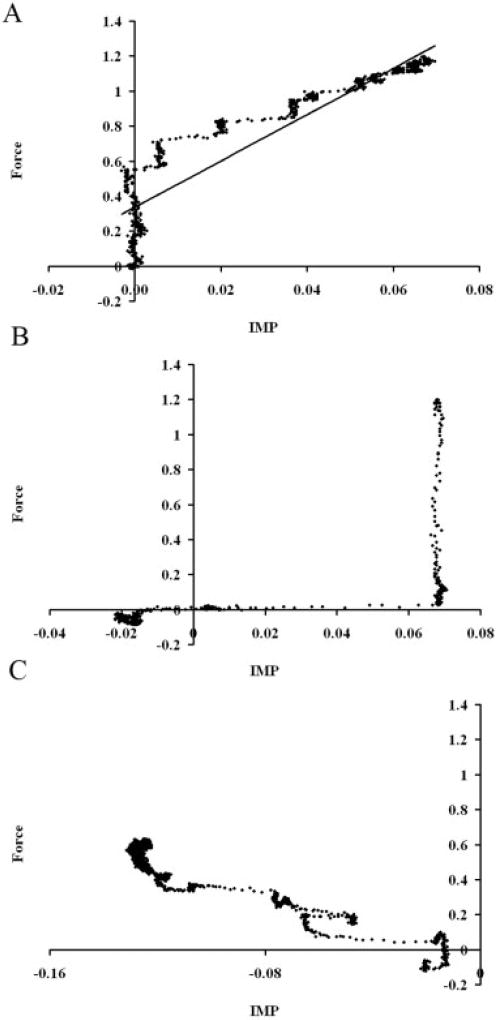
Real-time measurement of transducer position revealed that not only did significant movement occur, but this movement was related to the usefulness of the IMP signal itself. Tip movement followed muscle length change (Fig. 4). Thus, the onset of transducer tip movement corresponded with the timing of muscle shortening in all trials and the cessation of tip movement lagged only slightly behind the cessation of muscle shortening. Quantitative analysis of the predictability of muscle force based on IMP demonstrated that, when the muscle was not moving, IMP explained 89% ± 0.5% of the variance in muscle force (i.e., r2 = 0.89). However, when attempting to predict muscle force from IMP either during movement (Pc) or in during the isometric period after movement (P01), correlation coefficients were negative, suggesting that the relationship between IMP and stress was no longer valid (Fig. 5).
FIGURE 4.
Sample record of muscle length (% L0), transducer tip position (µm), muscle force (N), and intramuscular pressure (mmHg) recordings from a shortening-to-lengthening contraction. The P0, Pc, and P01 regions were determined from the muscle length recording. Linear regression was used to correlate intramuscular pressure and muscle force during these intervals. Intervals are demarked by vertical black lines. Solid bar at bottom of figure represents muscle activation interval.
FIGURE 5.
Scatterplots of IMP (fraction I0) versus muscle force (fraction P0) in regions P0 (A), Pc (B), and P01 (C) of Figure 4. A linear relationship between intramuscular pressure and muscle force was found in region P0 (black line; y = 13.2× + 0.34; r2 = 0.86) (A), but this relationship was not the same and was also highly nonlinear in regions Pc (B) or P01 (C).
DISCUSSION
The purpose of this study was to investigate the relationship between muscle stress and muscle IMP measured with a small solid-state transducer during dynamic contractions. This is an important problem since IMP is often used in the diagnosis and investigation of neuromuscular disorders.14 These experiments were motivated, in part, by the concern that transducer movement appeared to be associated with variable pressure recordings.7 Even under isometric conditions, IMP was more variable compared to muscle stress and, during these conditions, transducers occasionally “squeezed out” of the contracting muscle.
The current study exploits the fundamental and well-established relationship between muscle stress and isotonic force established in the 1930s for whole muscle15,18 and subsequently confirmed at the level of the single cell to be a fundamental property of the sarcomere.8 For all conditions investigated in the current study we obtained the expected results for muscle stress: stress decreased with increasing contraction velocity (Fig. 2A), was relatively independent of lengthening velocity (Fig. 2A), and achieved the appropriate steady-state level during and after dynamic length change, either lengthening or shortening (Fig. 3). However, the behavior of IMP during dynamic muscle contraction yielded unexpected results. First, dynamic IMP during isotonic contraction was highly variable (Fig. 2B). This was not due to uncontrolled muscle length fluctuations since muscle length and motor movement were tightly coupled and the compliance of this experimental system was only ~0.3 µm/g,21 which would not permit the small length changes to occur that could modulate force even at the high forces generated in this study (<2,000g).
Transducer placement is known to affect intramuscular pressure both along and across a skeletal muscle. Cadaveric studies have demonstrated that tourniquets produce increased pressures in deeper tissues that juxtaposed bones13 and increased pressures at the margins of the tourniquet itself where shear strains appear to be the highest during muscle contraction.5 We created a much less complex but more controlled experimental model by releasing the rabbit TA from surrounding fascia and skin, essentially creating a “floating” muscle that was free to expand during contraction. Muscle lateral expansion is known to occur during isometric contraction3 but this would not result in pressure development in our model since the muscle boundary was unconstrained. We attempted to place the transducer tip in the same position for each experiment (see Materials and Methods) but acknowledge that some variation in placement could result in different absolute pressures.23 We believe that such small absolute pressure offsets would affect the baseline pressure level but not the dynamic behavior of the pressure record during contraction. We were also unable to decrease pressure variability by normalizing dynamic pressure to either resting pressure, peak pressure, or average pressure. We thus conclude that the erratic pressure records were accurate depictions of the IMP of the muscle during dynamic contraction.
It should be noted that such an experiment, where pressure and force are correlated in real time, has never been performed previously, at least to our knowledge. Previous so-called “dynamic” studies performed in humans compared such general parameters as ground reaction force or joint moment with IMP measured at one point in time and concluded that IMP was an accurate surrogate of muscle force.1,2 There are several problems with this approach. First, ground reaction forces are notoriously complex in origin and reflect gross parameters such as body mass, body inertia, joint kinematics, and step length, in addition to muscle activation. Thus, it is not surprising that ground reaction forces would correlate grossly with IMP since almost any muscle activation would increase IMP compared to rest and appear to create a valid correlation with changing gait parameters. Additionally, since joint moment results from the simultaneous action of many muscles, a joint moment–IMP correlation does not provide a rigorous test of the hypothesis that muscle stress and IMP are causally related. We thus reject previous assertions of the correlation between IMP and muscle force.
Transducer movement represented, in part, the basis for the measured pressure variability and is illustrated by our real-time measurement of transducer position during dynamic contraction (Fig. 5; see online sample video). During the video, the transducer tip is clearly seen moving relative to the muscle surface. Since the movements are relatively small (<1 mm, Fig. 4) compared to either fiber length ~60 mm,20 or PCSA ~100 mm2,20 the transducer is extremely sensitive to the micromechanical muscle environment. Forced muscle lengthening appears to create a small vacuum between the transducer tip and the muscle such that IMP decreases with stretch even though stress increases greatly. This may explain the decrease in pressure during isotonic lengthening (Fig. 2B) and a lengthening/shortening or shortening/lengthening maneuver (Fig. 3). The fact that a large history effect was observed (Fig. 3) also supports this argument. Presumably, small transducer movements occur after either shortening or lengthening and this creates a new IMP–stress relationship (see examples in Fig. 5). This effect was demonstrated explicitly for a dynamic condition in which transducer tip position was measured in real time. The IMP–stress relationship was always most highly correlated for the case when the transducer was not moving and the absolute relationship itself changed after movement, even if the muscle was once again contracting isometrically. This is the likely explanation for the IMP decrease even though stress increased with lengthening and then pressure decreased relative to the initial value at the new, longer muscle length even though stress had increased (Fig. 3B). Transducer tip movement appears to be due to actual muscle movement rather than storage of elastic strain energy since, even after muscle stimulation ceased, the transducer tip did not move back to the starting position (Fig. 4) but simply appeared to track muscle length.
It should be noted that these studies do not negate the important clinical studies that demonstrate the relationship between resting IMP and muscle pathology (i.e., compartment syndrome)24 since under measurement conditions used clinically, transducer movement is nearly zero due to the passive condition of the muscle and the additional anchoring of the transducer that may be provided by surrounding fascia and skin.
Supplementary Material
Acknowledgments
Supported by NIH grants AR40050, HD31476, the Department of Veterans Affairs, and the National Skeletal Muscle Research Center (HD050837). We thank Tom Wavering and Luna Innovations for their contribution to the design, development, and manufacturing of the pressure microsensor, and the late Dr. David Sutherland (Children’s Hospital and Health Center, San Diego) for originally inspiring this project, for helpful comments throughout the course of this project, and for support.
Abbreviations
- FSO
full-scale output
- IMP
intramuscular pressure
- NIST
National Institute of Standards and Technology
- PCSA
physiological cross-sectional area
- TA
tibialis anterior
Footnotes
This article includes Supplementary Material available via the Internet at http://www.interscience.wiley.com/jpages/0148-639X/suppmat/
References
- 1.Aratow M, Ballard RE, Crenshaw AG, Styf J, Watenpaugh DE, Kahan NJ, et al. Intramuscular pressure and electromyography as indexes of force during isokinetic exercise. J Appl Physiol. 1993;74:2634–2640. doi: 10.1152/jappl.1993.74.6.2634. [DOI] [PubMed] [Google Scholar]
- 2.Ballard RE, Watenpaugh DE, Breit GA, Murthy G, Holley DC, Hargens AR. Leg intramuscular pressures during locomotion in humans. J Appl Physiol. 1998;84:1976–1981. doi: 10.1152/jappl.1998.84.6.1976. [DOI] [PubMed] [Google Scholar]
- 3.Baskin RJ, Paolini PJ. Volume change and pressure development in muscle during contraction. Am J Physiol. 1967;213:1025–1030. doi: 10.1152/ajplegacy.1967.213.4.1025. [DOI] [PubMed] [Google Scholar]
- 4.Close RI. Dynamic properties of mammalian skeletal muscles. Physiol Rev. 1972;52:129–197. doi: 10.1152/physrev.1972.52.1.129. [DOI] [PubMed] [Google Scholar]
- 5.Crenshaw AG, Hargens AR, Gershuni DH, Rydevik BL. Wide tourniquet cuffs more effective at lower inflation pressures. Acta Orthop Scand. 1988;59:447–451. doi: 10.3109/17453678809149401. [DOI] [PubMed] [Google Scholar]
- 6.Crenshaw AG, Styf JR, Hargens AR. Intramuscular pressures during exercise: an evaluation of a fiber optic transducer-tipped catheter system. Eur J Appl Physiol Occup Physiol. 1992;65:178–182. doi: 10.1007/BF00705077. [DOI] [PubMed] [Google Scholar]
- 7.Davis J, Kaufman KR, Lieber RL. Correlation between active and passive isometric force and intramuscular pressure in the isolated rabbit tibialis anterior muscle. J Biomech. 2003;36:505–512. doi: 10.1016/s0021-9290(02)00430-x. [DOI] [PubMed] [Google Scholar]
- 8.Edman K, Mulieri LA, Scubon MB. Non-hyperbolic force-velocity relationship in single muscle fibres. Acta Physiol Scand. 1976;98:143–156. doi: 10.1111/j.1748-1716.1976.tb00234.x. [DOI] [PubMed] [Google Scholar]
- 9.Edman KAP, Elzinga G, Noble MIM. Enhancement of mechanical performance by stretch during tetanic contractions of vertebrate skeletal muscle fibres. J Physiol (Lond) 1978;281:139–155. doi: 10.1113/jphysiol.1978.sp012413. [DOI] [PMC free article] [PubMed] [Google Scholar]
- 10.Edman KAP, Elzinga G, Noble MIM. Residual force enhancement after stretch of contracting frog single muscle fibers. J Gen Physiol. 1982;80:769–784. doi: 10.1085/jgp.80.5.769. [DOI] [PMC free article] [PubMed] [Google Scholar]
- 11.Garfin SR, Tipton CM, Mubarak SJ, Woo SL, Hargens AR, Akeson WH. Role of fascia in maintenance of muscle tension and pressure. J Appl Physiol. 1981;51:317–320. doi: 10.1152/jappl.1981.51.2.317. [DOI] [PubMed] [Google Scholar]
- 12.Gillis GB, Flynn JP, McGuigan P, Biewener AA. Patterns of strain and activation in the thigh muscles of goats across gaits during level locomotion. J Exp Biol. 2005;208:4599–4611. doi: 10.1242/jeb.01940. [DOI] [PubMed] [Google Scholar]
- 13.Hargens AR, McClure AG, Skyhar MJ, Lieber RL, Gershuni DH, Akeson WH. Local compression patterns beneath pneumatic tourniquets applied to arms and thighs of human cadavera. J Orthop Res. 1987;5:247–252. doi: 10.1002/jor.1100050211. [DOI] [PubMed] [Google Scholar]
- 14.Hargens AR, Akeson WH, Mubarak SJ, Owen CA, Gershuni DH, Garfin SR, et al. Kappa Delta Award paper. Tissue fluid pressures: from basic research tools to clinical applications. J Orthop Res. 1989;7:902–909. doi: 10.1002/jor.1100070617. [DOI] [PubMed] [Google Scholar]
- 15.Hill AV. The heat of shortening and the dynamic constants of muscle. Proc R Soc Lond B Biol Sci. 1938;126:136–195. doi: 10.1098/rspb.1949.0019. [DOI] [PubMed] [Google Scholar]
- 16.Hill AV. The pressure developed in muscle during contraction. J Physiol (Lond) 1948;107:518–526. doi: 10.1113/jphysiol.1948.sp004296. [DOI] [PMC free article] [PubMed] [Google Scholar]
- 17.Hill AV. The mechanics of active muscle. Proc R Soc Lond B Biol Sci. 1953;141:104–117. doi: 10.1098/rspb.1953.0027. [DOI] [PubMed] [Google Scholar]
- 18.Katz B. The relation between force and speed in muscular contraction. J Physiol (Lond) 1939;96:45–64. doi: 10.1113/jphysiol.1939.sp003756. [DOI] [PMC free article] [PubMed] [Google Scholar]
- 19.Kaufman KR, Wavering T, Morrow D, Davis J, Lieber RL. Performance characteristics of a microsensor for intramuscular pressure measurement. J Biomech. 2003;36:283–287. doi: 10.1016/s0021-9290(02)00321-4. [DOI] [PubMed] [Google Scholar]
- 20.Lieber RL, Blevins FT. Skeletal muscle architecture of the rabbit hindlimb: functional implications of muscle design. J Morphol. 1989;199:93–101. doi: 10.1002/jmor.1051990108. [DOI] [PubMed] [Google Scholar]
- 21.Lieber RL, McKee-Woodburn T, Fridén J. Muscle damage induced by eccentric contractions of 25% strain. J Appl Physiol. 1991;70:2498–2507. doi: 10.1152/jappl.1991.70.6.2498. [DOI] [PubMed] [Google Scholar]
- 22.Lieber RL, Fridén J. Muscle damage is not a function of muscle force but active muscle strain. J Appl Physiol. 1993;74:520–526. doi: 10.1152/jappl.1993.74.2.520. [DOI] [PubMed] [Google Scholar]
- 23.Nakhostine M, Styf JR, van Leuven S, Hargens AR, Gershuni DH. Intramuscular pressure varies with depth. The tibialis anterior muscle studied in 12 volunteers. Acta Orthop Scand. 1993;64:377–381. doi: 10.3109/17453679308993649. [DOI] [PubMed] [Google Scholar]
- 24.Pedowitz RA, Hargens AR, Mubarak SJ, Gershuni DH. Modified criteria for the objective diagnosis of chronic compartment syndrome of the leg. Am J Sports Med. 1990;18:35–40. doi: 10.1177/036354659001800106. [DOI] [PubMed] [Google Scholar]
- 25.Sacks RD, Roy RR. Architecture of the hindlimb muscles of cats: functional significance. J Morphol. 1982;173:185–195. doi: 10.1002/jmor.1051730206. [DOI] [PubMed] [Google Scholar]
- 26.Sejersted OM, Hargens AR, Kardel KR, Blom P, Jensen O, Hermansen L. Intramuscular fluid pressure during isometric contraction of human skeletal muscle. J Appl Physiol. 1984;56:287–295. doi: 10.1152/jappl.1984.56.2.287. [DOI] [PubMed] [Google Scholar]
- 27.Styf JR, Korner LM. Chronic anterior-compartment syndrome of the leg. Results of treatment by fasciotomy. J Bone Joint Surg Am. 1986;68:1338–1347. [PubMed] [Google Scholar]
Associated Data
This section collects any data citations, data availability statements, or supplementary materials included in this article.


