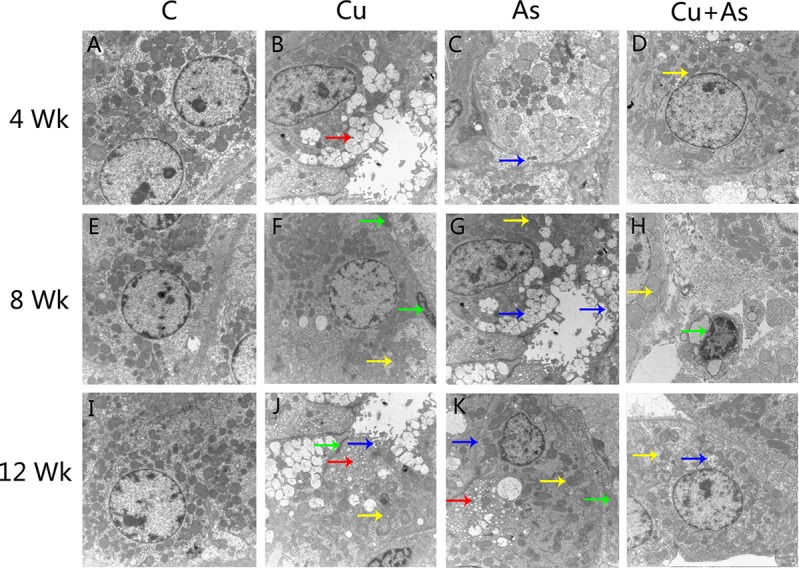
Figure 1. Ultrastructural changes during experiment (× 10000).

Arrows: red: Vacuolization, yellow: mitochondrial swelling, blue: biomembrane damage, green: high density electron dense deposits.

Arrows: red: Vacuolization, yellow: mitochondrial swelling, blue: biomembrane damage, green: high density electron dense deposits.