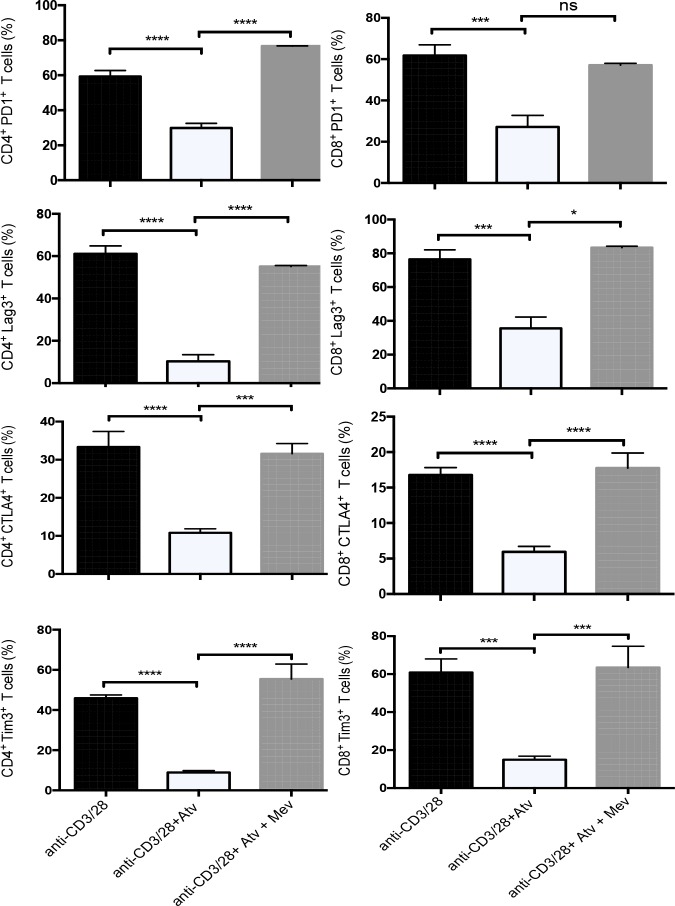
Figure 7. Downregulation of co-inhibitory receptors by atorvastatin is reversed by L-mevalonate.
Bar plots showing percentage of co-inhibitory receptors expressed by CD4+ and CD8+ T cells following α-CD3/CD28-stimulation (48hrs) in the presence and absence of atorvastatin and/or L-mevalonate (100μM) compared to controls. Data from three independent experiments. Bar, mean ± one standard error. P values are defined by * (P ≤ 0.05), *** (P < 0.001) and **** (P < 0.0001).

