

Abstract
Determining the discrepancy between chronological and physiological age of patients is central to preventative and personalized care. Electronic medical records (EMR) provide rich information about the patient physiological state, but it is unclear whether such information can be predictive of chronological age. Here we present a deep learning model the uses vital signs and lab tests contained within the EMR of Mount Sinai Health System (MSHS) to predict chronological age. The model is trained on 377,686 EMR from patients of ages 18–85 years old. The discrepancy between the predicted and recorded chronological age is then used as a proxy to estimate physiological age. Overall, the model can predict the chronological age of patients with a standard deviation error of ~7 years. The ages of the youngest and oldest patients were more accurately predicted, while patients of ages ranging between 40 and 60 years were the least accurately predicted. Patients with the largest discrepancy between their physiological and chronological age were further inspected. The patients predicted to be significantly older than their chronological age have higher systolic blood pressure, higher cholesterol, damaged liver, and anemia. In contrast, patients predicted to be younger than their chronological age have lower blood pressure and shorter stature among other indicators; both groups display lower weight than the population average. Using information from ~10,000 patients from the entire cohort who have been also profiled with SNP arrays, genome-wide association study (GWAS) uncover several novel genetic variants associated with aging. In particular, significant variants were mapped to genes known to be associated with inflammation, hypertension, lipid metabolism, height, and increased lifespan in mice. Several genes with missense mutations were identified as novel candidate aging genes. In conclusion, we demonstrate how EMR data can be used to assess overall health via a scale that is based on deviation from the patient’s predicted chronological age.
Graphical Abstract
1. Introduction
While there is strong correlation between physiological age and chronological age, it is well established that these can be different in individuals [1]. Physiological age is a useful metric because it reflects the general health status of a patient; however, estimating physiological age is not trivial [2]. Multiple efforts have been made to estimate physiological age by combining physiological indicators such as physical activity level, mental health, nutrition, and medications [1–8]. The aging process is characterized by a variety of physiological and molecular changes at the cell and tissue levels [9]. At the tissue level, anemia, osteoporosis, and decrease in muscle fiber are induced due to the exhaustion of the somatic stem cell pool. At the cellular level, among other mechanisms, aging induces the loss of proteostasis, mitochondrial dysfunction, and altered intercellular communication that induces inflammation. Genetic variations and changes in gene expression have been studied in the context of aging. Genome-wide association studies (GWAS) and gene knockout studies have uncovered genetic variants and genes that are associated with extended lifespan in humans and model organisms, such as yeast, fly, worm, and mice. Several manually curated resources list genes associated with aging; for example, GenAge [10] and LongevityMap [11]. In addition, gene expression analysis of human tissues across individuals of different age, generated by the GTEx project [12], was utilized for identifying age-associated genes in different tissues [13]. Another study examined the correlation between the transcription level of genes, and chronological age, to determine a “transcriptomic age” [14]. Similarly, it was demonstrated that DNA methylation is highly predictive of chronological age [15].
At the same time, data from electronic medical record (EMR), including disease diagnoses and biomedical trait values, can be used for characterizing the human phenotype. However, associating human phenotypes from EMR data is challenging because of data incompleteness and data inaccuracy [16]. To overcome some of these challenges, the Electronic MEdical Records and GEnomics (eMERGE) network [17] has developed and validated many EMR-phenotyping algorithms stored in the Phenotype Knowledgebase (PheKB) [18]. Many of these algorithms are rule-based. These algorithms operate on diverse types of EMR data, including diagnoses, procedures, medications, vital signs, laboratory tests, as well as clinical notes processed by natural language processing (NLP) algorithms [19]. Recently, a growing number of statistical methods, employing supervised and unsupervised machine learning approaches, have been proposed for various EMR-phenotyping tasks such as identifying cohorts with certain diseases and predicting patient survival [20]. Computationally, traditional linear statistical models do not scale well to very large datasets with missing values such as EMR data which contain millions of data points. With advent algorithms that employ deep learning, through nonlinear transformations, it is now possible to better handle data incompleteness, inaccuracy, and scalability to learn from millions of EMR. For instance, DeepPatient uses denoising Autoencoder (dAE) to perform unsupervised feature extraction from EMR [21]. Most relevant to the work presented here is a study that implemented a Least Angle Regression (LARS) model to predict the age of adolescents using 39 biomarkers from a blood test [5]. The model identified alkaline phosphatase and creatinine levels as the most predictive biomarkers for both male and female age; hematocrit and mean-cell-volume levels were found to be the most predictive markers for males, whereas total serum globulin was the most predictive marker for females.
Here we present a predictive model of chronological age utilizing deep learning applied to the Mount Sinai Health System (MSHS) EMR data. Physiological measurements, including vital signs and lab tests from the EMR, were used as features to train the model. The predictive model performs well to predict the age of most patients, but for some patients the predictor makes a significantly large error. These outliers define two unique cohorts: those patients that display significant discrepancy between their predicted age and their chronological age, either predicted to be much younger than their chronological age, or much older. By investigating the unique features of these two cohorts, we confirmed known, and discovered novel, clinical characteristics and medicines associated with aging. Furthermore, we performed GWAS analysis on these cohorts comparing them to the rest of the population to identify genetic variants that correlate with both accelerated and delayed aging phenotypes.
2. Data and Methods
2.1. EMR data preprocessing
The MSHS-EMR data used for this project contain over 4 million de-identified patient records spanning from 1980 to March 2015, covering 85 unique vital signs and 2,968 unique lab test variables. Age in years was calculated for all patients based on year of birth. Rare vital signs and lab test variables that appeared in less than 5 EMR were removed, resulting in 30 vital signs and 1,891 lab tests for subsequent analyses. We only included patients with at least 10 visits and excluded patients with no vital signs or lab tests, resulting in 456,748 patients. Further filtering retaining only adults, ages 18 to 100 years, resulted in a final set of 385,918 individual patients. The median was used to aggregate vital signs and lab tests from multiple visits. Chronological age at the time of the latest clinical visit was used for age prediction for each patient. Missing data across all feature set variables were first filled with the population average, and then z-score transformed.
2.2. Predictive model for aging
We implemented an artificial neural network (ANN) regression model that implements a feed-forward neural network architecture consisting of three hidden layers, each containing 1,000 sigmoid activation units. There was a 40% dropout probability between each layer. During training of the ANN, weights were initialized using the method developed by Glorot and Bengio [22]. The model was trained for 20 epochs with mini-batch size of 128 using Adam as an optimizer [23]. Training samples were shuffled before each epoch. 10-fold cross-validation (CV) was applied to train and evaluate the performance of the model. Mean absolute error (MAE) of the discrepancy between the predicted age and the real age in years was used to evaluate performance. We implemented the ANN model using Keras [24] with Theano [25].
2.3. Identifying cohorts with significant discrepancy between predicted and chronological age
To identify patients with significantly older or younger predicted age compared with their chronological age, we first filtered out patients older than 85, leading to 377,686 patients with ages between 18 and 85. Then, Z-test was performed to quantify the error between the predicted age and chronological age, with the null hypothesis that the error is 0. Patients that are significantly older (group O) or younger (group Y) than their chorological age are called if the error is significantly smaller or larger than 0 with a p-value < 0.05.
2.4. EMR-wide association analyses
To perform the EMR-wide association analyses, rare features from the patients’ diagnoses, including procedures), medicines, lab tests, and vital signs characterizing fewer than 500 patients were excluded. Patients were associated with diagnoses or medicines from their EMR regardless of the time of encounter. To standardize nomenclature, we used the International Classification of Disease (ICD)-9 code as the diagnostic and procedure representation, and generic names for medicines. The Fisher exact test was performed for evaluating each discrete feature, including diagnosis, procedure and medicine, to test whether those are enriched within the younger/older groups versus the entire patient population. For continuous variables, such as those from lab tests and vital signs, the Wilcoxon rank sum test was applied. Multiple hypothesis testing correction was performed with the Benjamini-Hochberg procedure [26].
2.5. Genome-wide association study (GWAS)
The Charles Bronfman Institute of Personalized Medicine Mount Sinai BioMe biobank is comprised of over 32,000 patients who also have records in the MSHS-EMR. For this study, we included a subset of 9,897 individuals. These patients have been genotyped using the Illumina Human Omni Express Exome Bead-8 BeadChip v1.1, which has 866,864 markers per sample. The analysis included first performing phasing of the genotype data using SHAPEIT2 (r644) [27] and imputing using IMPUTE2 v2.3 [28] with chunk size of 5Mb. For the imputation reference panel, the 1000 Genomes Project Phase 3 data was used. Next, quality control (QC) steps were applied to filter the genetic data for the subsequent analyses. Variants that had low imputation scores were removed, specifically any sites with INFO scores <0.3 from IMPUTE2. Then filtered variants that were rare, specifically minor allele frequency (MAF) <0.01, were removed. To determine the effect of genotype on the aging phenotype of interest, an additive, linear mixed model GWAS was performed with genotype set as either 0, 1, or 2 referring to the number of variant alleles using the Efficient Mixed-Model Association eXpedited software (EMMAX; beta version, March 7,2010) [29]. Due to high levels of cryptic relatedness within the population, a kinship matrix was incorporated into the mixed model. Specifically, the procedures outlined by Kang et al. [29] were followed to calculate an n x n matrix of pairwise genetic relatedness. The entries in the matrix were corrected for age and sex. Due to the high racial diversity of the cohort, principal component analysis (PCA) was utilized for dimensionality reduction of the genetic data to obtain a metric for genetic ancestry to include as covariates in the model. Several QC steps were performed on the genotype data before generating principal components (PC): rare variants (MAF <0.01), thinned linkage disequilibrium (r2 of 0.3), as well as human leukocyte antigen and lactase genetic regions were filtered out. The data was further cleaned for site and individual level missingness (threshold of 95%). PCA was performed with these cleaned data by using the EIGENSOFT smartpca tool [30, 31], training the space on the individuals with European ancestry from Utah (CEU); Yoruba in Ibidan, Nigeria (YRI); and Han Chinese in Beijing, China (CHB), which were used as European, African, and East Asian ancestry reference panels from the 1000 Genomes Project, respectively.
2.6. Enrichment analyses of SNPs
SNPs with suggestive significant associations (p-value < 5e−6) were annotated to genes using the R package VariantAnnotation [32], with intergenic SNPs excluded. The direction of effect for the SNPs that were enriched in either population was determined by the sign of the BETA values. Enrichment analysis was performed with Enrichr [33, 34]. MetaXcan [35] was also used to analyze the GWAS results using the transcriptome prediction models generated from the GTEx resource [12].
3. Results
3.1. Descriptive statistics of physiological variables and their relation to chronological age
The MSHS patient cohort analyzed for this study contains ~60% women and ~40% men, with 41% Caucasians, 16.9% African Americans, 5.4% Hispanics, 3.9% Asians, and 19.5% unclassified (Table 1, first column). We first performed correlation analysis to identify vital signs and lab tests that are correlated with chronological age across the entire cohort. Such correlation analysis was applied to the entire cohort as well as to gender-specific groups. Among all the vital signs, pulse pressure, which is the difference between systolic blood pressure and diastolic blood pressure, and systolic blood pressure, show the strongest positive correlation with chronological age for both genders (Fig 1A). Interestingly, we also observed positive correlation between diastolic blood pressure in males but not in females (Fig 1A). In order to more accurately interpret those correlations, we plotted the trends of blood pressure over chronological age across the entire cohort using the locally weighted scatterplot smoothing (LOWESS) algorithm [36]. We find that both pulse pressure and systolic blood pressure almost monotonically increase with age in both genders, whereas diastolic blood pressure appears to increase with age, similarly to systolic blood pressure, but begins to decrease around age 50 (Fig 1B–D). Blood pressure generally increases with age due to increased arterial wall stiffening. However, the decrease in diastolic blood pressure around age 50 may be explained by the effect of blood pressure medications. It is well known that systolic blood pressure is less affected by antihypertensive medications. The correlation analysis also identifies lab tests that are highly positively correlated with age, these include urea nitrogen, glucose, hemoglobin A1C, PROTIME/INR; whereas lab tests that are most negatively correlated with age are glomerular filtration rate (GFR) estimate, albumin, total protein, red blood cell count and hematocrit (Fig. 2A). Urea nitrogen and GFR estimate are both measures of renal function (Fig. 2B–C). Glucose and hemoglobin A1C (Fig. 2D–E) are both markers of glucose intolerance and diabetes mellitus, and their positive correlation with age suggests gradual increase in glucose intolerance and higher risk to develop diabetes with age. PROTIME/INR are tests measuring blood clotting ability; their increase with age (Fig. 2F) is likely due to the use of anticoagulation medications to treat diseases such as stroke and atrial fibrillation. Hematocrit and red blood cell count both reflect the level of red blood cells in the blood; their decrease with age (Fig 2G) is likely due decrease in oxygen demand in males as they age. Interestingly, in females, hematocrit is much lower, and it decreases until around age 40, most probably because of blood dilution during pregnancy. Albumin, the main protein component of the blood, and total protein decrease in levels with age (Fig 2H–I) is likely due to a decrease in nutritional status in older patients.
Table 1. Summary statistics for demographics of the cohorts in this study.
N: Normal; Y: Young; O: Old.
| Cohorts | ||||
|---|---|---|---|---|
|
| ||||
| Variable | All | N | Y | O |
| Total | 385,918 | 363,235 | 10,817 | 11,866 |
|
| ||||
| Chronological Age | ||||
|
| ||||
| 25% quartile | 35.9 | 36.4 | 60.0 | 24.3 |
| median | 52.4 | 52.5 | 69.0 | 29.9 |
| 75% quartile | 66.3 | 66.2 | 78.2 | 37.5 |
|
| ||||
| Error (chronological - predicted age) | ||||
|
| ||||
| 25% quartile | −5.7 | −5.2 | 21.9 | −29.2 |
| median | 0.0 | 0.1 | 24.5 | −24.7 |
| 75% quartile | 5.8 | 5.4 | 29.1 | −22.0 |
|
| ||||
| Gender | ||||
|
| ||||
| Male | 40.4% | 40.0% | 39.6% | 53.1% |
| Female | 59.6% | 60.0% | 60.4% | 46.9% |
|
| ||||
| Race | ||||
|
| ||||
| Caucasian (White) | 41.0% | 40.9% | 48.2% | 38.5% |
| African American (Black) | 16.9% | 17.0% | 13.7% | 17.2% |
| Asian | 3.9% | 3.9% | 3.1% | 3.9% |
| Other | 19.2% | 19.4% | 15.0% | 19.1% |
| Hispanic/Latino | 5.4% | 5.4% | 4.7% | 6.3% |
| Native American | 0.2% | 0.2% | 0.3% | 0.2% |
| Pacific Islander | 0.1% | 0.1% | 0.1% | 0.1% |
Figure 1. Vital signs and chronological age.

(A) Pearson’s correlation coefficients between individual vital signs and chronological age across all, female, and male patients in three columns. Vital signs are sorted by descending order of their correlation coefficients with all patients. The smoothened trends of pulse pressure, systolic blood pressure and diastolic blood pressure across chronological age for females (blue) and males (green) are shown in panels B, C and D, respectively. The age range of patients used to produce these figures is 18 to 100 years.
Figure 2. Exploration of lab tests and chronological age.

(A) Pearson’s correlation coefficients between individual lab tests and chronological age across all, female, and male patients in the three columns. Lab tests are sorted by descending order by the correlation coefficients with all patients. (B–I). The smoothened trends of representative lab tests across chronological age from female (blue) and male (green) patients. The age range of patients used to produce these figures is 18 to 100 years.
To obtain a global view of the correlations between physiological measurements and chronological age, we performed unsupervised hierarchical clustering on the LOWESS smoothened trends of the most common physiological measurements across all patients. This clustering method uncovers different modes of trends that cluster different physiological measurements with similar trends (Fig 3). Specifically, we observe a cluster of nutritional status markers, which includes: total protein, albumin, calcium, total iron binding capacity (TIBC), and platelets. These nutritional markers generally decrease with age. Another cluster of variables has a bell shape curve that generally increase with age before 50–60, and then decrease with age after that inflection point. This cluster contains variables are related to body mass index (BMI), including weight, height, diastolic blood pressure, cholesterol, low density/high density lipoprotein (LDL/HDL) ratio, triglycerides, and glutamyl transferanse (gamma GT). Higher values for these measurements are known to increase risk for cardiovascular disease. We speculate that their decrease after 50–60 could be the result of decreased BMI, which is due to survival bias which stems from premature mortality of obese patients [37]. There is also a cluster of variables that monotonically increase with age. These include: mean corpuscular volume, PROTIME/INR, urea nitrogen, creatinine, pulse pressure, ferritin, glucose, hemoglobin A1C, and systolic blood pressure. Variables in this cluster represent diverse mechanisms such as decreased renal function, attributed to urea nitrogen, and creatinine; increased glucose intolerance, attributed to increase in glucose and hemoglobin A1C levels; and increased inflammation, which is reflected in an increase in ferritin. We also examined the trends of all physiological variables across gender. While most variables highly correlate between males and females, there are a few notable exceptions (Fig S1). These differences could be attributed to pregnancy, for example, monocytes, neutrophils, and white blood cell; or signs of menopause, for example, calcium and vitamin D. Females are usually treated with calcium and vitamin D during menopause to prevent osteoporosis.
Figure 3. Hierarchical clustering of physiological measurements across chronological age.

The trends of physiological measurements across chronological age for all the 385,918 adult patients analyzed were derived from applying the locally weighted scatterplot smoothing (LOWESS) algorithm. Prior to performing hierarchical clustering, the trends for all measurements were z-score transformed. Hierarchical clustering was performed using Euclidean distance and average as the linkage function. Physiological measurements with similar trends across age are clustered together. The age range of patients used to produce these figures is 18 to 100 years.
3.2. Leveraging physiological measurements to predict chronological age
Next, to leverage on the observation that physiological variables trend predictively with age, we performed regression analysis to evaluate how the combination of those measured variables can be applied to predict chronological age. To achieve this, we first compared the performance of different regression models including: Random Forest (RF), Elastic Nets, and deep artificial neural networks (ANN). We found that ANN yield the best performance with increase of sample size compared to RF and Elastic Nets (Fig S2A). The training time for ANN is also much shorter than RF (Fig S2B).
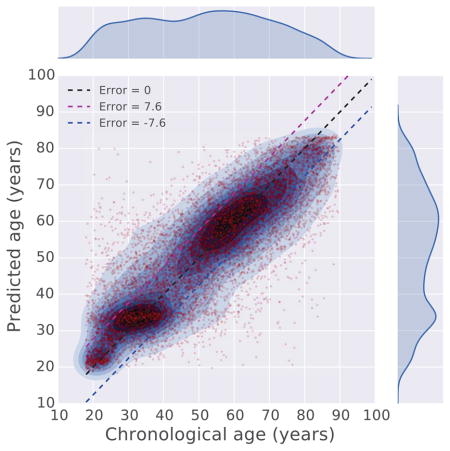
We therefore used the ANN deep learning regression model for the prediction task. Training the regressor was achieved using 90% of the records, while 10% was used for cross validation. The results show that a combination of the vital signs and lab tests is more predictive of chronological age than using each data type alone (Fig. S3). The final regressor was trained through 50 epochs and achieved a mean absolute error of 7.58 years (Fig. S4). Comparing chronological age with predicted age, we observe that the regression model accurately predicts the age for the vast majority of patients, whereas patients with chronological age between 40 and 55 are less accurately predicted (Fig 4, S5A). Speculatively, this might be due to the assertion that during this age range, genetic and environmental factors are most influential. In other words, chronological and physiological age is least predictive during this period of life. From observing the boundaries of the prediction error (blue line in Fig S5A), we find that a segment of patients below 40, in general, are predicted to be older, and a segment of patients above 60, in general, are predicted to be younger. The absolute prediction error (green line in Fig S5A) brings out the absolute prediction accuracy of the model across the entire age range, with high error for patients above 85. This is likely due to having less EMR data after that age. We also observe that the prediction error is not correlated to the length of the medical record history for patients (Fig. S5B), suggesting that the length of medical history has little influence on the performance and behavior of the regressor.
Figure 4. Comparison between chronological age and predicted age.

The chronological age and predicted age of 10,000 randomly sampled patients are plotted against each other in a scatter plot. To show the densities of the data points, kernel density estimation (KDE) is applied to overlay contours on top of the scatter plot. The figure also visualizes the outliers where there is a large discrepancy between the predicted and chronological age. The age range of patients used to produce these figures is 18 to 100 years.
3.3. Cohorts with discordant physiological and chronological age
To further explore the results from the regressor, we identified the cohorts of patients at the margins (Fig 4); those patients who display the largest error between their real chronological age and the age predicted by the model. Of these, 11,712 were placed in a group of predicted age significantly older than their real age (group O), and 10,611 were placed in a group of predicted age significantly younger than their real age (group Y) (Fig. S6). To rule out the possibility that patients from those two groups are merely due to poor prediction performance of the regression model, we performed the Hotelling’s T-squared test, a multivariate generalization of Welch’s t-test, to compare whether the physiological measurements for patients in group O and group Y are different from those patients without significant differences between their predicted age and their chronological age (group N) (Fig S7). As expected, we found that members of group O are similar to older members of group N, and members of group Y are similar to younger members of N (Fig S7). Interestingly, group O has significantly fewer women (p-value=6.9e−175), whereas members of group Y has significantly more Caucasians (p-value = 6.4e−52) and fewer African Americans (p-value=2.0e−19) (Table 1). It was previously suggested that women age slower than men [38], whereas some of these other differences might be explained by the demographics associated with economic disparity within the Mount Sinai’s patient cohort. The majority cohort population of the MSHS data that was analyzed originates from three different New York City neighborhoods with sharp demographic differences. The cohort contains patients from the Upper East Side which has a majority of Caucasian population, East Harlem which has a majority of Hispanic population, and Central Harlem with a majority of African American population. These unique diverse populations may confound the analysis results.
3.4. Characterization of groups O and Y using EMR-wide association study
Next, we aimed to characterize the O and Y groups by comparing them with group N. We performed Wilcoxon rank sum tests to compare vital signs (Table S1) and lab tests (Table S2) between the different groups of patients. In Table S1 we only included frequent vital signs that are profiled in at least 10% of the patients. We also performed Fisher exact tests to identify diagnosis codes and procedures (Table S3), as well as prescribed medicines (Table S4) that are enriched in groups O and Y compared to N.
The significant findings with interpretations for patients in group O are tabulated below:
Increased prevalence of hypertension and cardiovascular disorders: patients of both genders in this group have significantly higher systolic blood pressure and pulse pressure. Consistently, they are disproportionally diagnosed with hypertension. The enrichment of diagnoses such as internal hemorrhoids, lumbago, which is a painful condition affecting the lower spine, and sciatica, which is pain along the lower back projected to the legs, also implies a sedentary lifestyle, which is a known risk factor for hypertension. The observed high levels of PROTIME/INR/APTT lab tests are consistent with the prescription of the anticoagulant drug alteplase, as well as the diagnosis with hyperlipidemia and carotid artery stenosis, which indicate that patients are likely prescribed preventive treatment for cardiovascular diseases such as myocardial infarction and atrial fibrillation. The top enriched prescribed drugs also include cholesterol lowering drugs including ezetimibe and pravastatin. Interestingly, the levels of cholesterol and triglycerides in group O are lower compared to group N, which suggest that these are effects of cholesterol lowering medicines. Another possible explanation is that cholesterol levels are driven by BMI (Fig 3), and patients in group O have significantly lower BMI compared to group N. Patients in group O are also more likely to be prescribed sildenafil, vasodilator and tadalafil, all of which are indicated for erectile dysfunction and high blood pressure in the lungs.
Increased chronic inflammation: the decrease of lymphocytes and proliferation of inflammatory cells including neutrophils and monocytes are signs of age-related chronic inflammation [39]. The higher level of ferritin also suggests increased inflammatory processes. The chronic inflammation possibly leads to the enrichment of chronic obstructive pulmonary disease (COPD) including emphysema chronic obstructive asthma and obstructive chronic bronchitis, as well as enriched prescription of treatment with steroids such as fluticasone/salmeterol and hydrocortisone.
Possibility of chronic anemia: patients in group O also have significantly lower blood test readouts including lower red blood cells, platelets, hemoglobin, hematocrit and serum iron, all of which suggest chronic anemia. High levels of Vitamin B12 and ferritin are also observed in this group. This is seemingly contradictory to the indicators of anemia, but could be a related physiological mechanisms to compensate for the loss of red blood cells.
Poor nutritional status: multiple lines of evidence from physiological measurements and prescribed medicines also suggest that patients in group O suffer from decreased nutritional status. Many of the physiological variables in the nutritional status clusters identified (Fig 3), such as BMI, albumin, calcium, total iron binding capacity (TIBC) and hemoglobin, have significantly lower values compared to patients in group N of the same chronological age range. The lack of nutrition probably leads to the enrichment of dietary supplements prescribed such as calcium carbonate/Vitamin D3 and multivitamins.
Decreased kidney function: the significant differences in many lab tests related to kidney function, including increased urea nitrogen, creatinine, and uric acid, as well as decreased GFR estimate, indicate that patients in the O group have decreased kidney function. Consistent with these observations, we also found that patients in this group are significantly enriched for kidney transplant procedure, as well as prescription of immunosuppressants usually used before and after organ transplantation such as mycophenolate mofetil, methylprednisolone and mercaptopurine.
Potential liver damage: the increased levels of multiple liver enzymes, including gamma glutamyl transferase, ALT (SGPT), ALK phosphatase, and LD (LDH) lactate dehydrogenase suggest liver damage.
In general, patients in group Y have opposite physiological patterns compared to group O for many of the physiological measurements, but there are few exceptions. The significant findings with interpretations for patients in group Y are tabulated below:
Low risk for hypertension and hyperlipidemia: patients in group Y have significantly lower blood pressure, BMI, body weight and lipids levels including cholesterol and triglycerides, indicating they have lower risk for developing hypertension and hyperlipidemia.
Healthy kidney and liver functions: lab tests that shows significant differences also indicate healthy kidney function, such as lower levels of creatinine, urea nitrogen, uric acid and higher level of GFR estimate. The healthy liver indicators are lower level of liver enzymes in the blood including gamma glutamyl transferase and ALT (SGPT). Interestingly, indicators of glucose tolerance, including glucose and hemoglobin A1C, also have significantly lower levels compared to group N, suggesting lower risk for developing diabetes.
Healthier nutritional status: as oppose to the observations from group O, patients in group Y demonstrate higher levels of positive nutritional status indicators such as higher levels of albumin, red blood cells, hematocrit, hemoglobin, platelets and calcium.
Higher risk for venereal diseases: patients in group Y are enriched for screening for venereal diseases; female patients are enriched for irregular menstrual cycle, abortion, and unwanted pregnancy. Patients in this group are also enriched for HPV vaccine and birth control pills for females, suggesting members in group Y may be more sexually active and as a result at high risk for venereal diseases.
Other enriched diagnoses and medicines for group Y include acute pharyngitis, fluconazole, a medication that is used to treat fungal infection, and furosemide, a drug to treat edema and swelling. Interestingly, tobacco use is also enriched in group Y. This should be viewed with caution because it is well established that tobacco use has a positive correlation with mortality [40]. It worth noting that the model does not predict mortality, therefore, although more patients are proportionally found within the group Y, tobacco use can still be associated with higher mortality.
In summary, both groups have significantly lower BMI, body weight, and lipid levels. Despite their young chronological age, the physiological profiles of patients in group O resembles profiles of patients that are above 70 (Fig 3), with only few exceptions such as high hemoglobin A1C. On the contrary, the physiological profiles of members of group Y are more similar to patients younger than 50.
3.5. GWAS identified genes and pathways enriched in groups O and Y
Next, we performed GWAS analysis comparing the O and Y groups to the general population. Of the patients whom we analyzed, 10,123 have genomic profiling data available from the Charles Bronfman Institute of Personalized Medicine Mount Sinai BioMe BioBank. From those, 146 patients belong to the O group, and 197 to the Y group. Using a linear mixed model to control for cryptic relatedness, population structure, age, and gender, we annotated those SNPs that were identified as significant (Figs. S8 and S9). The significance cutoff was set to a p-value of 5e−6. To interpret the functions of those enriched SNPs, we conducted the following analyses. First, we examined coding variants that cause missense mutations. We found five genes in the O group and two genes in the Y group that harbor significantly enriched missense mutation SNPs (Table 2). Next, we queried gene sets created from significant SNPs, and the genes within their proximity that were found in intronic and promoter regions. These gene sets were subjected to enrichment analysis with Enrichr [33, 34] (Table S5–6). Finally, using the software MetaXcan [35] to summarize the GWAS results from the variant level to the gene level using eQTLs generated from GTEx [12], we identified significantly up- and down-regulated genes predicted to be aberrantly expressed in different tissues (Table S7–10).
Table 2. Significantly enriched SNPs causing missense mutations.
BETA: fitted coefficient; SE: standard error for BETA; P: p-value.
| Position | Gene ID | Strand | Gene Symbol | SNP | BETA | SE | P | Comparison |
|---|---|---|---|---|---|---|---|---|
| chr22:42781198 | 150372 | − | NFAM1 | rs151280792:42781198:C:G | 0.0321 | 0.0062 | 1.97E-07 | O vs N |
| chr9:127213445 | 347088 | + | ADGRD2 | rs76928670:127213445:G:A | 0.0358 | 0.0070 | 3.72E -07 | O vs N |
| chr9:34655629 | 3590 | + | IL11RA | rs76429508:34655629:C:T | 0.0402 | 0.0079 | 4.20E-07 | O vs N |
| chr16:88600792 | 161882 | + | ZFPM1 | rs75878389:88600792:C:T | 0.0197 | 0.0041 | 1.74E-06 | O vs N |
| chr10:115535561 | 79949 | + | PLEKHS1 | rs34024791:115535561:G:A | 0.0220 | 0.0047 | 2.22E-06 | O vs N |
| chr1:52231560 | 114883 | + | OSBPL9 | rs61739207:52231560:C:T | 0.0523 | 0.0100 | 1.59E-07 | Y vs N |
| chr1:247614606 | 127623 | − | OR2B11 | rs74583618:247614606:G:A | 0.0403 | 0.0082 | 9.26E-07 | Y vs N |
Below we summarize the findings and their interpretations for all the variants identified to be enriched in group O:
Altered inflammation-related genes and pathways: out of the five genes found to harbor missense mutations in their coding regions, NFAM1 and IL11RA are both implicated in inflammatory-related pathways: NFAM1 is a known regulator of IL-13 and TNF-alpha, and it is involved in regulating B-cell development [41]; whereas IL11RA is a cytokine receptor and a member of the Jak/STAT signaling pathway [42]. Moreover, inflammatory pathways such as PI3K-Akt signaling, AGE-RAGE signaling, and inflammatory mediator regulation of TRP channels are also enriched among the set of genes found in close proximity to the enriched SNPs (Table S5). This observation is consistent with the clinical indicators that suggest that patients in group O are more likely to suffer from chronic-inflammation. It is possible that the identified genetic variants in the inflammation-related genes make the patients more prone to premature age-related chronic inflammation.
Anemia: Another missense mutation that was found to be significantly enriched is in the coding region of ZFPM1. ZFPM1 is known to be involved in platelet activation and anemia [43]. Our analysis predicts that this SNP in ZFPM1 may impair the normal function of ZFPM1 and this abnormality makes patients harboring this variant to have increased risk to develop anemia.
Hypertension, cardiovascular disease and obesity: out of the five significant SNPs causing missense mutations, one is located in the coding region of PLEKHS1, which might be linked to obesity [44]. Furthermore, the enrichment analysis of SNPs in gene proximity also suggest that there is significant overlap between these genes and genes previously associated with myocardial infarction, blood pressure, and high cholesterol level from GWAS studies collected in dbGAP [45] (Table S5). This observation is also consistent with the clinical indicators that have over-representation for risk for hypertension and cardiovascular disease, indicating that the genetic variants could partially explain the increased risk.
Decrease in unfolded protein response (UPR): from the gene expression level association analysis, we found downregulation of genes in adipose tissue, and enrichment for UPR based on Reactome [46] (Table S10). The UPR response is one of the hallmarks of the aging process [9].
The variants found to be enriched in group Y and their interpretation are listed below:
Variants protective against hypertension and obesity: a SNP enriched in group Y is found to cause a missense mutation in the gene OSBPL9. OSBPL9 is associated with lipid transport and, as a result, it is known to be involved in regulating body weight [47]. Moreover, the gene set created from SNPs in proximity to genes is also enriched for genes known to be associated with blood pressure and BMI based on a gene set library created from dbGAP (Table S6). Together, and with the observation that patients in this group have lower blood pressure and BMI, these enriched genetic variants could have a protective role against hypertension and obesity.
Suppressed inflammatory response: genes in proximity to significant SNPs were found to be enrich for proteoglycans and inflammatory pathways (Table S6). Furthermore, we found that inflammation-related Toll-like receptor signaling is also downregulated adipose tissue by the SNPs eQTL analysis (Table S8).
Regulation of lifespan-related genes: from the MetaScan analysis, we also found two genes, SURF1 and PPARG, predicted to be downregulated in adipose tissue by the SNPs enriched for group Y (Table S8). These two genes have been shown to extend lifespan in knockout mice. From the list of 189 genes that are predicted to be expressed at a lower level in adipose tissue (Table S9), only 63 have been knocked out in mice, and 3.17% of them have shown to increase lifespan. This is a much higher percent compared to the 0.26% for the 27 genes that are marked to extend lifespan in MGI out of 10,493 with any listed phenotype. Hence, the genes from the list of 189 without knockout mouse phenotypes are excellent candidates for future knockout experiments, and if successful, these can be potential targets for therapeutic intervention for aging. Among these are GPR156, MRGPRX2, CNGA1 and KCND3 which are targets of interest for the Illuminating the Druggable Genome Project (https://commonfund.nih.gov/idg).
4. Discussion
Here we have demonstrated how EMR data can be used to assess the overall health of patients by a scale that is based on the deviation from the patient’s predicted chronological age; this metric can be considered the patient’s physiological age. We found that a deep neural network regression model is both scalable and accurate in predicting age from thousands of features and hundreds of thousands of EMR. However, interpreting deep neural network is rather challenging. A recent study proposed an approach to interpret deep neural network models by annotating hidden units with conceivable semantic concepts by feeding the model sets of labeled training samples [48]. Similarly, our deep neural network model can potentially be interpreted by aligning the hidden units from the last hidden layer with original individual features or combinations of features. By examining the weights of the last hidden layer, one can potentially interpret how the prediction of age is made from the final hidden units. Regardless, as it is, the deep learning model that we have constructed can be implemented to inform both physicians and patients about the status of the patient physiological age as a general indicator of overall health.
Our model identified cohorts of patients with significant deviation between their predicted age and their chorological age. EMR-wide association study for those cohorts identified physiological measurements that are consistent with existing clinical knowledge about parameters that indicate accelerated or delayed aging. Such analysis also identified medicines that may affect the aging process. Since there are many potential confounding factors that are not included in the model, conclusions should be drawn carefully. For example, we used the median to aggregate physiological measurements of patients across multiple clinical visits, which removes intra-patient variation. The temporal dynamics of physiological aging at the individual level is not captured by our model and could be an interesting follow up study. Future studies that include temporal analysis could track the progression of patients on a timeline of their predicted aging. Such analyses can potentially uncover causality; for example, identifying environmental factors that influence physiological aging, which is currently missing from our model. Temporal analysis can also identify the aging rate for each patient and warn patients that display accelerated aging. One caveat of the analysis is that the patient data used to create the model is mostly from individuals who needed medical assistance. Hence, this fact alone is to likely confound the study because the general healthy population is not sampled. While the GWAS analysis performed has identified novel mutations in genes, and potential regulatory regions near genes, that are likely associated with the aging process, the sample size we have utilized is relatively small and racially heterogeneous. Further studies with larger cohorts that employ deep sequencing, and/or deeper SNP profiling are expected to become available soon. Reapplying a similar analysis on a larger cohort would confirm or refine the reported observations. Regardless of these shortcomings, our success in predicting age from medical signs and lab tests can inform physicians and their patients to assist in promoting healthier lifestyle and early detection of human disease.
Supplementary Material
Highlights.
Physiological variables recorded in >300,000 electronic medical records (EMR) were investigated for their relation to chronological age at the population scale.
An artificial neural network deep learning model was developed to predict chronological age from physiological measurements recorded in the EMR.
Cohorts with discordant predicted physiological and chronological age were identified and further analyzed.
EMR-wide association analyses and gene wide association study (GWAS) were performed to clinically and genetically characterize patients with discordant physiological age.
Acknowledgments
We want to thank Drs. Ruth Loos and Adler Perotte for useful suggestions, and acknowledge the Charles Bronfman Institute of Personalized Medicine for support and infrastructure of the BioMe biobank. This study is IRB exempt as determined by Mount Sinai PPHS office (IRB-17-02121).
Footnotes
Author contributions
ZW designed, implemented, and benchmarked the predictive deep learning model; performed the EMR-wise association analyses, interpreted part of the GWAS results, and created all figures. LL and JTD provided access to a cleaned and de-identified version of the MSHS-EMR. AI interpreted the physiological measurements and advised in regards to clinical interpretations. BSG, LL and JTD performed the GWAS analysis. AM and ZW wrote the manuscript with contributions from other co-authors. AM conceived and managed the study.
Conflict of Interest
This work was supported in part by NIH U54 CA189201 and NIH U54 HL127624. The content is solely the responsibility of the authors and does not necessarily represent the official views of the sponsors.
Publisher's Disclaimer: This is a PDF file of an unedited manuscript that has been accepted for publication. As a service to our customers we are providing this early version of the manuscript. The manuscript will undergo copyediting, typesetting, and review of the resulting proof before it is published in its final citable form. Please note that during the production process errors may be discovered which could affect the content, and all legal disclaimers that apply to the journal pertain.
References
- 1.Baker GT, III, Sprott RL. Biomarkers of aging. Experimental Gerontology. 1988;23(4–5):223–239. doi: 10.1016/0531-5565(88)90025-3. [DOI] [PubMed] [Google Scholar]
- 2.Sprott RL. Biomarkers of aging and disease: Introduction and definitions. Experimental Gerontology. 2010;45(1):2–4. doi: 10.1016/j.exger.2009.07.008. [DOI] [PubMed] [Google Scholar]
- 3.Bürkle A, Moreno-Villanueva M, Bernhard J, Blasco M, Zondag G, Hoeijmakers JHJ, Toussaint O, Grubeck-Loebenstein B, Mocchegiani E, Collino S, et al. MARK-AGE biomarkers of ageing. Mechanisms of Ageing and Development. 2015;151:2–12. doi: 10.1016/j.mad.2015.03.006. [DOI] [PubMed] [Google Scholar]
- 4.Lara J, Cooper R, Nissan J, Ginty AT, Khaw K-T, Deary IJ, Lord JM, Kuh D, Mathers JC. A proposed panel of biomarkers of healthy ageing. BMC Medicine. 2015;13(1):222. doi: 10.1186/s12916-015-0470-9. [DOI] [PMC free article] [PubMed] [Google Scholar]
- 5.Chen DP, Morgan AA, Butte AJ. Validating pathophysiological models of aging using clinical electronic medical records. Journal of Biomedical Informatics. 2010;43(3):358–364. doi: 10.1016/j.jbi.2009.11.007. [DOI] [PMC free article] [PubMed] [Google Scholar]
- 6.Simm A, Nass N, Bartling B, Hofmann B, Silber R-E, Navarrete Santos A. Potential biomarkers of ageing. Biological chemistry. 2008;389(3):257–265. doi: 10.1515/BC.2008.034. [DOI] [PubMed] [Google Scholar]
- 7.Johnson TE. Recent results: Biomarkers of aging. Experimental Gerontology. 2006;41(12):1243–1246. doi: 10.1016/j.exger.2006.09.006. [DOI] [PubMed] [Google Scholar]
- 8.Lixie E, Edgeworth J, Shamir L. Comprehensive Analysis of Large Sets of Age-Related Physiological Indicators Reveals Rapid Aging around the Age of 55 Years. Gerontology. 2015;61(6):526–533. doi: 10.1159/000381584. [DOI] [PubMed] [Google Scholar]
- 9.López-Otín C, Blasco MA, Partridge L, Serrano M, Kroemer G. The Hallmarks of Aging. Cell. 2013;153(6):1194–1217. doi: 10.1016/j.cell.2013.05.039. [DOI] [PMC free article] [PubMed] [Google Scholar]
- 10.Tacutu R, Craig T, Budovsky A, Wuttke D, Lehmann G, Taranukha D, Costa J, Fraifeld VE, de Magalhães JP. Human Ageing Genomic Resources: Integrated databases and tools for the biology and genetics of ageing. Nucleic Acids Research. 2012;41(D1):D1027–D1033. doi: 10.1093/nar/gks1155. [DOI] [PMC free article] [PubMed] [Google Scholar]
- 11.Budovsky A, Craig T, Wang J, Tacutu R, Csordas A, Lourenço J, Fraifeld VE, de Magalhães JP. LongevityMap: a database of human genetic variants associated with longevity. Trends in Genetics. 2013;29(10):559–560. doi: 10.1016/j.tig.2013.08.003. [DOI] [PubMed] [Google Scholar]
- 12.Lonsdale J, Thomas J, Salvatore M, Phillips R, Lo E, Shad S, Hasz R, Walters G, Garcia F, Young N, et al. The Genotype-Tissue Expression (GTEx) project. Nat Genet. 2013;45(6):580–585. doi: 10.1038/ng.2653. [DOI] [PMC free article] [PubMed] [Google Scholar]
- 13.Yang J, Huang T, Petralia F, Long Q, Zhang B, Argmann C, Zhao Y, Mobbs CV, Schadt EE, Zhu J, et al. Synchronized age-related gene expression changes across multiple tissues in human and the link to complex diseases. Scientific Reports. 2015;5:15145. doi: 10.1038/srep15145. [DOI] [PMC free article] [PubMed] [Google Scholar]
- 14.Peters MJ, Joehanes R, Pilling LC, Schurmann C, Conneely KN, Powell J, Reinmaa E, Sutphin GL, Zhernakova A, Schramm K, et al. The transcriptional landscape of age in human peripheral blood. Nature Communications. 2015;6:8570. doi: 10.1038/ncomms9570. [DOI] [PMC free article] [PubMed] [Google Scholar]
- 15.Horvath S. DNA methylation age of human tissues and cell types. Genome biology. 2013;14(10):3156. doi: 10.1186/gb-2013-14-10-r115. [DOI] [PMC free article] [PubMed] [Google Scholar]
- 16.Hripcsak G, Albers DJ. Next-generation phenotyping of electronic health records. Journal of the American Medical Informatics Association. 2013;20(1):117–121. doi: 10.1136/amiajnl-2012-001145. [DOI] [PMC free article] [PubMed] [Google Scholar]
- 17.Gottesman O, Kuivaniemi H, Tromp G, Faucett WA, Li R, Manolio TA, Sanderson SC, Kannry J, Zinberg R, Basford MA, et al. The Electronic Medical Records and Genomics (eMERGE) Network: past, present, and future. Genet Med. 2013;15(10):761–771. doi: 10.1038/gim.2013.72. [DOI] [PMC free article] [PubMed] [Google Scholar]
- 18.Kirby JC, Speltz P, Rasmussen LV, Basford M, Gottesman O, Peissig PL, Pacheco JA, Tromp G, Pathak J, Carrell DS, et al. PheKB: a catalog and workflow for creating electronic phenotype algorithms for transportability. Journal of the American Medical Informatics Association. 2016;23(6):1046–1052. doi: 10.1093/jamia/ocv202. [DOI] [PMC free article] [PubMed] [Google Scholar]
- 19.Mo H, Thompson WK, Rasmussen LV, Pacheco JA, Jiang G, Kiefer R, Zhu Q, Xu J, Montague E, Carrell DS, et al. Desiderata for computable representations of electronic health records-driven phenotype algorithms. Journal of the American Medical Informatics Association. 2015;22(6):1220–1230. doi: 10.1093/jamia/ocv112. [DOI] [PMC free article] [PubMed] [Google Scholar]
- 20.Shivade C, Raghavan P, Fosler-Lussier E, Embi PJ, Elhadad N, Johnson SB, Lai AM. A review of approaches to identifying patient phenotype cohorts using electronic health records. Journal of the American Medical Informatics Association. 2014;21(2):221–230. doi: 10.1136/amiajnl-2013-001935. [DOI] [PMC free article] [PubMed] [Google Scholar]
- 21.Miotto R, Li L, Kidd BA, Dudley JT. Deep Patient: An Unsupervised Representation to Predict the Future of Patients from the Electronic Health Records. Scientific Reports. 2016;6:26094. doi: 10.1038/srep26094. [DOI] [PMC free article] [PubMed] [Google Scholar]
- 22.Glorot X, Bengio Y. Understanding the difficulty of training deep feedforward neural networks. Aistats. 2010:249–256. [Google Scholar]
- 23.Kingma D, Ba J. Adam: A method for stochastic optimization. 2014 arXiv preprint arXiv:14126980. [Google Scholar]
- 24.Chollet F. Keras. 2015 URL http://keras io.
- 25.Bergstra J, Breuleux O, Bastien F, Lamblin P, Pascanu R, Desjardins G, Turian J, Warde-Farley D, Bengio Y. Theano: A CPU and GPU math compiler in Python. Proc 9th Python in Science Conf. 2010:1–7. [Google Scholar]
- 26.Benjamini Y, Hochberg Y. Controlling the false discovery rate: a practical and powerful approach to multiple testing. J R Stat Soc. 1995:57. [Google Scholar]
- 27.Delaneau O, Marchini J, Zagury J-F. A linear complexity phasing method for thousands of genomes. Nat Meth. 2012;9(2):179–181. doi: 10.1038/nmeth.1785. [DOI] [PubMed] [Google Scholar]
- 28.Howie BN, Donnelly P, Marchini J. A Flexible and Accurate Genotype Imputation Method for the Next Generation of Genome-Wide Association Studies. PLOS Genetics. 2009;5(6):e1000529. doi: 10.1371/journal.pgen.1000529. [DOI] [PMC free article] [PubMed] [Google Scholar]
- 29.Kang HM, Sul JH, Service SK, Zaitlen NA, Kong S-y, Freimer NB, Sabatti C, Eskin E. Variance component model to account for sample structure in genome-wide association studies. Nat Genet. 2010;42(4):348–354. doi: 10.1038/ng.548. [DOI] [PMC free article] [PubMed] [Google Scholar]
- 30.Galinsky Kevin J, Bhatia G, Loh P-R, Georgiev S, Mukherjee S, Patterson Nick J, Price Alkes L. Fast Principal-Component Analysis Reveals Convergent Evolution of ADH1B in Europe and East Asia. The American Journal of Human Genetics. 2016;98(3):456–472. doi: 10.1016/j.ajhg.2015.12.022. [DOI] [PMC free article] [PubMed] [Google Scholar]
- 31.Galinsky Kevin J, Loh P-R, Mallick S, Patterson Nick J, Price Alkes L. Population Structure of UK Biobank and Ancient Eurasians Reveals Adaptation at Genes Influencing Blood Pressure. The American Journal of Human Genetics. 2016;99(5):1130–1139. doi: 10.1016/j.ajhg.2016.09.014. [DOI] [PMC free article] [PubMed] [Google Scholar]
- 32.Obenchain V, Lawrence M, Carey V, Gogarten S, Shannon P, Morgan M. VariantAnnotation: a Bioconductor package for exploration and annotation of genetic variants. Bioinformatics. 2014;30(14):2076–2078. doi: 10.1093/bioinformatics/btu168. [DOI] [PMC free article] [PubMed] [Google Scholar]
- 33.Kuleshov MV, Jones MR, Rouillard AD, Fernandez NF, Duan Q, Wang Z, Koplev S, Jenkins SL, Jagodnik KM, Lachmann A, et al. Enrichr: a comprehensive gene set enrichment analysis web server 2016 update. Nucleic Acids Research. 2016 doi: 10.1093/nar/gkw377. [DOI] [PMC free article] [PubMed] [Google Scholar]
- 34.Chen E, Tan C, Kou Y, Duan Q, Wang Z, Meirelles G, Clark N, Ma’ayan A. Enrichr: interactive and collaborative HTML5 gene list enrichment analysis tool. BMC Bioinformatics. 2013;14(1):128. doi: 10.1186/1471-2105-14-128. [DOI] [PMC free article] [PubMed] [Google Scholar]
- 35.Barbeira A, Shah KP, Torres JM, Wheeler HE, Torstenson ES, Edwards T, Garcia T, Bell GI, Nicolae D, Cox NJ. MetaXcan: Summary Statistics Based Gene-Level Association Method Infers Accurate PrediXcan Results. bioRxiv. 2016:045260. [Google Scholar]
- 36.Cleveland WS. Robust Locally Weighted Regression and Smoothing Scatterplots. Journal of the American Statistical Association. 1979;74(368):829–836. [Google Scholar]
- 37.Manson JE, Willett WC, Stampfer MJ, Colditz GA, Hunter DJ, Hankinson SE, Hennekens CH, Speizer FE. Body Weight and Mortality among Women. New England Journal of Medicine. 1995;333(11):677–685. doi: 10.1056/NEJM199509143331101. [DOI] [PubMed] [Google Scholar]
- 38.Blagosklonny MV. Why men age faster but reproduce longer than women: mTOR and evolutionary perspectives. Aging. 2010;2(5):265–273. doi: 10.18632/aging.100149. [DOI] [PMC free article] [PubMed] [Google Scholar]
- 39.Ahmad A, Banerjee S, Wang Z, Kong D, Majumdar APN, Sarkar FH. Aging and Inflammation: Etiological Culprits of Cancer. Current aging science. 2009;2(3):174–186. doi: 10.2174/1874609810902030174. [DOI] [PMC free article] [PubMed] [Google Scholar]
- 40.Timberlake DS, Nikitin D, Johnson NJ, Altekruse SF. A longitudinal study of smokeless tobacco use and mortality in the United States. International Journal of Cancer. 2017;141(2):264–270. doi: 10.1002/ijc.30736. [DOI] [PubMed] [Google Scholar]
- 41.Ohtsuka M, Arase H, Takeuchi A, Yamasaki S, Shiina R, Suenaga T, Sakurai D, Yokosuka T, Arase N, Iwashima M. NFAM1, an immunoreceptor tyrosine-based activation motif-bearing molecule that regulates B cell development and signaling. Proceedings of the National Academy of Sciences of the United States of America. 2004;101(21):8126–8131. doi: 10.1073/pnas.0401119101. [DOI] [PMC free article] [PubMed] [Google Scholar]
- 42.Van Leuven F, Stas L, Hilliker C, Miyake Y, Bilinski P, Gossler A. Molecular cloning and characterization of the human interleukin-11 receptor α-chain gene, IL11RA, located on chromosome 9p13. Genomics. 1996;31(1):65–70. doi: 10.1006/geno.1996.0010. [DOI] [PubMed] [Google Scholar]
- 43.Yang H-Y, Kim SH, Kim S-H, Kim D-J, Kim S-U, Yu D-Y, Yeom YI, Lee D-S, Kim Y-J, Park B-J. The suppression of zfpm-1 accelerates the erythropoietic differentiation of human CD34+ cells. Biochemical and biophysical research communications. 2007;353(4):978–984. doi: 10.1016/j.bbrc.2006.12.155. [DOI] [PubMed] [Google Scholar]
- 44.Kotoh J, Sasaki D, Matsumoto K, Maeda A. Plekhs1 and Prdx3 are candidate genes responsible for mild hyperglycemia associated with obesity in a new animal model of F344-fa-nidd6 rat. The Journal of Veterinary Medical Science. 2016;78(11):1683. doi: 10.1292/jvms.16-0383. [DOI] [PMC free article] [PubMed] [Google Scholar]
- 45.Mailman MD, Feolo M, Jin Y, Kimura M, Tryka K, Bagoutdinov R, Hao L, Kiang A, Paschall J, Phan L, et al. The NCBI dbGaP database of genotypes and phenotypes. Nat Genet. 2007;39(10):1181–1186. doi: 10.1038/ng1007-1181. [DOI] [PMC free article] [PubMed] [Google Scholar]
- 46.Croft D, O’Kelly G, Wu G, Haw R, Gillespie M, Matthews L, Caudy M, Garapati P, Gopinath G, Jassal B, et al. Reactome: a database of reactions, pathways and biological processes. Nucleic Acids Research. 2011;39(suppl_1):D691–D697. doi: 10.1093/nar/gkq1018. [DOI] [PMC free article] [PubMed] [Google Scholar]
- 47.Ngo M, Ridgway ND. Oxysterol binding protein–related protein 9 (ORP9) is a cholesterol transfer protein that regulates Golgi structure and function. Molecular biology of the cell. 2009;20(5):1388–1399. doi: 10.1091/mbc.E08-09-0905. [DOI] [PMC free article] [PubMed] [Google Scholar]
- 48.Bau D, Zhou B, Khosla A, Oliva A, Torralba A. Network Dissection: Quantifying Interpretability of Deep Visual Representations. 2017 arXiv preprint arXiv:170405796. [Google Scholar]
Associated Data
This section collects any data citations, data availability statements, or supplementary materials included in this article.