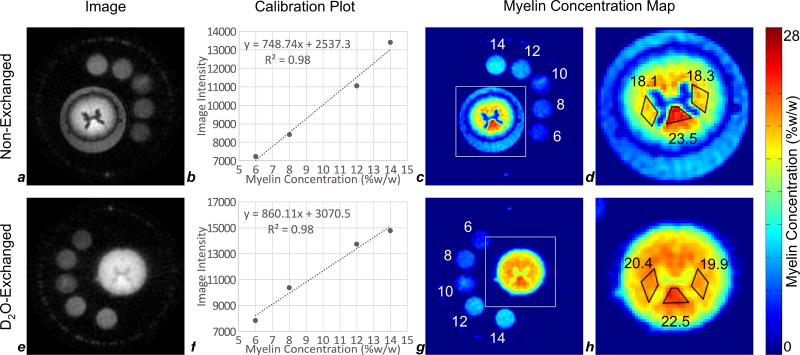
Figure 7.
Image-based quantification of myelin at 9.4T in ovine cervical spinal cords before (a–d) and after (e–h) deuterium exchange. Voxel size in all images is 250 × 250 × 750 µm3. Intensity within each reference sample (6%, 8%, 10%, 12%, and 14% myelin extract, by weight, in D2O) quantified in the raw images (a,e), was used to generate standard curves (b,f). Image intensity is well-correlated to myelin extract concentration for 6%, 8%, 12%, and 14% references. Using the calibration curves (b,f), raw images were converted to maps of myelin density (c,g). Areas indicated by the white squares (c,g) are enlarged in (d,h). Myelin density was quantified in three white matter ROIs (left and right lateral fasciculi, and dorsal columns). The residual signal surrounding the spinal cord in (c,d) is due to incomplete suppression of free water surrounding the cord due to longer T1 than tissue water within the spinal cord, therefore being incompletely suppressed at a TI chosen for optimal nulling of tissue water signal.

