

ABSTRACT
Microbial sulfur metabolism plays crucial roles in various food and alcoholic beverage fermentations. 3-(Methylthio)-1-propanol and dimethyl disulfide are important sulfur compounds in fermented foods and alcoholic beverages. Here, we studied the dynamics of these two compounds during spontaneous Chinese liquor fermentation. The two compounds reached the maximum concentration at day 10 and the maximum production rate at day 3. Metatranscriptomic analysis at days 3 and 10 revealed a total of 354 metabolically active microorganisms. Saccharomyces and Lactobacillus were identified as core microbiota critical for sulfur compound production based on both the transcript abundances of the principal genes and the distribution frequencies of 31 enzymes involved in sulfur metabolism. Saccharomyces transcribed genes encoding 23 enzymes related to the generation of 3-(methylthio)-1-propanol and dimethyl disulfide, and Lactobacillus was active in the methyl cycle, which recycles methionine, the precursor of the two sulfur compounds. Furthermore, the sulfur metabolism-related characteristics of two representative species were studied in coculture during a simulated fermentation. Saccharomyces cerevisiae JZ109 produced 158.4 μg/liter 3-(methylthio)-1-propanol and 58.5 μg/liter dimethyl disulfide in monoculture, whereas Lactobacillus buchneri JZ-JN-2017 could not produce these two compounds in monoculture. Their coculture significantly enhanced the generation of 3-(methylthio)-1-propanol (350.0 μg/liter) and dimethyl disulfide (123.8 μg/liter). In addition, coculture significantly enhanced the gene transcriptions (fold change, 1.5 to ∼55.0) that convert methionine to these two compounds in S. cerevisiae and in the methyl cycle of L. buchneri. This study reveals a novel synergistic effect between members of the core microbiota in the production of sulfur compounds via methionine recycling in spontaneous Chinese liquor fermentation.
IMPORTANCE Sulfur compounds play a crucial role in the aroma quality of various fermented foods and alcoholic beverages. However, it is unclear how these compounds are produced by microbes during their spontaneous fermentations. Here, we identified the core microbiota (Saccharomyces and Lactobacillus) associated with sulfur metabolism by determining both transcript abundance and distribution frequency of each genus in spontaneous Chinese liquor fermentation. This study provides a system-level analysis of sulfur metabolism by the metatranscriptomic analysis and culture-dependent methods. It sheds new light on how the metabolic behavior of the microbiota contributes to the liquor aroma quality. Furthermore, this work reveals a novel synergistic effect between Saccharomyces and Lactobacillus in the production of sulfur compounds, in which Lactobacillus regenerates the precursor methionine for sulfur compound production by Saccharomyces. Our findings can contribute to the enhancement of aroma characteristics in Chinese liquor and open new avenues for improving various food and alcoholic beverage fermentation processes.
KEYWORDS: Chinese liquor, core microbiota, metatranscriptomic, microbial interaction, sulfur metabolism, synergistic effect
INTRODUCTION
Chinese liquor is one of the oldest and most famous alcoholic beverages all over the world (1, 2). It is generally produced by spontaneous fermentation processes, which involve complex microbiota (3). The metabolic profile of microbiota plays a key role in flavor quality through the metabolism of sugars and other organic compounds to produce various aroma compounds (4, 5). Thus, it is important to reveal the contribution of microbial metabolism to Chinese liquor fermentation.
Sulfur compounds, most with a low detection threshold and potent sensorial properties, are considered important flavor compounds in fermented foods and alcoholic beverages. Dimethyl disulfide shows an onion aroma in wine and beer (6) and an onion and cooked cabbage aroma in Chinese liquor (7). 3-(Methylthio)-1-propanol exhibits a cauliflower aroma in wine and beer (6) and a cooked vegetable aroma in Chinese liquor (8). Sulfur metabolism has been well understood from monoculture studies (9). For example, Kluyveromyces lactis and Yarrowia lipolytica convert cysteine, serine, and sulfite to methionine and then degrade methionine to several sulfur compounds (10, 11). S. cerevisiae degrades methionine to methanethiol via the demethiolation pathway, and then methanethiol can be transformed to dimethyl disulfide. S. cerevisiae also produces 3-(methylthio)-1-propanol via the Ehrlich pathway (12). However, sulfur metabolism is more complex in microbial communities. Thus, the influence of complex microbial interactions on microbial metabolism during the spontaneous fermentation has not been dissected (13).
The core microbiota plays an essential role in spontaneous food fermentation and flavor generation (14). Thus, it is crucial to reveal the core microbiota associated with sulfur metabolism in spontaneous fermentation. Recently, metatranscriptomic analysis provides deep insight into the core functional microbiota during traditional solid-state fermentation (15). For example, metatranscriptomic analysis has been used to explore the key microbiota associated with proteolysis during cheese maturation (16). Metatranscriptomic analysis of carbohydrate metabolism during kimchi fermentation also reveals that the key lactic acid bacteria mainly contribute to lactate and acetate production (17, 18). Thus, it would be useful to apply metatranscriptomic analysis to reveal core microbiota related to sulfur metabolism in spontaneous Chinese liquor fermentation.
In this work, we applied a metatranscriptomic approach to identify the core microbiota associated with sulfur metabolism during the fermentation processes of Chinese liquor. We revealed the sulfur metabolic pattern of the core microbiota, focusing on the production of 3-(methylthio)-1-propanol and dimethyl disulfide, which possess high concentrations and aroma characteristics in Chinese liquor and were generated in the fermentation processes (19). Furthermore, we studied the microbial interactions in the core microbiota and their effects on sulfur metabolism by a coculture method. This work provides deep insight into the production of sulfur compounds by the microbiota, and this work would be beneficial in the development of mechanisms to regulate sulfur metabolism in spontaneous Chinese liquor fermentation.
RESULTS AND DISCUSSION
Characteristics of 3-(methylthio)-1-propanol and dimethyl disulfide during liquor fermentation.
The production of 3-(methylthio)-1-propanol and dimethyl disulfide was monitored during liquor fermentation (Fig. 1). Their concentrations reached a maximum of 640.8 μg/kg and 36.3 μg/kg at day 10, respectively, and then decreased until the end of the fermentation. Their maximum production rates reached peaks of 85.3 μg/kg/day and 4.0 μg/kg/day at day 3, respectively.
FIG 1.

Dynamics profile of 3-(methylthio)-1-propanol (a) and dimethyl disulfide (b) in liquor fermentation. Data are shown as the mean ± standard deviation (SD) (n = 4).
Microbial population dynamics and metatranscriptomic analysis in liquor fermentation.
We then sought to characterize the microbiota throughout the fermentation process. Molds increased and reached the highest population at day 5 (1.2 × 10⁵ copies/g) and then decreased and kept nearly stable until the end of fermentation. Bacteria peaked at 6.1 × 10⁸ copies/g at day 15 and then decreased until the end of fermentation. Yeasts increased and reached 5.2 × 10⁷ copies/g at day 10 and then decreased until the end of fermentation (Fig. 2a). These results indicate that bacteria and yeast dominate the course of the fermentation process.
FIG 2.

Dynamics of microbial population and community makeup based on transcript abundance. (a) Microbial population of bacteria, yeasts, and molds during the fermentation process. Data are shown as the mean ± SD (n = 4). (b) Relative transcript abundances of major genera at day 3 and day 10 (two biological replicates, 3-1 and 3-2 for day 3, and 10-1 and 10-2 for day 10). (c) Transcript abundances of Saccharomyces and Lactobacillus at days 3 and 10 (two biological replicates as in panel b).
Since the production rate and concentration of sulfur compounds were highest at days 3 and 10, respectively, we employed a metatranscriptomic approach to explore the metabolically active microorganisms at these times. A total of 290 (day 3, replicate 1 [3-1]), 354 (day 3, replicate 2 [3-2]), 222 (day 10, replicate 1 [10-1]), and 233 (day 10, replicate 2 [10-2]) genera were detected. The genera were largely restricted to Saccharomyces (89.8%) at day 3, and only Sporosarcina, Lactobacillus, Naumovozyma, Ogataea, Penicillium, and Bacillus (2.9%, 0.9%, 0.7%, 0.6%, 0.5%, and 0.5%, respectively) were present at ≥0.5% of the average relative transcript abundance. It has been reported that Saccharomyces acts as the dominant microbe in the early stage of liquor fermentation processes (20). At day 10, Lactobacillus possessed the highest transcriptional activity (86.7%) and became the dominant microbe (Fig. 2b and c). Previous studies have reported that several Lactobacillus species, such as L. buchneri, can grow anaerobically at a high organic acid level (21). Only Saccharomyces (6.5%) and Pediococcus (0.5%) were present at ≥0.5% of the average relative transcript abundance (Fig. 2b), which showed lower transcriptional activities at day 10 (Fig. 2b). The decrease in the transcription activity of yeasts might be due to a decrease in reducing sugar concentration (see Fig. S1b in the supplemental material) and an increase in organic acid and ethanol levels (Fig. S1) (15, 22, 23).
Core microbiota associated with sulfur metabolism.
We observed that a total of 15 genera transcribed genes encoding 31 enzymes associated with sulfur metabolism at days 3 and 10 (Fig. 3). Sporosarcina, Kuraishia, Ogataea, Kazachstania, Naumovozyma, Virgibacillus, Oceanobacillus, Penicillium, Bacillus, Brettanomyces, Truepera, Komagataella, and Acetobacter possessed low-average transcript abundances (<500 fragments per kilobase of transcript per million fragments mapped [FPKM]) or low-average distribution frequencies (<20%) at days 3 and 10. In contrast, Saccharomyces possessed high-average transcript abundances (day 3, 14,866.2 FPKM; day 10, 2,485.2 FPKM) and high-average distribution frequencies (74.2%) at days 3 and 10. These results indicated that Saccharomyces exhibited the highest transcriptional activity in sulfur metabolism at days 3 and 10. Lactobacillus showed the highest average transcript abundances (3,023.8 FPKM) at day 10 and high-average distribution frequencies at days 3 and 10 (21.0% and 22.6%, respectively). Thus, Saccharomyces and Lactobacillus were identified as the core microbiota based on both their high-average transcript abundances (>1,000 FPKM) and average distribution frequencies (>20%).
FIG 3.
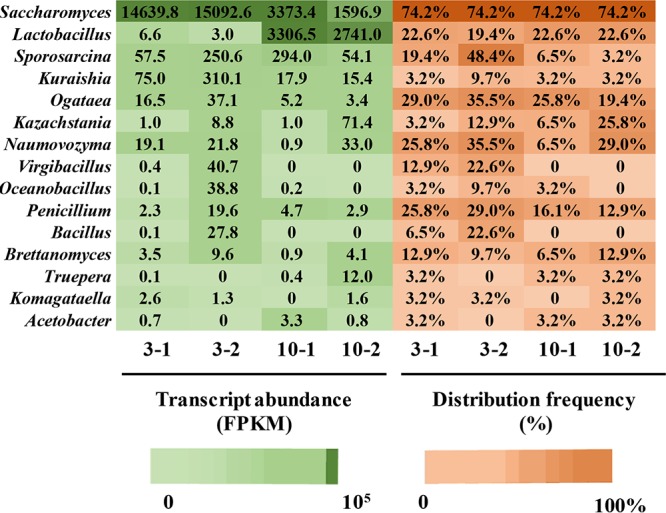
Analysis of transcript abundances and distribution frequencies of core microbiota at days 3 and 10 (two biological replicates, 3-1 and 3-2 for day 3, and 10-1 and 10-2 for day 10).
Sulfur metabolic pattern of microbiota in Chinese liquor fermentation.
We next wanted to determine the contribution of the microbiota to sulfur metabolism during fermentation. As shown in Fig. 4, the metabolic pattern of 3-(methylthio)-1-propanol and dimethyl disulfide was partitioned into 6 modules (E, S, A, M, C, and L) based on the KEGG pathway and MetaCyc Metabolic Pathway Database.
FIG 4.

Metabolic pattern of 3-(methylthio)-1-propanol and dimethyl disulfide at days 3 and 10. (a) Schematic depicting the metabolic profile of the microbiota. The red solid lines represent reactions carried out by Lactobacillus, black solid lines represent reactions carried out by Saccharomyces, green solid lines represent reactions by other genera, and the black dashed lines represent chemical reactions. Different colored areas show different modules. A, S, and E represent sulfur sources from aspartate, serine, and sulfite, respectively. M, cysteine to methionine; C, methyl cycle; L, methionine catabolism. (b) Heatmap showing the transcription level. The boxes on the left side of heatmap show the microbiota, and boxes on the right side represent corresponding enzymes. A complete list of the transcription levels of genes encoding enzymes can also be found in Table S3, Data Set S1, and Fig. S4. CoA, coenzyme A; PLP, pyridoxal phosphate.
In module E, sulfite serves as the sole inorganic sulfur donor to synthesize cysteine (24) (Fig. 4a, E1 to E2). In the first step, Saccharomyces showed higher transcript abundances of genes encoding sulfite reductase (NADPH) flavoprotein α-component (E1, day 3, 91.3 FPKM; day 10, 13.8 FPKM) and sulfite reductase (NADPH) hemoprotein β-component (E1, day 3, 60.2 FPKM; day 10, 7.1 FPKM) at day 3 than at day 10 (Fig. 4 and Data Set S1). In the second step, a gene encoding cysteine synthase (E2) was transcribed in the genera Saccharomyces, Sporosarcina, and Virgibacillus at days 3 and 10. Among these genera, Saccharomyces showed a higher gene transcript abundance than other genera (E2, day 3, 21.0 FPKM; day 10, 4.7 FPKM). Module S includes two reactions from serine to cysteine. Truepera and Virgibacillus possessed low transcript abundance of the gene encoding serine O-acetyltransferase (S1, ≤12.0 FPKM) at day 3 and day 10. In the second step (S2), cysteine synthase (E2) also catalyzes the conversion of O-acetyl-l-serine to cysteine.
In module A, homocysteine and cystathionine are intermediates which can be synthesized from aspartate (9). In the common first step (A1), Sporosarcina possessed transcript abundance of the gene encoding aspartate-semialdehyde dehydrogenase (A1) of 99.1 FPKM at day 3 and 174.0 FPKM at day 10. Lactobacillus possessed high transcript abundances of genes encoding aspartate kinase (A1, 99.2 FPKM) and aspartate-semialdehyde dehydrogenase (A1, 167.8 FPKM) at day 10. Saccharomyces also showed transcript abundances of the genes encoding aspartate kinase (A1) of 38.3 FPKM at day 3 and 46.5 FPKM at day 10 and of the genes encoding aspartate-semialdehyde dehydrogenase (A1) of 61.3 FPKM at day 3 and 4.8 FPKM at day 10. In the common second step (A2), Saccharomyces was responsible for transcription of the gene encoding homoserine dehydrogenase (A2, 101.4 FPKM) at day 3. Low transcript abundance of the gene encoding homoserine O-succinyltransferase (A3, 0.7 FPKM) was shown in Sporosarcina at day 3. Meanwhile, Saccharomyces exhibited higher transcript abundances of genes encoding cystathionine γ-synthase (A4 and A6, day 3, 61.6 FPKM; day 10, 37.5 FPKM), homoserine O-acetyltransferase (A5, day 3, 41.9 FPKM; day 10, 20.2 FPKM), and O-acetylhomoserine (thiol)-lyase (A7, day 3, 246.4 FPKM; day 10, 46.3 FPKM) at day 3 than at day 10. Naumovozyma, Sporosarcina, and Kazachstania showed low transcript abundances (A2 to A7, <10 FPKM) of these genes at day 3 and day 10. These results indicate that Saccharomyces plays a major role in synthesizing cystathionine and homocysteine from aspartate, and Lactobacillus and Sporosarcina play a secondary role in these pathways.
In module M, the synthesis of methionine from cysteine requires three successive reactions (49). Saccharomyces possessed the highest transcript abundances of genes encoding cystathionine γ-lyase (M1, 138.6 FPKM), cystathionine β-synthase (M2, 139.8 FPKM), 5-methyltetrahydropteroyltriglutamate-homocysteine methyltransferase (M3, 273.8 FPKM), and homocysteine S-methyltransferase (M3, 8.1 FPKM) at day 3. Low transcript abundances (<10 FPKM) of these genes were shown in Bacillus, Naumovozyma, Sporosarcina, and Kazachstania at day 3 and day 10. These results show that Saccharomyces is responsible for the synthesis of methionine from cysteine.
The methyl cycle (module C) plays a major role in methionine regeneration (50). It includes five enzymatic reactions. Saccharomyces exhibited higher transcript abundance of the gene encoding S-adenosylmethionine synthetase at day 3 than day 10 (C1, 315.4 and 21.9 FPKM, respectively). Lactobacillus exhibited higher transcript abundance at day 10 than day 3 (C1, 234.0 and 0.7 FPKM, respectively). Lactobacillus played a major role in producing S-adenosylhomocysteine from S-adenosylmethionine (SAM) by DNA (cytosine-5-)-methyltransferase at days 3 and 10 (C2, 0.6 and 413.7 FPKM, respectively). Only Saccharomyces exhibited high transcript abundance of the gene encoding adenosylhomocysteinase at days 3 and 10 (C3, 265.9 and 23.1 FPKM, respectively). Moreover, S-adenosylhomocysteine also forms homocysteine via a two-step reaction. Lactobacillus showed the highest transcript abundance of the gene encoding S-adenosylhomocysteine–5′-methylthioadenosine nucleosidase at days 3 and 10 (C4, 1.6 and 1,014.3 FPKM, respectively). Only Sporosarcina and Virgibacillus showed transcript abundance of the gene encoding S-ribosylhomocysteine lyase (C5) of <1.6 FPKM at day 3. In this module, Lactobacillus and Saccharomyces exhibit both high distribution frequencies and transcript abundances of genes involved in regenerating methionine and producing SAM.
In module L, 3-(methylthio)-1-propanol is generated from methionine in three steps (27). Low transcript abundance of the genes encoding aromatic amino acid aminotransferase (L2, <5 FPKM) was shown in Naumovozyma and Brettanomyces at day 3. At day 10, Lactobacillus showed high transcript abundance of genes encoding alcohol dehydrogenase (L4, 1,094.8 FPKM) and Acetobacter showed low transcript abundance of the genes encoding alcohol dehydrogenase (L4, 2.0 FPKM). Saccharomyces possessed high transcript abundances of genes encoding aromatic amino acid aminotransferase (L2, 100.7 FPKM), pyruvate decarboxylase (L3, 9,568.2 FPKM), and alcohol dehydrogenase (L4, 3,198.6 FPKM) at day 3, and their transcript abundances were decreased by 95.6%, 80.0%, and 90.9%, respectively, at day 10. The high transcript abundances of these genes encoding enzymes (Fig. 4a, L1 to L4) is consistent with a high production rate of 3-(methylthio)-1-propanol at day 3 (Fig. 1), whereas the decreased transcriptional activities of these genes encoding enzymes at day 10 reflect the decreased accumulation of 3-(methylthio)-1-propanol at day 10.
Dimethyl disulfide is produced from methanethiol, which is generated from methionine in a reaction catalyzed by methionine γ-lyase, cystathionine β-lyase, or cystathionine γ-lyase (9) (Fig. 4a, L1). Sporosarcina possessed transcript abundances of genes encoding methionine γ-lyase (L1) of 5.0 FPKM and of 9.2 FPKM for cystathionine β-lyase (L1) at day 3. Only Saccharomyces exhibited high transcript abundances of genes encoding cystathionine γ-lyase (L1, 138.6 FPKM) and cystathionine β-lyase (L1, 10.0 FPKM) at day 3. These results indicate that Saccharomyces plays a key role in catalyzing the conversion of methionine into dimethyl disulfide.
Effect of interaction between Saccharomyces and Lactobacillus on 3-(methylthio)-1-propanol and dimethyl disulfide generation.
Our multispecies analysis shows completion of the sulfur metabolic pathway, which promotes the development of the aroma characteristic of sulfur compounds. Lactobacillus plays an important role in regenerating methionine, which can serve as a precursor of sulfur compounds produced by Saccharomyces. This result indicates that Saccharomyces and Lactobacillus may exhibit synergism in the generation of 3-(methylthio)-1-propanol and dimethyl disulfide.
In this study, the impact of synergism on sulfur metabolism remains to be explored based on culture-dependent methods. However, the microbial interactions are difficult to assess within natural systems, due to the complex microbial community's structure. As an alternative, synthetic microbial communities (cocultures) including two species are used to simulate the natural systems under laboratory conditions (28).Thus, we developed a Saccharomyces-Lactobacillus coculture system to study their interaction with respect to sulfur metabolism. S. cerevisiae possesses a complete pathway from methionine to 3-(methylthio)-1-propanol and dimethyl disulfide (Fig. S5a). L. buchneri possesses a complete pathway associated with the methyl cycle, which could regenerate methionine and produce SAM (Fig. S5b). In addition, S. cerevisiae (29) and L. buchneri (30) are the dominant species of these two genera and have positive impacts on Chinese liquor fermentation. Therefore, S. cerevisiae JZ109 and L. buchneri JZ-JN-2017 were both isolated from our liquor fermentation and used in the mono- and coculture fermentation experiments.
S. cerevisiae achieved a maximum population of 2.2 × 10⁸ copies/ml at 72 h in monoculture and 3.8 × 10⁸ copies/ml at 96 h in coculture. L. buchneri achieved a maximum population of 4.2 × 10⁷ copies/ml and 7.1 × 10⁷ copies/ml at 72 h in both mono- and coculture. No significant (P > 0.05) variation in the population was observed in monoculture and coculture for either of the two strains over the fermentation period (Fig. 5a).
FIG 5.

Microbial population and production of 3-(methylthio)-1-propanol and dimethyl disulfide in mono- and coculture in sorghum medium. (a to c) Populations of S. cerevisiae and L. buchneri in monoculture and coculture (a), 3-(methylthio)-1-propanol (b), and dimethyl disulfide (c). Data are shown as the mean ± SD (n = 3).
S. cerevisiae showed a maximum production of 158.4 μg/liter 3-(methylthio)-1-propanol in 72 h (Fig. 5b) and 58.5 μg/liter dimethyl disulfide at 120 h in monoculture (Fig. 5c). In contrast, L. buchneri did not produce 3-(methylthio)-1-propanol or dimethyl disulfide in monoculture. Previous studies have reported that Lactobacillus spp. exhibit minor aminotransferase activity on methionine (31) and lack methionine γ-lyase in cheese fermentation (32), which might explain the lack of 3-(methylthio)-1-propanol and dimethyl disulfide production in L. buchneri JZ-JN-2017. Interestingly, when these two strains were cocultured, the maximum concentrations of 3-(methylthio)-1-propanol (350.0 μg/liter) (P < 0.05) and dimethyl disulfide (123.8 μg/liter) (P < 0.05) significantly increased. These results indicate that Saccharomyces-Lactobacillus coculture enhances the production of these two sulfur compounds.
Effects of microbial interactions on gene transcriptions associated with sulfur metabolism.
To obtain further insight into the effects of microbial interactions on sulfur metabolism, the transcription levels of genes involved in the methyl cycle and membrane transport systems and the generation of 3-(methylthio)-1-propanol and dimethyl disulfide from methionine were monitored at 48 h, when the coculture achieved the maximum production rates.
L. buchneri increased the transcription of metK (C1, 4.2-fold), ubiE (C2, 4.9-fold), pfs (C4, 5.9-fold), luxS (C5, 2.9-fold), and metE (M3, 12.0-fold) in coculture compared to monoculture (Fig. 6). This result indicates that coculture increases the transcription of related genes in the methyl cycle in L. buchneri. Meanwhile, S. cerevisiae increased the transcription of SAM3 (1.3-fold), encoding a high-affinity SAM uptake permease, and MUP1 and MUP3 (13.8-fold and 3.5-fold, respectively), encoding a high-affinity methionine uptake permease, which could be fed into the methyl cycle in S. cerevisiae (33, 34). Consequently, the transcription levels of genes in the methyl cycle increased in S. cerevisiae cocultured with L. buchneri, including SAM1 (C1, 4.2-fold), MTQ1 (C2, 2.6-fold), SAH1 (C3, 1.4-fold), and MHT1 (M3, 4.1-fold). The enhanced methyl cycle in these two strains might contribute to the efficient regeneration of methionine. Moreover, coculture increased the transcription of CYS4 (M1, 3.4-fold) and STR3 (M2, 3.5-fold) in Saccharomyces, which may also increase the production of methionine from cysteine.
FIG 6.

Model of S. cerevisiae-L. buchneri interactions based on RT-qPCR and 3-(methylthio)-1-propanol and dimethyl disulfide analyses. (a) Model of S. cerevisiae-L. buchneri interactions. The red solid lines represent upregulated reactions in coculture relative to monoculture. The black dashed lines represent the generation of 3-(methylthio)-1-propanol and dimethyl disulfide. M1 to M3 represent the pathway from cysteine to methionine, C1 to C5 represent the methyl cycle pathway, and L1 to L4 represent methionine catabolism. (b and c) Relative gene expression ratios in S. cerevisiae (b) and in L. buchneri (c). The red lines indicate >2-fold difference. Data are shown as the mean ± SD (n = 3).
Besides the increasing transcription of genes in methionine biosynthesis, the transcription of genes encoding enzymes generating 3-(methylthio)-1-propanol also were upregulated in coculture, including ARO8 (L2, 1.5-fold), ARO10 (L3, 55.0-fold), ADH5 (L4, 2.2-fold), SFA1 (L4, 8.2-fold), and ADH4 (L4, 2.3-fold). Moreover, S. cerevisiae also increased the transcription of STR3 (L1, 3.5-fold), which encodes enzymes generating methanethiol, and then methanethiol is converted to dimethyl disulfide (Fig. 5). The increase in the concentrations of 3-(methylthio)-1-propanol and dimethyl disulfide might result from increased expression of genes involved in methionine biosynthesis and methionine catabolism. Recent studies reported that the overexpression of ARO8 or ARO10 could enhance the production of 3-(methylthio)-1-propanol, and the coexpression of ARO8 and ARO10 could significantly boost the production of 3-(methylthio)-1-propanol in S. cerevisiae (35). A higher expression of STR3 could produce a higher concentration of methanethiol, which could be transformed to dimethyl disulfide in S. cerevisiae (12). These results confirm the higher productions of 3-(methylthio)-1-propanol and dimethyl disulfide in S. cerevisiae in coculture in this study. These results indicate that S. cerevisiae increases the expression of genes for the generation of 3-(methylthio)-1-propanol and dimethyl disulfide in the presence of L. buchneri, which can regenerate the precursor methionine for methionine catabolism, and they reveal a novel synergistic effect between these two strains.
Interactions between Saccharomyces and lactic acid bacteria occur in dairy, food, and beverage fermentation (36). It is reported that Lactobacillus delbrueckii could hydrolyze lactose to glucose and galactose, which is beneficial to the growth and alcoholic fermentation of S. cerevisiae; meanwhile, S. cerevisiae can supply CO2 to Lactobacillus delbrueckii, and CO2 is necessary for the growth of Lactobacillus delbrueckii (36). In addition, S. cerevisiae can provide valine or leucine to Lactobacillus brevis, which cannot grow in the medium without valine or leucine in the pure culture (37). These studies imply these two genera could provide nutrients to each other and promote the growth or metabolism of the members. Here, in a spontaneous Chinese liquor fermentation system, we found a novel microbial interaction between Saccharomyces and Lactobacillus, in which Lactobacillus recycled methionine, the precursor of sulfur compounds for Saccharomyces, leading to an increase in the production of sulfur compounds.
Conclusion.
This study comprehensively revealed the sulfur metabolism pattern of microbiota in Chinese liquor fermentation using a metatranscriptomic approach together with a simulated fermentation. A combination of transcript abundance and distribution frequency identified the core microbiota (Saccharomyces and Lactobacillus) associated with sulfur compound production. This work revealed a synergistic effect between Saccharomyces and Lactobacillus, in which Saccharomyces played a crucial role in the generation of 3-(methylthio)-1-propanol and dimethyl disulfide and Lactobacillus regenerated methionine and SAM for S. cerevisiae. This study revealed a novel synergistic effect of the core microbiota in spontaneous Chinese liquor fermentation. Our findings can be used to enhance the aroma characteristics in Chinese liquor fermentation and open new avenues for improving various spontaneous food fermentation processes.
MATERIALS AND METHODS
Sample collection.
Sampling was conducted in March 2016 from a Chinese liquor distillery in Shandong Province, China. A mixture of the starter, raw material (sorghum), and fermented grains from the last fermentation round (1:6:3) was put into a cube-shaped underground pit (about 3.2 m by 2.4 m by 2.9 m) and then sealed for a 30-day fermentation. Samples (200 g) were collected at days 0, 3, 5, 10, 15, 20, and 30 from four separate fermentation pits (four biological replicates), as previously reported (20). These samples were stored at −20°C for microbial population determination, physical and chemical parameter analyses, and 3-(methylthio)-1-propanol and dimethyl disulfide quantification. Samples (200 g) from the sampling position at day 3 and day 10 (two biological replicates, 3-1 and 3-2 for day 3 and 10-1 and 10-2 for day 10) were immediately frozen in liquid nitrogen after sampling and then stored at −80°C for metatranscriptomic analysis. Additional samples (200 g) from the sampling position were stored at 4°C for strain screening.
Strains.
Predominant liquor fermentation microorganisms, S. cerevisiae JZ109 and L. buchneri JZ-JN-2017, were both isolated from this liquor fermentation process and were deposited in the China General Microbiological Culture Collection Center with the accession numbers CGMCC no. 12417 and CGMCC no. 14271, respectively.
Total RNA extraction and sequencing for metatranscriptomic analysis.
Total RNA was extracted with the RNeasy minikit (Qiagen, Hilden, Germany). DNA was removed by treatment with the RNase-Free DNase set (Qiagen). The quality and concentrations of total RNA were assessed using a NanoDrop 2000 spectrophotometer (Thermo Scientific, Waltham, MA) and an Agilent 2100 Bioanalyzer (Agilent Technologies, Palo Alto, CA). Thereafter, rRNA depletion was performed using the Ribo-Zero magnetic kits (Illumina, San Diego, CA). Library preparation was performed using the TruSeq RNA sample prep kit (Illumina). The quality of the library was assessed on 2100 Bioanalyzer (Agilent Technologies). Finally, sequencing was performed on the Illumina Genome Analyzer IIx (Illumina). All the operations followed the manufacturer's instructions.
Sequence processing.
Poor-quality (Phred score <20) bases of raw reads, reads with “N” bases, and those with lengths of <50 bp were discarded using Sickle (https://github.com/najoshi/sickle). Next, we used cross-match to search a database of Illumina adaptor sequences, and adaptor contaminations (http://www.phrap.org) were filtered. SortMeRNA (http://bioinfo.lifl.fr/RNA/sortmerna/) was used in a BLAST search of the SILVA short subunit (SSU; 16S/18S) and SILVA long subunit (LSU; 23S/28S) databases, rRNA reads were removed, and then paired reads and single reads with high quality were preserved. Putative mRNA reads were assembled de novo using the Trinity RNA-Seq assembly algorithm (http://trinityrnaseq.github.io/) (25). All the operations followed the manufacturer's instructions. The detailed information of the metatranscriptomic sequence is listed in Table S1.
Putative mRNA reads were subject to BLASTX comparisons against the nonredundant (nr) protein database obtained from the National Center for Biotechnology Information (NCBI) (E value, <10−5) (18). The least common ancestor (LCA)-based algorithm implemented in MEGAN was used to determine the taxonomic level of each gene. MetaGene Annotator was applied to assemble contigs, and then reads longer than 100 bp were identified. BLASTP was used to query the predicted proteins matching sequence reads against the integrated nr protein database (E value, <10−5). Functional annotation was performed using the Kyoto Encyclopedia of Genes and Genomes (KEGG) annotations (version April 2011). Transcript expression was normalized using fragments per kilobase of transcript per million fragments mapped (FPKM) (26).
Mono- and coculture fermentation.
Sorghum extract medium was used for mono- and coculture fermentation (38). S. cerevisiae and L. buchneri were precultured in sorghum extract medium at 30°C and 200 rpm. Cells were centrifuged (10,000 × g for 3 min), washed twice with sterile saline, and then inoculated in fresh sorghum extract medium with an initial strain density of 1 × 10⁶ cells per milliliter. Cocultures were carried out with a 6-well Transwell system (24-mm Transwell; Corning, NY). Each well consists of an upper and a lower chamber, which are separated by a polycarbonate membrane (0.45 μm). This polycarbonate membrane can prevent physical interspecies interaction but not the diffusion of small molecules, such as the metabolites (<7 kDa). Uninoculated sorghum extract medium was used as a negative control. Fermentation was performed without shaking at 30°C for 144 h. The experiments were performed in triplicate.
Microbial population determination by real-time quantitative PCR.
The populations of different microbes in liquor fermentation and mono- and coculture fermentation were determined by quantitative PCR (qPCR). Genomic DNA was extracted using the E.Z.N.A. soil DNA kit (Omega Bio-Tek, Norcross, GA) in liquor fermentation and DNAiso reagent (TaKaRa, Dalian, China) in mono- and coculture fermentation. All the operations followed the manufacturer's instructions. Genomic DNA was used as the template to amplify bacteria using primers 340F and 758R (39), yeasts using primers YEASTF and YEASTR (40), molds using primers Fnpstr and Rnpstr (41), S. cerevisiae using primers SC1 and SC2 (42), and L. buchneri using primers FalllactIS and RalllactIS (43).
qPCR was performed by StepOnePlus instrument (Applied Biosystems, Foster City, CA) with a commercial kit (SYBR Premix ExTaq II; TaKaRa, Dalian, China). The qPCR calibration curves were generated via 10-fold serial dilutions of standard DNA. Each reaction was performed in 20 μl containing 8.2 μl of double-distilled water, 10 μl of SYBR Premix Ex Taq (TaKaRa), 0.4 μl of each primer (20 μM), 1.0 μl of DNA template (50 ng/μl for molds and 5 ng/μl for yeasts, bacteria, Lactobacillus, and Saccharomyces). The amplification conditions were as follows: preheating at 95°C for 30 s, 40 cycles of 95°C for 5 s, 55°C (for bacteria, yeasts, and molds) or 58°C (for S. cerevisiae, L. buchneri) for 30 s, and an increase of 0.5°C every 5 s from 65°C to 95°C for melting curve analysis to confirm the specificity of the amplification. The experiments were performed in triplicate.
Gene transcription analysis in mono- and coculture by reverse transcription-quantitative PCR.
Cells were collected from mono- and coculture by centrifugation at 10,000 × g at 4°C for 5 min, immediately frozen in liquid nitrogen, and stored at −80°C. RNA was extracted as follows: cell pellets were crushed into fine powders in a precooled mortar (China National Pharmaceutical Group Corp., Shanghai, China). The sample powders were transferred to RNase-free 2.0-ml centrifuge tubes, which were filled with 1.0 ml of precooled TRIzol reagent (TaKaRa, Dalian, China), vortexed for 15 s, and then incubated at 25°C for 5 min. After that, 200 μl chloroform was added, vortexed for 15 s, and centrifuged at 10,000 × g at 4°C for 10 min, and then 200 μl of supernatant was mixed with an equal volume of isopropyl alcohol and centrifuged at 10,000 × g and 4°C for 15 min. The obtained pellet was washed with 1.0 ml of 75% ethanol and centrifuged at 10,000 × g and 4°C for 15 min, and the pellets were dissolved in 40 μl of RNase-free water. RNA samples were subsequently purified using RNeasy spin columns (Qiagen, Hilden, Germany). DNase treatment was conducted with 1 μg of RNA sample in a 10-μl reaction mixture using the PrimeScript reverse transcriptase (RT) reagent kit with genomic DNA (gDNA) Eraser (TaKaRa). All the operations followed the manufacturer's instructions. The ratios of A260/A280 and A260/A230 was calculated to assess RNA purity using a NanoDrop ND-1000 microspectrometer (Thermo Scientific, Wilmington, DE). The quality of the total RNA was analyzed by 1% nondenatured agarose gel electrophoresis.
Reverse transcription was conducted using the PrimeScript RT reagent kit (TaKaRa, Dalian, China). Reactions without reverse transcriptase and a template were both used as a negative control. qPCR was performed using a StepOnePlus instrument (Applied Biosystems, Foster City, CA), according to the manufacturer's instructions. Each reaction was performed in a 20-μl mixture containing 1.0 μl (10 ng) of cDNA, 0.4 μl of each primer, 10 μl of SYBR Premix Ex Taq (TaKaRa), and 8.2 μl of double-distilled water. The amplification conditions were as follows: preheating at 95°C for 30 s, 40 cycles of 95°C for 5 s, 57°C for 30 s, and an increase of 0.5°C every 5 s from 65°C to 95°C for melting curve analysis to confirm the specificity of the amplification. The experiments were done in triplicate. Negative controls were performed with no SYBR Premix Ex Taq, no template, and only double-distilled water. For each gene, the cycle threshold (CT) values of the technical and biological replicates were averaged. The CT values of reference genes (UBC6 and recA) were then averaged. The relative transcriptional levels of genes were quantified by the 2−ΔΔCT method (44). The primers for reverse transcription-quantitative PCR (RT-qPCR) for genes in S. cerevisiae and L. buchneri are listed in Tables 1 and 2, respectively.
TABLE 1.
Primer sequences for gene transcription analysis in Saccharomyces cerevisiae
| Reaction | Gene | Primer direction | Primer sequence (5′→3′) | Primer size (bp) | Production size (bp) |
|---|---|---|---|---|---|
| C1 | SAM2 | F | GTCTCTAGTTGCCGCTGGTT | 20 | 170 |
| R | ACACACCTGGTCTCAAGTCG | 20 | |||
| C1 | SAM1 | F | CCGAGGACTTAAGAGCGCAA | 20 | 141 |
| R | TCAAACCAGCGTCACCTTGA | 20 | |||
| C2 | MTQ1 | F | ACACGTCCCATTGCAGTACA | 20 | 107 |
| R | TCACCCATTCCTCGGTTTCC | 20 | |||
| C2 | MTQ2 | F | ATGTGTGCCAGATGTCCCAG | 20 | 92 |
| R | TCAGTAATCGCCATCCCGTC | 20 | |||
| C3 | SAH1 | F | TGGGTTGTGCTACTGGTCAC | 20 | 166 |
| R | TTTGGCAAAACGTGGACACC | 20 | |||
| M1 | CYS3 | F | CGCAGTCAACTACCCAGGTT | 20 | 144 |
| R | CTTGTGGAGGAGGCGAACTT | 20 | |||
| M2 | STR3 | F | GAAACCCGACCAGAAGTGT | 19 | 129 |
| R | TAAGTAAGACGAGCCCACG | 19 | |||
| M3 | MHT1 | F | TTGAGCACCCCGGAAAAGTT | 20 | 122 |
| R | CCAAAAGGATTCGCTCGT | 18 | |||
| M3 | SAM4 | F | TGAGCACGGTGTCTTGAGAG | 20 | 122 |
| R | GGTTGAAGCTGACGCAGTTG | 20 | |||
| M3 | MET6 | F | AGTTGCAAAAGGAGGCTGGT | 20 | 199 |
| R | ACGTCGACAGCCTTTTCAGT | 20 | |||
| L1 | CYS3 | F | CGCAGTCAACTACCCAGGTT | 20 | 144 |
| R | CTTGTGGAGGAGGCGAACTT | 20 | |||
| L1 | STR3 | F | GAAACCCGACCAGAAGTGT | 19 | 129 |
| R | TAAGTAAGACGAGCCCACG | 19 | |||
| L2 | ARO8 | F | AAAAGTTTTGGCCCCAGGGA | 20 | 139 |
| R | GGATAGCGTAGCGTTGACCA | 20 | |||
| L3 | ARO10 | F | CGGAGACTTCGACGGAAAGT | 20 | 160 |
| R | GCACTTTAGCTGTTCGGGGA | 20 | |||
| L3 | PDC6 | F | CGGTATCTCGCAGGTGTTGT | 20 | 179 |
| R | ACGGCTTTAACCCCCATCTG | 20 | |||
| L3 | PDC1 | F | ACGACGTCAAGGCTGAAACT | 20 | 123 |
| R | TACCGACGTAAACACCACCG | 20 | |||
| L4 | ADH5 | F | TGCTGAAGTTGCCCCAATCT | 20 | 105 |
| R | CGCATGCACCGGATATAGT | 19 | |||
| L4 | SFA1 | F | TGCTGCCTGTTTACTGGGTT | 20 | 150 |
| R | GAAGCGCCCCTTAACTTTGC | 20 | |||
| L4 | ADH4 | F | ACAACGTCACTCCAGCTGTT | 20 | 161 |
| R | ACCCTTCAAAGCACAGGCAT | 20 | |||
| L4 | ADH3 | F | ATTTACATGCTTGGCACGGC | 20 | 123 |
| R | AATCACCGACTTTCCAGCCC | 20 | |||
| L4 | ADH1 | F | TTCAAGCCGCTCACATTCCT | 20 | 130 |
| R | CCGGAGATAGCAACCCAGTG | 20 | |||
| Transport | MUP3 | F | TGGTCCAAGTACGTCAGCA | 19 | 180 |
| R | CAACTTGACCGGTGCTTTT | 19 | |||
| Transport | MUP1 | F | CATTAGCGCGGGTTTGCTTT | 20 | 164 |
| R | ACACCGACTCGCCATTTGAA | 20 | |||
| Transport | SAM3 | F | ATCACGTGCTGCCAAAGGTA | 20 | 111 |
| R | GAACCACTGAGCAGTCTGGG | 20 | |||
| Reference gene | UBC6 | F | CGAATGGACGTTTCAAGCCC | 20 | 143 |
| R | TCCTGTCGTGGCTTCATCAC | 20 |
TABLE 2.
Primer sequences for gene transcription analysis in Lactobacillus buchneri
| Reaction | Gene | Primer direction | Sequences (5′→3′) | Primer size (bp) | Production size (bp) |
|---|---|---|---|---|---|
| C1 | metK | F | GTTGCCAAGCCCGTTTCAAT | 20 | 160 |
| R | ACGCTGCGGTCTGTTCATAA | 20 | |||
| C2 | ubiE | F | GGCTGGTTGACACTTACGGA | 20 | 198 |
| R | GCGGTCCTTTTGCGTTTTCT | 20 | |||
| C4 | pfs | F | AAGAAGCCTTGTCTGGCGAA | 20 | 120 |
| R | TGCCGGCTTGAACTTTACCA | 20 | |||
| C5 | luxS | F | TTGACCTGCGATTGACCCAG | 20 | 180 |
| R | CTTCGGTGGTGCTGTGTTTC | 20 | |||
| M3 | metE | F | ATTCTGCCGACCACGACAAT | 20 | 182 |
| R | TATTCACCGTGCACCAGGAC | 20 | |||
| Transport | meti1 | F | TATCGCGCCAGTAACCCAAA | 20 | 148 |
| R | TGCAGCTTCAATGACACCCT | 20 | |||
| Reference gene | recA | F | ATTGGTAACCGTGTCCGCAT | 20 | 197 |
| R | TCACGGCCTTGACCAATTCT | 20 |
Physical and chemical parameters analysis.
Temperature was measured by inserting thermometers into fermented grains in the sampling location of the pit (4). The moisture content was measured with the gravimetric method by drying at 60°C for 48 h (45). The reducing sugar content was measured with a colorimetric method using 3,5-dinitrosalicylic acid (4). The concentrations of ethanol, lactate, acetate, and methionine were determined by high-performance liquid chromatography (HPLC), as in our previous study (46). The variations in physical and chemical parameters are listed in Fig. S1.
3-(Methylthio)-1-propanol and dimethyl disulfide determination. (i) Chemicals.
3-(Methylthio)-1-propanol, dimethyl disulfide, and 4-(methylthio)-1-butanol (internal standard) were purchased from Sigma-Aldrich Co. Ltd. (Shanghai, China). Sodium chloride and anhydrous sodium sulfate were purchased from the China National Pharmaceutical Group Corp. (Shanghai, China). Ethanol (99.9%, HPLC grade) was purchased from J&K Chemical Ltd. (Shanghai, China). All standard compounds were gas chromatography (GC) grade.
(ii) Sample pretreatment.
3-(Methylthio)-1-propanol and dimethyl disulfide generated by the monoculture and coculture in the laboratory-scale fermentations, and fermented grains from Chinese liquor distillery were analyzed by headspace solid-phase microextraction gas chromatography-pulsed flame photometric detection (HS-SPME-GC-PFPD) (7). The fermented grains were pretreated as follows: for each sample, we removed a layer of a 2-cm rind from the surface to eliminate any possible fluctuations in volatile composition and contamination from packaging. Twenty milliliters of bidistilled water was added to 20-g samples, soaked to improve agitation, and then well mixed to reduce the variability of the sample due to the nonuniformity of the different parts of the sample, and the mixture was obtained for HS-SPME-GC-PFPD analysis.
(iii) HS-SPME-GC-PFPD analysis.
The sampling conditions were as follows: the mixture (8 ml) with 10 μl of 4-(methylthio)-1-butanol (80 mg/liter, internal standard), 3 g of NaCl, and a 4-mm Teflon-coated stir bar were added into a 20-ml headspace vial, which was flushed with argon and then sealed with a polytetrafluoroethylene (PTFE)-faced silicone septum. The samples were equilibrated at 45°C for 15 min, and then a 2-cm fiber coated with 50/30 μm divinylbenzene-carboxen-polydimethylsiloxane (DVB/CAR/PDMS; Supelco, Bellefonte, PA) was exposed to the headspace of the vial and extracted for 30 min at 45°C. Then, the fiber was introduced into the GC injection port at 250°C for 5 min of desorption. HS-SPME-GC-PFPD analysis was conducted on an Agilent 7890A GC coupled with a pulsed flame photometric detector (OI Analytical model 5380; OI Analytical Co., College Station, TX). Separation was achieved using a DB-FFAP column (30 m by 0.32 mm inside diameter [i.d.], 1-μm film thickness; J&W Scientific). The GC-PFPD conditions were from a previous method (8). Sulfur compound identification was achieved by standard compounds and retention index values. Standard calibration curves for sulfur volatiles were obtained by adding authentic sulfur compound standards of known concentration to an aqueous ethanolic solution (6% [vol/vol]). A series of concentration levels of the standards in aqueous ethanolic solution were prepared and analyzed in the same way as the sample (8). Each measurement was performed in triplicate.
Bioinformatic analysis. (i) Related enzyme identification and the metabolic network prediction.
The enzymes associated with 3-(methylthio)-1-propanol and dimethyl disulfide were identified by KEGG pathways and the MetaCyc Metabolic Pathway Database. According to the results, 31 enzymes were mapped to the generation of sulfur compounds, synthesis of methionine, and conversion of sulfur sources (Fig. S2); the schematic of the sulfur metabolic network was then reconstructed according to the functions of these 31 enzymes (Fig. S3). The detailed information of 31 enzymes is listed in Table S2.
(ii) Identification of the core microbiota.
Identification of the core microbiota was based on 31 enzymes and the sulfur metabolic network. First, we analyzed the transcript abundances of genes encoding these 31 enzymes in individual genera. Moreover, an individual genus could possess more than one enzyme activity among these 31 enzymes. For example, Saccharomyces expressed genes encoding 23 enzymes (i.e., there were 23 occurrences of Saccharomyces), and the distribution frequency of Saccharomyces was 74.2% (23/31). As a result, the distribution frequency of an individual genus was estimated by counting the occurrences of these 31 enzymes. The core microbiota was identified by combining both transcript abundances (>1,000 FPKM) of genes encoding 31 enzymes and distribution frequencies (>20%) in 31 enzymes (Fig. 3). Moreover, the core and noncore microbiota participating in the pathway were identified.
(iii) Statistical analyses.
Statistical testing for gene expression was performed in R with edgeR, using the two-replicate method (47). Different gene expression profiles in the sulfur metabolic pattern were illustrated using Heatmap Illustrator version 1.0 (the Cuckoo Workgroup, Wuhan, China) (48). A single-tailed independent Student's t test (P < 0.05) was conducted to test significant differences between monoculture and coculture with SPSS Statistics version 20 (IBM, Yorktown Heights, NY).
Accession number(s).
The metatranscriptomic sequence data have been submitted to the DNA Data Bank of Japan (DDBJ) under accession numbers DRA005616 and DRA005855.
Supplementary Material
ACKNOWLEDGMENTS
We thank Pete Chandrangsu (Cornell University) for revising the language of the manuscript.
We gratefully acknowledge the National Natural Science Foundation of China (grants 31530055 and 31371822), the National Key R&D Program (grant 2016YFD0400503), the Priority Academic Program Development of Jiangsu Higher Education Institutions, and the 111 Project (no. 111-2-06).
We declare no conflicts of interest.
Footnotes
Supplemental material for this article may be found at https://doi.org/10.1128/AEM.01475-17.
REFERENCES
- 1.Zhu SK, Lu X, Ji KH, Guo KF, Li YL, Wu CY, Xu GW. 2007. Characterization of flavor compounds in Chinese liquor Moutai by comprehensive two-dimensional gas chromatography/time-of-flight mass spectrometry. Anal Chim Acta 597:340–348. doi: 10.1016/j.aca.2007.07.007. [DOI] [PubMed] [Google Scholar]
- 2.Wang HY, Gao YB, Fan QW, Xu Y. 2011. Characterization and comparison of microbial community of different typical Chinese liquor Daqus by PCR-DGGE. Lett Appl Microbiol 53:134–140. doi: 10.1111/j.1472-765X.2011.03076.x. [DOI] [PubMed] [Google Scholar]
- 3.Jin G, Zhu Y, Xu Y. 2017. Mystery behind Chinese liquor fermentation. Trends Food Sci Technol 63:18–28. doi: 10.1016/j.tifs.2017.02.016. [DOI] [Google Scholar]
- 4.Wang P, Wu Q, Jiang X, Wang Z, Tang J, Xu Y. 2017. Bacillus licheniformis affects the microbial community and metabolic profile in the spontaneous fermentation of Daqu starter for Chinese liquor making. Int J Food Microbiol 250:59–67. doi: 10.1016/j.ijfoodmicro.2017.03.010. [DOI] [PubMed] [Google Scholar]
- 5.Wu LH, Lu ZM, Zhang XJ, Wang ZM, Yu YJ, Shi JS, Xu ZH. 2017. Metagenomics reveals flavour metabolic network of cereal vinegar microbiota. Food Microbiol 62:23–31. doi: 10.1016/j.fm.2016.09.010. [DOI] [PubMed] [Google Scholar]
- 6.Landaud S, Helinck S, Bonnarme P. 2008. Formation of volatile sulfur compounds and metabolism of methionine and other sulfur compounds in fermented food. Appl Microbiol Biotechnol 77:1191–1205. doi: 10.1007/s00253-007-1288-y. [DOI] [PubMed] [Google Scholar]
- 7.Fan WL, Qian MC. 2005. Headspace solid phase microextraction and gas chromatography-olfactometry dilution analysis of young and aged Chinese “Yanghe Daqu” liquors. J Agric Food Chem 53:7931–7938. doi: 10.1021/jf051011k. [DOI] [PubMed] [Google Scholar]
- 8.Sha S, Chen S, Qian M, Wang C, Xu Y. 2017. Characterization of the typical potent odorants in Chinese roasted sesame-like flavor type liquor by headspace solid phase microextraction-aroma extract dilution analysis, with special emphasis on sulfur-containing odorants. J Agric Food Chem 65:123–131. doi: 10.1021/acs.jafc.6b04242. [DOI] [PubMed] [Google Scholar]
- 9.Martínez-Cuesta MDC, Pelaez C, Requena T. 2013. Methionine metabolism: major pathways and enzymes involved and strategies for control and diversification of volatile sulfur compounds in cheese. Crit Rev Food Sci Nutr 53:366–385. doi: 10.1080/10408398.2010.536918. [DOI] [PubMed] [Google Scholar]
- 10.Hébert A, Forquin-Gomez M-P, Roux A, Aubert J, Junot C, Loux V, Heilier J-F, Bonnarme P, Beckerich J-M, Landaud S. 2011. Exploration of sulfur metabolism in the yeast Kluyveromyces lactis. Appl Microbiol Biotechnol 91:1409–1423. doi: 10.1007/s00253-011-3481-2. [DOI] [PubMed] [Google Scholar]
- 11.Hébert A, Forquin-Gomez M-P, Roux A, Aubert J, Junot C, Heilier J-F, Landaud S, Bonnarme P, Beckerich J-M. 2013. New insights into sulfur metabolism in yeasts as revealed by studies of Yarrowia lipolytica. Appl Environ Microbiol 79:1200–1211. doi: 10.1128/AEM.03259-12. [DOI] [PMC free article] [PubMed] [Google Scholar]
- 12.Zhang Q, Jia KZ, Xia ST, Xu YH, Liu RS, Li HM, Tang YJ. 2016. Regulating Ehrlich and demethiolation pathways for alcohols production by the expression of ubiquitin-protein ligase gene HUWE1. Sci Rep 6:20828. doi: 10.1038/srep20828. [DOI] [PMC free article] [PubMed] [Google Scholar]
- 13.Wolfe BE, Dutton RJ. 2015. Fermented foods as experimentally tractable microbial ecosystems. Cell 161:49–55. doi: 10.1016/j.cell.2015.02.034. [DOI] [PubMed] [Google Scholar]
- 14.Wang ZM, Lu ZM, Shi JS, Xu ZH. 2016. Exploring flavour-producing core microbiota in multispecies solid-state fermentation of traditional Chinese vinegar. Sci Rep 6:26818. doi: 10.1038/srep26818. [DOI] [PMC free article] [PubMed] [Google Scholar]
- 15.Song Z, Du H, Zhang Y, Xu Y. 2017. Unraveling core functional microbiota in traditional solid-state fermentation by high-throughput amplicons and metatranscriptomics sequencing. Front Microbiol 8:1294. doi: 10.3389/fmicb.2017.01294. [DOI] [PMC free article] [PubMed] [Google Scholar]
- 16.De Filippis F, Genovese A, Ferranti P, Gilbert JA, Ercolini D. 2016. Metatranscriptomics reveals temperature-driven functional changes in microbiome impacting cheese maturation rate. Sci Rep 6:21871. doi: 10.1038/srep21871. [DOI] [PMC free article] [PubMed] [Google Scholar]
- 17.Jung JY, Lee SH, Jin HM, Hahn Y, Madsen EL, Jeon CO. 2013. Metatranscriptomic analysis of lactic acid bacterial gene expression during kimchi fermentation. Int J Food Microbiol 163:171–179. doi: 10.1016/j.ijfoodmicro.2013.02.022. [DOI] [PubMed] [Google Scholar]
- 18.Jiang Y, Xiong X, Danska J, Parkinson J. 2016. Metatranscriptomic analysis of diverse microbial communities reveals core metabolic pathways and microbiome-specific functionality. Microbiome 4:2. doi: 10.1186/s40168-015-0146-x. [DOI] [PMC free article] [PubMed] [Google Scholar]
- 19.Sun J, Zhao D, Zhang F, Sun B, Zheng F, Huang M, Sun X, Li H. 2017. Joint direct injection and GC-MS chemometric approach for chemical profile and sulfur compounds of sesame-flavor Chinese Baijiu (Chinese liquor). Eur Food Res Technol doi: 10.1007/s00217-017-2938-7. [DOI] [Google Scholar]
- 20.Kong Y, Wu Q, Zhang Y, Xu Y. 2014. In situ analysis of metabolic characteristics reveals the key yeast in the spontaneous and solid-state fermentation process of Chinese light-style liquor. Appl Environ Microbiol 80:3667–3676. doi: 10.1128/AEM.04219-13. [DOI] [PMC free article] [PubMed] [Google Scholar]
- 21.Johanningsmeier SD, McFeeters RF. 2015. Metabolic footprinting of Lactobacillus buchneri strain LA1147 during anaerobic spoilage of fermented cucumbers. Int J Food Microbiol 215:40–48. doi: 10.1016/j.ijfoodmicro.2015.08.004. [DOI] [PubMed] [Google Scholar]
- 22.You L, Wang S, Zhou RP, Hu XQ, Chu YJ, Wang T. 2016. Characteristics of yeast flora in Chinese strong-flavoured liquor fermentation in the Yibin region of China. J Inst Brew 122:517–523. doi: 10.1002/jib.352. [DOI] [Google Scholar]
- 23.Graves T, Narendranath NV, Dawson K, Power R. 2007. Interaction effects of lactic acid and acetic acid at different temperatures on ethanol production by Saccharomyces cerevisiae in corn mash. Appl Microbiol Biotechnol 73:1190–1196. doi: 10.1007/s00253-006-0573-5. [DOI] [PubMed] [Google Scholar]
- 24.Pisyk S, Natorff R, Sienko M, Skoneczny M, Paszewski A, Brzywczy J. 2015. The Aspergillus nidulans metZ gene encodes a transcription factor involved in regulation of sulfur metabolism in this fungus and other Eurotiales. Curr Genet 61:115–125. doi: 10.1007/s00294-014-0459-5. [DOI] [PubMed] [Google Scholar]
- 25.Grabherr MG, Haas BJ, Yassour M, Levin JZ, Thompson DA, Amit I, Adiconis X, Fan L, Raychowdhury R, Zeng QD, Chen ZH, Mauceli E, Hacohen N, Gnirke A, Rhind N, di Palma F, Birren BW, Nusbaum C, Lindblad-Toh K, Friedman N, Regev A. 2011. Full-length transcriptome assembly from RNA-Seq data without a reference genome. Nat Biotechnol 29:644–652. doi: 10.1038/nbt.1883. [DOI] [PMC free article] [PubMed] [Google Scholar]
- 26.Trapnell C, Williams BA, Pertea G, Mortazavi A, Kwan G, van Baren MJ, Salzberg SL, Wold BJ, Pachter L. 2010. Transcript assembly and quantification by RNA-Seq reveals unannotated transcripts and isoform switching during cell differentiation. Nat Biotechnol 28:511–515. doi: 10.1038/nbt.1621. [DOI] [PMC free article] [PubMed] [Google Scholar]
- 27.Tan AW, Lee PR, Seow YX, Ong PK, Liu SQ. 2012. Volatile sulphur compounds and pathways of l-methionine catabolism in Williopsis yeasts. Appl Microbiol Biotechnol 95:1011–1020. doi: 10.1007/s00253-012-3963-x. [DOI] [PubMed] [Google Scholar]
- 28.LaSarre B, McCully AL, Lennon JT, McKinlay JB. 2017. Microbial mutualism dynamics governed by dose-dependent toxicity of cross-fed nutrients. ISME J 11:337–348. doi: 10.1038/ismej.2016.141. [DOI] [PMC free article] [PubMed] [Google Scholar]
- 29.Wu Q, Kong Y, Xu Y. 2015. Flavor profile of Chinese liquor is altered by interactions of intrinsic and extrinsic microbes. Appl Environ Microbiol 82:422–430. doi: 10.1128/AEM.02518-15. [DOI] [PMC free article] [PubMed] [Google Scholar]
- 30.Xiu L, Kunliang G, Hongxun Z. 2012. Determination of microbial diversity in Daqu, a fermentation starter culture of Maotai liquor, using nested PCR-denaturing gradient gel electrophoresis. World J Microbiol Biotechnol 28:2375–2381. doi: 10.1007/s11274-012-1045-y. [DOI] [PubMed] [Google Scholar]
- 31.Thage BV, Rattray FP, Laustsen MW, Ardo Y, Barkholt V, Houlberg U. 2004. Purification and characterization of a branched-chain amino acid aminotransferase from Lactobacillus paracasei subsp paracasei CHCC. 2115. J Appl Microbiol 96:593–602. doi: 10.1111/j.1365-2672.2004.02163.x. [DOI] [PubMed] [Google Scholar]
- 32.Liu M, Nauta A, Francke C, Siezen RJ. 2008. Comparative genomics of enzymes in flavor-forming pathways from amino acids in lactic acid bacteria. Appl Environ Microbiol 74:4590–4600. doi: 10.1128/AEM.00150-08. [DOI] [PMC free article] [PubMed] [Google Scholar]
- 33.Isnard AD, Thomas D, Surdin-Kerjan Y. 1996. The study of methionine uptake in Saccharomyces cerevisiae reveals a new family of amino acid permeases. J Mol Biol 262:473–484. doi: 10.1006/jmbi.1996.0529. [DOI] [PubMed] [Google Scholar]
- 34.Rouillon A, Surdin-Kerjan Y, Thomas D. 1999. Transport of sulfonium compounds. Characterization of the S-adenosylmethionine and S-methylmethionine permeases from the yeast Saccharomyces cerevisiae. J Biol Chem 274:28096–28105. doi: 10.1074/jbc.274.40.28096. [DOI] [PubMed] [Google Scholar]
- 35.Yin S, Lang T, Xiao X, Liu L, Sun B, Wang C. 2015. Significant enhancement of methionol production by co-expression of the aminotransferase gene ARO8 and the decarboxylase gene ARO10 in Saccharomyces cerevisiae. FEMS Microbiol Lett 362:1–7. doi: 10.1093/femsle/fnu043. [DOI] [PubMed] [Google Scholar]
- 36.Mendes F, Sieuwerts S, de Hulster E, Almering MJH, Luttik MAH, Pronk JT, Smid EJ, Bron PA, Daran-Lapujade P. 2013. Transcriptome-based characterization of interactions between Saccharomyces cerevisiae and Lactobacillus delbrueckii subsp bulgaricus in lactose-grown chemostat cocultures. Appl Environ Microbiol 79:5949–5961. doi: 10.1128/AEM.01115-13. [DOI] [PMC free article] [PubMed] [Google Scholar]
- 37.Gobbetti M, Corsetti A, Rossi J. 1994. The sourdough microflora. Interactions between lactic acid bacteria and yeasts: metabolism of amino acids. World J Microbiol Biotechnol 10:275–279. [DOI] [PubMed] [Google Scholar]
- 38.Meng X, Wu Q, Wang L, Wang DQ, Chen LQ, Xu Y. 2015. Improving flavor metabolism of Saccharomyces cerevisiae by mixed culture with Bacillus licheniformis for Chinese Maotai-flavor liquor making. J Ind Microbiol Biotechnol 42:1601–1608. doi: 10.1007/s10295-015-1647-0. [DOI] [PubMed] [Google Scholar]
- 39.Juck D, Charles T, Whyte LG, Greer CW. 2000. Polyphasic microbial community analysis of petroleum hydrocarbon-contaminated soils from two northern Canadian communities. FEMS Microbiol Ecol 33:241–249. doi: 10.1111/j.1574-6941.2000.tb00746.x. [DOI] [PubMed] [Google Scholar]
- 40.Bokulich NA, Ohta M, Richardson PM, Mills DA. 2013. Monitoring seasonal changes in winery-resident microbiota. PLoS One 8:e66437. doi: 10.1371/journal.pone.0066437. [DOI] [PMC free article] [PubMed] [Google Scholar]
- 41.Rodríguez A, Rodríguez M, Luque MI, Justesen AF, Córdoba JJ. 2012. A comparative study of DNA extraction methods to be used in real-time PCR based quantification of ochratoxin A-producing molds in food products. Food Control 25:666–672. doi: 10.1016/j.foodcont.2011.12.010. [DOI] [Google Scholar]
- 42.Zott K, Claisse O, Lucas P, Coulon J, Lonvaud-Funel A, Masneuf-Pomarede I. 2010. Characterization of the yeast ecosystem in grape must and wine using real-time PCR. Food Microbiol 27:559–567. doi: 10.1016/j.fm.2010.01.006. [DOI] [PubMed] [Google Scholar]
- 43.Haarman M, Knol J. 2006. Quantitative real-time PCR analysis of fecal Lactobacillus species in infants receiving a prebiotic infant formula. Appl Environ Microbiol 72:2359–2365. doi: 10.1128/AEM.72.4.2359-2365.2006. [DOI] [PMC free article] [PubMed] [Google Scholar]
- 44.Livak KJ, Schmittgen TD. 2001. Analysis of relative gene expression data using real-time quantitative PCR and the 2−ΔΔCT method. Methods 25:402–408. doi: 10.1006/meth.2001.1262. [DOI] [PubMed] [Google Scholar]
- 45.Wang XS, Du H, Xu Y. 2017. Source tracking of prokaryotic communities in fermented grain of Chinese strong-flavor liquor. Int J Food Microbiol 244:27–35. doi: 10.1016/j.ijfoodmicro.2016.12.018. [DOI] [PubMed] [Google Scholar]
- 46.Hu XL, Du H, Ren C, Xu Y. 2016. Illuminating anaerobic microbial community and cooccurrence patterns across a quality gradient in Chinese liquor fermentation pit muds. Appl Environ Microbiol 82:2506–2515. doi: 10.1128/AEM.03409-15. [DOI] [PMC free article] [PubMed] [Google Scholar]
- 47.Robinson MD, McCarthy DJ, Smyth GK. 2010. edgeR: a Bioconductor package for differential expression analysis of digital gene expression data. Bioinformatics 26:139–140. doi: 10.1093/bioinformatics/btp616. [DOI] [PMC free article] [PubMed] [Google Scholar]
- 48.Deng W, Wang Y, Liu Z, Cheng H, Xue Y. 2014. Hemi: a toolkit for illustrating heatmaps. PLoS One 9:e111988. doi: 10.1371/journal.pone.0111988. [DOI] [PMC free article] [PubMed] [Google Scholar]
- 49.Seiflein TA, Lawrence JG. 2001. Methionine-to-cysteine recycling in Klebsiella aerogenes. J Bacteriol 183:336–346. doi: 10.1128/JB.183.1.336-346.2001. [DOI] [PMC free article] [PubMed] [Google Scholar]
- 50.Nixon MR, Saionz KW, Koo MS, Szymonifka MJ, Jung HM, Roberts JP, Nandakumar M, Kumar A, Liao RL, Rustad T, Sacchettini JC, Rhee KY, Freundlich JS, Sherman DR. 2014. Folate pathway disruption leads to critical disruption of methionine derivatives in Mycobacterium tuberculosis. Chem Biol 21:819–830. doi: 10.1016/j.chembiol.2014.04.009. [DOI] [PubMed] [Google Scholar]
Associated Data
This section collects any data citations, data availability statements, or supplementary materials included in this article.