Abstract
A marked bias towards risk aversion has been observed in nearly every species tested1–4. A minority of individuals, however, instead seem to prefer risk (repeatedly choosing uncertain large rewards over certain but smaller rewards), and even risk-averse individuals sometimes opt for riskier alternatives2,5. It is not known how neural activity underlies such important shifts in decision-making—either as a stable trait across individuals or at the level of variability within individuals. Here we describe a model of risk-preference in rats, in which stable individual differences, trial-by-trial choices, and responses to pharmacological agents all parallel human behaviour. By combining new genetic targeting strategies with optical recording of neural activity during behaviour in this model, we identify relevant temporally specific signals from a genetically and anatomically defined population of neurons. This activity occurred within dopamine receptor type-2 (D2R)-expressing cells in the nucleus accumbens (NAc), signalled unfavourable outcomes from the recent past at a time appropriate for influencing subsequent decisions, and also predicted subsequent choices made. Having uncovered this naturally occurring neural correlate of risk selection, we then mimicked the temporally specific signal with optogenetic control during decision-making and demonstrated its causal effect in driving risk-preference. Specifically, risk-preferring rats could be instantaneously converted to risk-averse rats with precisely timed phasic stimulation of NAc D2R cells. These findings suggest that individual differences in risk preference, as well as real-time risky decision-making, can be in large part explained by the encoding in D2R-expressing NAc cells of prior unfavourable outcomes during decision-making.
Previous work has implicated ventral tegmental area dopamine neurons6–8, as well as their downstream targets (including NAc8–11, prefrontal cortex12–14, and orbitofrontal cortex (OFC)15,16) in risk-preference. Ventral tegmental area stimulation, for example, has been shown to increase risk-seeking choices17, and pharmacological manipulations have implicated dopamine release in NAc8 and prefrontal cortex14 in modulating risk-preference.
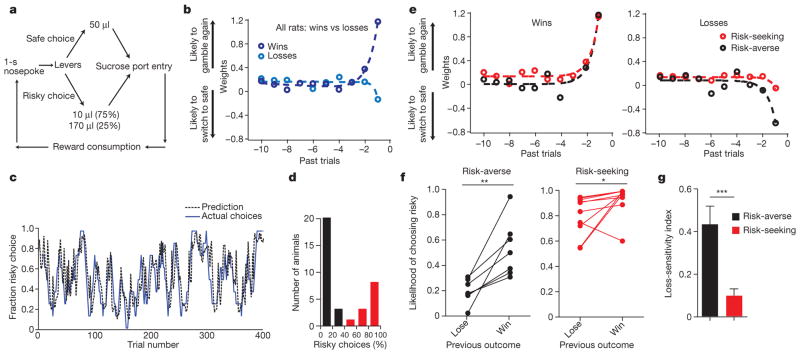
We devised a task in which rats repeatedly chose between a ‘safe’ lever, which yielded the same volume of sucrose on every trial, and a ‘risky’ lever, which yielded a small reward on 75% of trials and a large reward on 25% of trials. The expected value was constant across the two levers (Fig. 1a). Each day, each rat performed 50 forced choice trials, in which only one lever entered the operant chamber, followed by 200 free choice trials, in which both levers entered the chamber, allowing the rat to choose. The less favourable outcome of risky lever selection represented a loss relative to the expected value of each trial; we refer to this outcome as a loss. Each trial was initiated with a 1-s nosepoke hold just prior to lever press; we refer to this temporal window as the decision period.
Figure 1. Trait variability in risk-aversion as loss-sensitivity: rat behavioural model.
a, Rats initiated each trial with a 1-s nosepoke, then chose either the ‘safe’ constant-reward lever or the ‘risky’ variable-reward lever. The safe lever delivered a 50-μl reward. The risky lever delivered a 10-μl reward with 75% probability and a 170-μl reward with 25% probability. The expected value of each choice was 50 μl. Rats retrieve the reward before initiating the next trial. b, Model coefficients revealed rats were more likely to choose the risky lever after a gain but less likely to choose the risky lever after a loss. Larger weights indicate a larger contribution of that outcome on choice. Coefficients were fit by exponential functions (Extended Data Fig. 2). Offset slightly above zero relates to the long tail of run lengths (Extended Data Fig. 3). c, Logistic regression trained on two-thirds of choices predicted choices in held-out test data with 80.2% accuracy (training data: n = 17 rats, 6,593 trials; test data: n = 17 rats, 3,267 trials; P < 0.001 by Monte Carlo simulation). Shown are 400 trials of test data from one rat. Actual choices are smoothed with an 8-trial boxcar filter; prediction is unsmoothed. d, Histogram of risk preference. Black indicates risk-averse (<50% risky choices); red indicates risk-seeking (>50% risky choices) rats. e, Weights for risk-seeking and risk-averse rats showed a difference in response to loss. f, Both risk-seeking (n = 10, Wilcoxon matched-pairs test, W = −41, P =0.03) and risk-averse (n = 7, Wilcoxon matched-pairs test, W = −28, P =0.01) rats were more likely to choose risk after a gain than after a loss. This effect was larger in risk-averse rats (n = 17, two-way analysis of variance (ANOVA), interaction F2,20 =6.454, P <0.01). g, Risk-averse rats were more loss-sensitive than risk-seeking rats (n = 10 risk-seeking, 7 risk-averse rats, Mann–Whitney U =2.00, P = 0.0004). Data shown are mean and s.e.m.
Rats adapted their choices to track switches in the risk profile of the two levers (Extended Data Fig. 1), yet, when task parameters were held constant, displayed consistent risk-preferences across days (Extended Data Fig. 2). Furthermore, rat behaviour recapitulated key features of human behaviour. Most individuals exhibited stable risk-aversion5 (Fig. 1d and Extended Data Figs 2 and 3), adopted a win-stay/lose-switch decision strategy18,19 (Fig. 1b, e, f), and showed modulation of behaviour by pharmacological agents consistent with the human clinical literature20 (Fig. 2a, b).
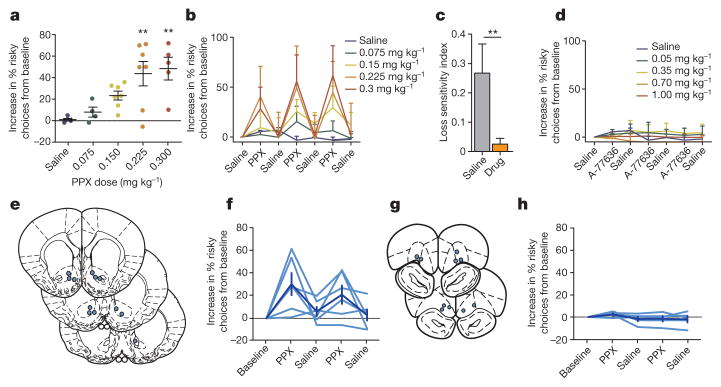
Figure 2. D2R agonist in the NAc increases risk-seeking behaviour in rats.
a, Points represent a rat’s mean risky choices across 3 days of drug administration. Systemic PPX administration dose-dependently increased risky choices (Pearson’s r2 =0.49, P < 0.0001; in order of increasing dose, n = 5, 4, 7, 7 and 5 rats); doses ≥0.225 mg kg−1 significantly increased risk-seeking (one-way ANOVA, F4,25 =6.115, P =0.002; Bonferroni’s multiple comparison post-hoc test, **P <0.01 for both 0.225 mg kg−1 and 0.3 mg kg−1; n = 4–7 animals per dose, as above). b, This effect was reversible across days (n = 4–7 animals per dose, as above). c, In rats in which PPX significantly increased risk-seeking, it also decreased loss-sensitivity (t-test, t10 =3.89, **P =0.003). d, The D1 agonist A-77636 did not alter risk-preference (one-way ANOVA, F4,27 =2.63, P >0.05; Bonferroni’s multiple comparison post-hoc test reveals no significant effect at any dose tested. In order of increasing dose, n = 5, 6, 6, 6 and 5 rats). e, f, Bilateral administration of PPX into the NAc increased risk-preference (n = 6 rats; repeated-measures ANOVA, F4,20 =4.455, P < 0.01). Injection sites are indicated on coronal diagrams as blue circles. g, h, Bilateral administration of PPX into the OFC had no effect on risk-seeking (n = 5 rats; repeated-measures ANOVA, F4,16 =1.307, P = 0.31). The effect of PPX administration into the NAc was significantly larger than the effect of administration into the OFC (two-way repeated measures ANOVA; interaction F4,36 =2.989, P = 0.03; Bonferroni post-hoc test; P < 0.05 on each drug administration day). Data are mean and s.e.m.
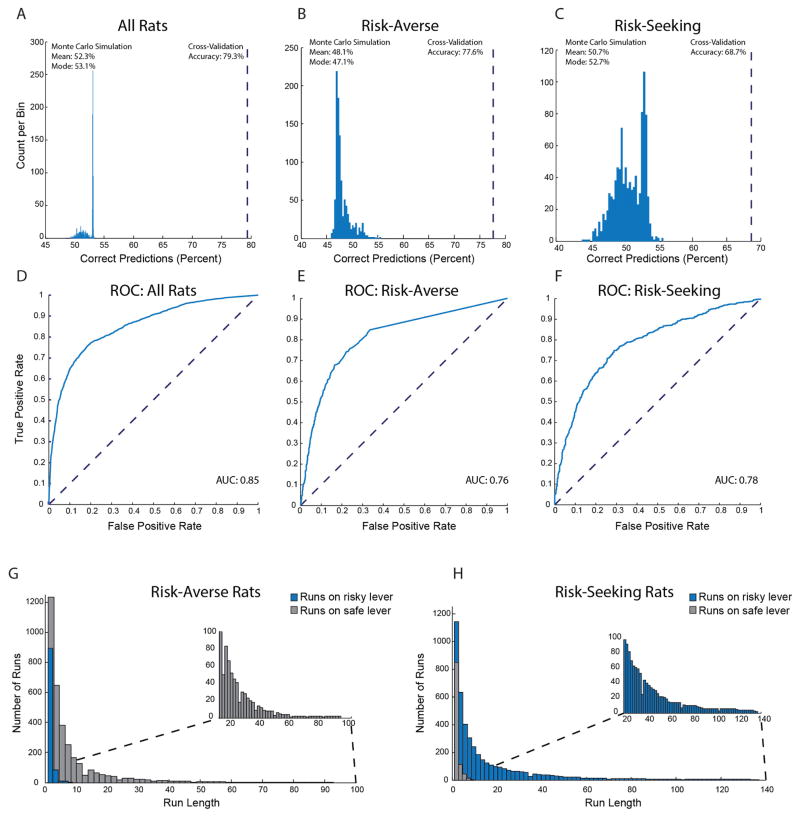
Rat behaviour was approximated by a model that assumes subjects integrate over recent outcomes (Fig. 1c and Extended Data Fig. 3). Model coefficients suggested rats were more likely to choose the risky lever after large gain outcomes but to switch to the safe lever after losses (Fig. 1b). Furthermore, while most rats exhibited risk-averse behaviour, a subset was consistently risk-seeking (Fig. 1d). Construction of separate models for the risk-seeking and risk-averse rats revealed similar coefficients associated with gain outcomes but divergent coefficients in response to loss (Fig. 1e). Both risk-seeking and risk-averse rats were more likely to make a risky choice if the previous trial yielded a gain rather than a loss, but this effect was significantly larger in risk-averse rats (Fig. 1f). Accordingly, loss sensitivity (Methods) was larger for risk-averse than for risk-seeking rats (Fig. 1g).
We next examined whether rat behaviour aligned with known pharmacological effects on risk-preference in humans. Population studies reveal substantial increases in incidence of problem gambling among patients taking D2/D3 agonists for Parkinson disease20. Laboratory studies reveal that these agents reduce neural and behavioural response to loss21,22. Concordant with this clinical evidence, we found systemic administration of pramipexole (PPX) increased risk-seeking choices in rats in a dose-dependent manner (Fig. 2a). This effect was consistent across several days of testing (Fig. 2b), and in animals in which PPX significantly increased risk-seeking, a reduction in loss-sensitivity was observed (Fig. 2c).
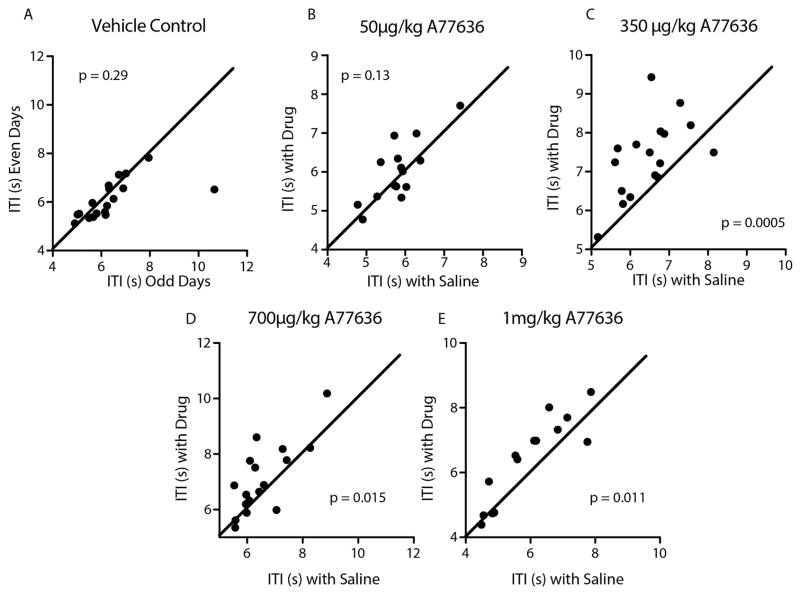
By contrast, the D1 agonist A-77636, previously explored as a treatment for Parkinson disease23, did not significantly alter risk-preference (Fig. 2d) despite robust bioavailability evidenced by lengthened intertrial intervals (Extended Data Fig. 4). To localize the effect of PPX, we implanted bilateral cannulae into both the NAc (Fig. 2e, f) and the OFC (Fig. 2g, h) and infused PPX intracranially. We found a significant effect on risk-preference when PPX was infused directly into the NAc (Fig. 2f) but not when infused into the OFC (Fig. 2h).
Although D3R signalling may contribute to effects of PPX on gambling, we suspected that the large D2-expressing neural population in NAc might have a primary role. The sensitivity and kinetics of D2Rs have led to the hypothesis that D2R-expressing cells detect pauses or dips in dopamine signalling, potentially enabling these cells for loss detection24. Disruption of this circuit could profoundly affect subjects’ ability to modify their behaviour in response to losses, leading to maladaptive strategies in the face of cost/benefit trade-offs, such as gambling25.
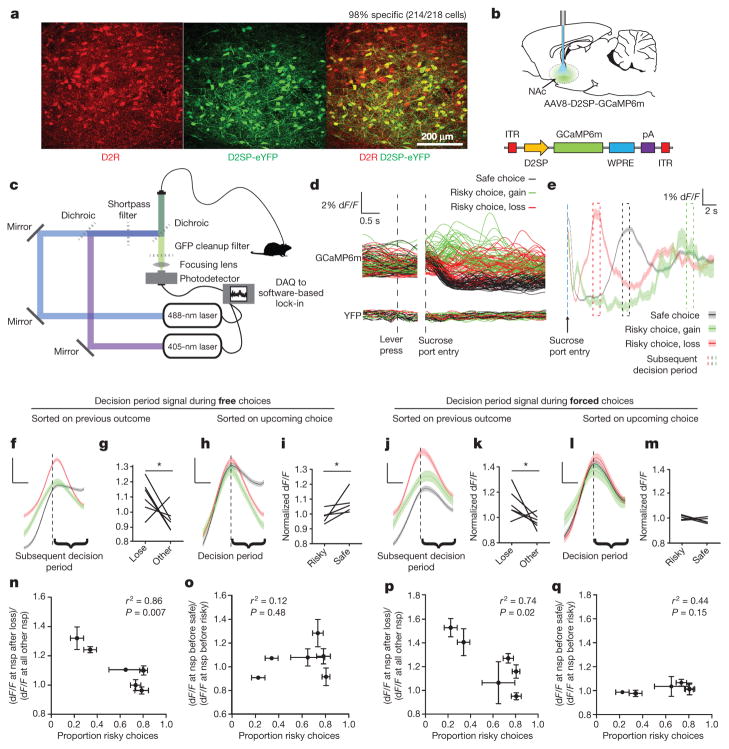
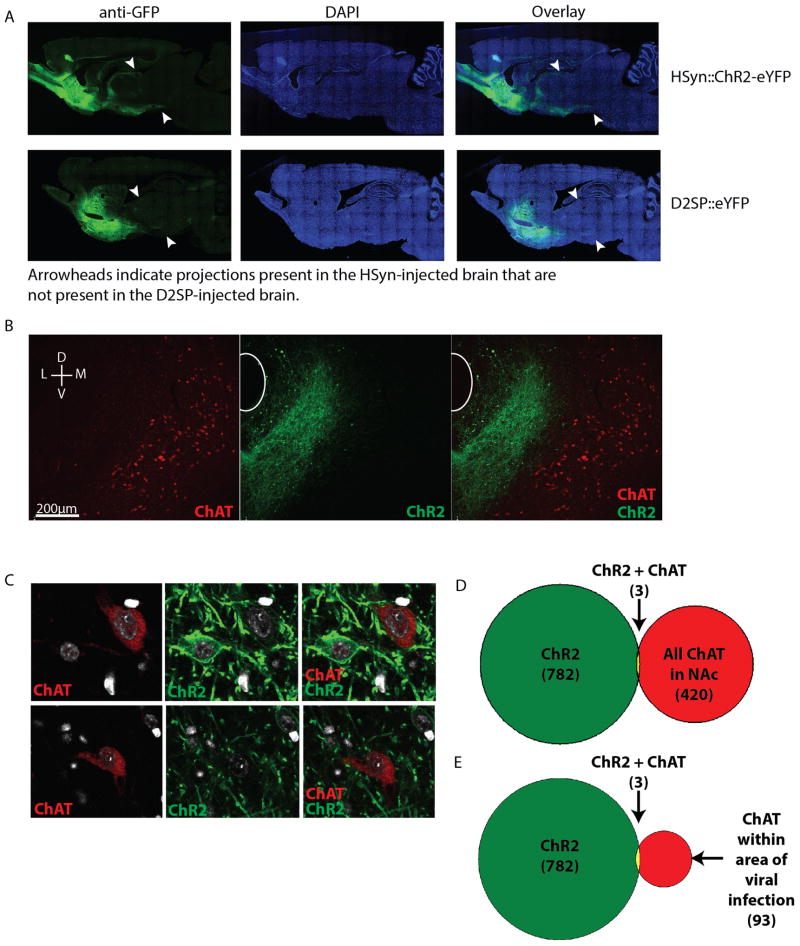
If D2R+ NAc cells are relevant to risk preference, their activity might reflect reward size, outcomes of previous gambles, or upcoming choice. The NAc contains a heterogeneous mixture of cells, however, posing challenges for assessment of D2R-specific neuron activity. To isolate signals from these cells, we developed a D2R-specific promoter, termed D2SP (Extended Data Fig. 5 and Methods). The D2SP construct markedly improved transgene expression and exhibited 98% specificity (Fig. 3a and Extended Data Fig. 5), with minimal expression in cholinergic interneurons after injection in the medial NAc core (Extended Data Fig. 6).
Figure 3. Activity in D2R-expressing cells in the NAc encodes loss-relevant task variables and predicts upcoming choice.
a, Adeno-associated viral (AAV) vector AAV8-D2SP-eYFP exhibits 98.2% specificity and 86.8% penetrance (n = 2 rats, 214 of 218 cells that expressed YFP co-labelled for D2R). b, Photometry recordings were taken from NAc cells expressing AAV8-D2SP-GCaMP6m. c, Dual-excitation-wavelength fibre photometry rig (Methods). d, 50 traces of each trial type after isosbestic normalization in GCaMP6m- and YFP-expressing rats. e, Representative mean outcome-period traces. Blue dashed line indicates sucrose port entry. Later dashed boxes indicate median time of next decision period following: loss (red), gain (green), or safe (black) outcomes (1 rat, 911 trials, shaded area indicates s.e.m.). f, Mean decision-period signal sorted on previous outcome (6 rats, 5,693 trials). g, Decision-period signal is larger after losses than other outcomes (n = 6 rats; paired t-test, t5 =2.371, *P =0.032). h, Mean decision-period signal sorted on upcoming choice (6 rats, 5,693 trials). i, Decision-period signal was larger preceding safe versus risky choices (n = 6 rats; paired t-test, t5 =2.374, *P =0.038). j, Mean decision-period signal sorted on previous outcome, during forced-choice trials (6 rats, 1,550 trials). k, Decision-period signal was larger after losses during forced-choice trials (n = 6 rats; paired t-test, t5 =2.126, *P =0.043). l, Mean forced-choice decision-period signal, sorted by outcome (6 rats, 1,550 trials). m, Forced-choice decision-period signal did not distinguish upcoming action, as expected (n = 6 rats; paired t-test, t5 =1.026, P =0.18). f, h, j, l, Data are mean and s.e.m. Traces were z-score normalized before averaging. Scale bars indicate 0.5 s and 0.25 standard (z-score) units. n, Loss-sensitivity signal ((dF/F) at nosepoke (nsp) after loss/(dF/F) at other nosepokes) significantly predicts risk-preference (n = 6 rats; Pearson’s r2 =0.86, P =0.007). o, Safe choice signal ((dF/F) at nosepoke before safe choice/(dF/F) at nosepoke before risky choice) did not significantly predict risk-preference (n = 6 rats; Pearson’s r2 =0.12, P =0.48). p, Loss-sensitivity signal during forced-choice significantly predicted risk-preference (n = 6 rats; Pearson’s r2 =0.74, P =0.02). q, As expected, the safe choice signal during forced choices did not predict risk-preference (n = 6 rats; Pearson’s r2 =0.44, P =0.15). n, o, p, q, Points indicate the mean risk-preference, mean loss-sensitivity signal, and s.e.m. across days.
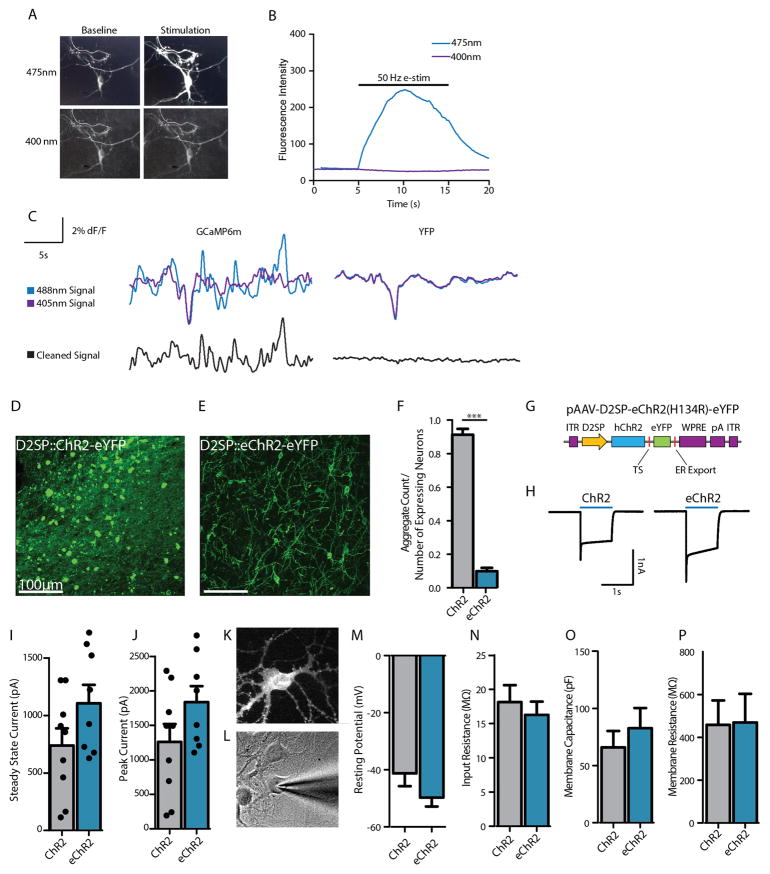
We used this construct to express the calcium indicator GCaMP6m26 in D2R+ NAc cells (Fig. 3b), and recorded population activity using fibre photometry27,28 (Fig. 3c, d; Methods). To control for potential behavioural artefacts, we determined the isosbestic point of GCaMP6m, which allowed us to use GCaMP6m as a ratiometric indicator (Extended Data Fig. 7 and Methods; as in ref. 28). This procedure yielded a 40-fold decrease in noise (Extended Data Fig. 7); robustness during movement was confirmed by stable recordings in a yellow fluorescent protein (YFP)-only animal (Fig. 3d and Extended Data Fig. 7).
Photometry traces revealed a signal in NAc D2R cells at initiation of each trial that depended on the outcome of the previous trial (Fig. 3e and Extended Data Fig. 8). This decision-period signal was larger if the rat had experienced a loss than if it had experienced a large gain or a safe outcome (Fig. 3e–g and Extended Data Fig. 8), and was also higher if the rat was about to make a safe choice as compared to a risky choice (Fig. 3h, i and Extended Data Fig. 8).
As previously noted, rats became less likely to choose the risky lever after loss outcomes (Fig. 1b, f). To dissociate the correlated effects of loss outcome and upcoming safe choice on the decision-period signal, we examined activity during forced choice trials. In these trials, the decision-period signal continued to reflect previous losses, even though rats could not act on this information (Fig. 3j, k), indicating that the signal representing loss could exist independently from signals predicting upcoming choice. As expected, there was no difference detected when forced-choice decision-period activity was sorted based on the upcoming lever press (Fig. 3l, m). Together, these findings identify neural activity generated by NAc D2R+ cells as both signalling recent loss (Fig. 3f, g, j, k) and predicting upcoming safe choice (Fig. 3h, i).
Although this signal was consistently higher after loss, we noted substantial variability in the signal across individuals. We explored whether this neural variability could account for naturally occurring differences in behaviour. Indeed, the ratio of decision-period activity after loss to activity after other outcomes (the loss-sensitivity signal) powerfully predicted risk preferences (Fig. 3n). Sorting this activity on the basis of upcoming choice rather than previous outcomes removed its predictive ability regarding individual risk preference (Fig. 3o), suggesting that individual differences are better accounted for by loss-sensitivity signals in these cells. Notably, the loss-sensitivity signal during forced-choice trials significantly predicted the number of risky choices a rat would make during subsequent free choice trials (Fig. 3p). As expected, forced choice signals sorted on upcoming decisions did not (Fig. 3q). Rats were allowed to move freely during the task, introducing the potential for differences in behaviour across trial types. However, differences in latency between sucrose port entry and the next decision period could not statistically account for the loss-sensitivity signal (Pearson’s r2 =0.21, P = 0.36) or animals’ risk preferences (Pearson’s r2 =0.02, P =0.81).
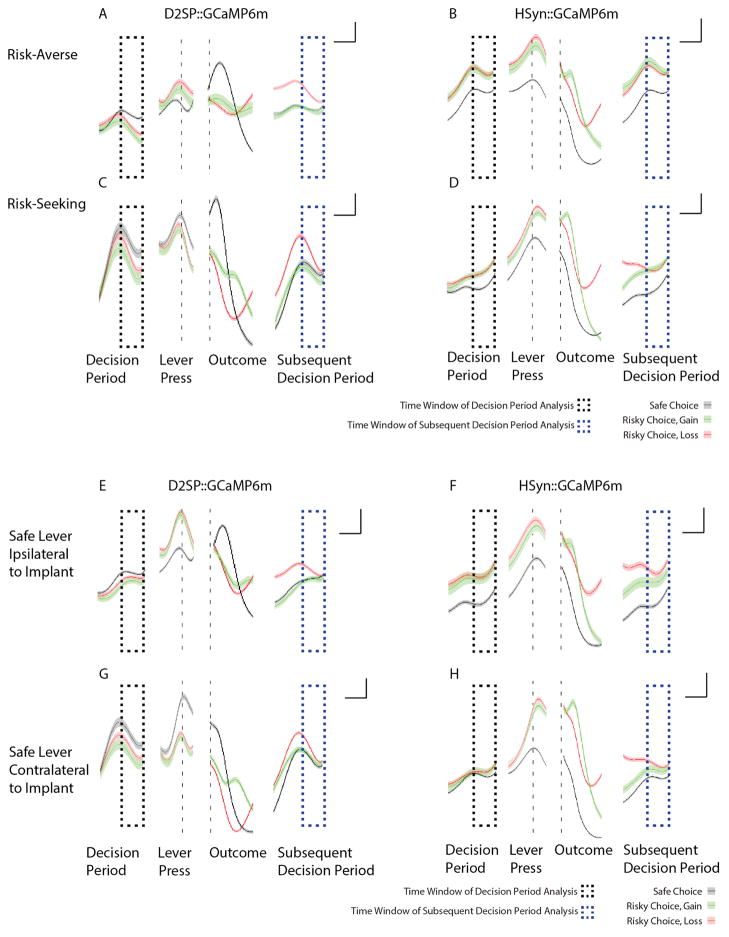
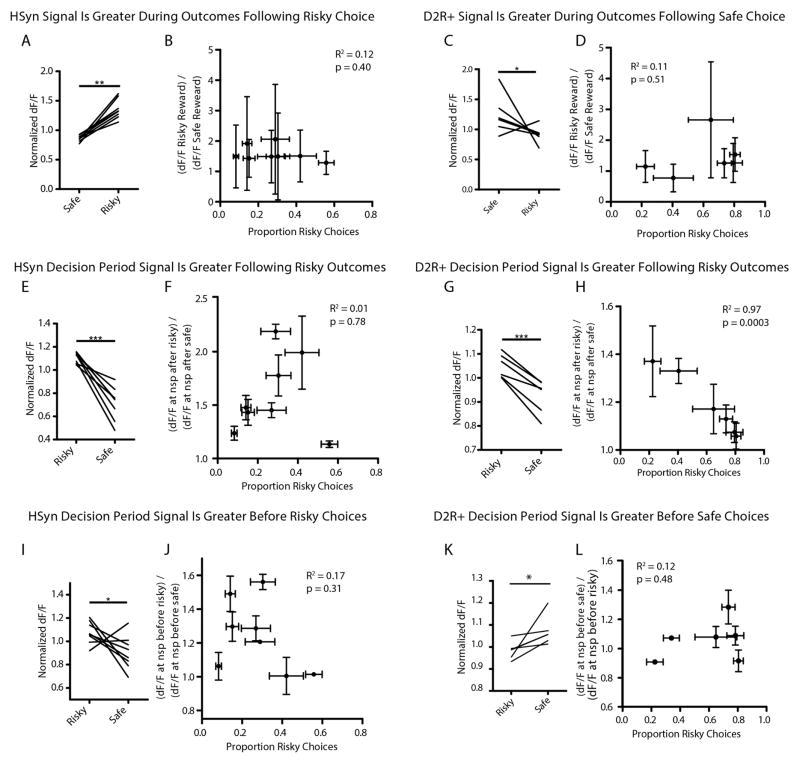
To verify the importance of selectively targeting D2R+ neurons, we recorded pan-neuronal photometry signals from NAc using the human synapsin promoter (Extended Data Fig. 8). While D2R+ recordings yielded a decision-period signal that was larger after losses (Fig. 3f, g and Extended Data Fig. 8), the pan-neuronal signal did not distinguish previous losses from previous gains (Extended Data Figs 8 and 9). Furthermore, unlike D2R+ recordings, neither outcome-period nor decision-period activity in pan-neuronal recordings predicted individual differences in risk-preference (Extended Data Fig. 9), underscoring the importance of sorting neural signals based on cell type.
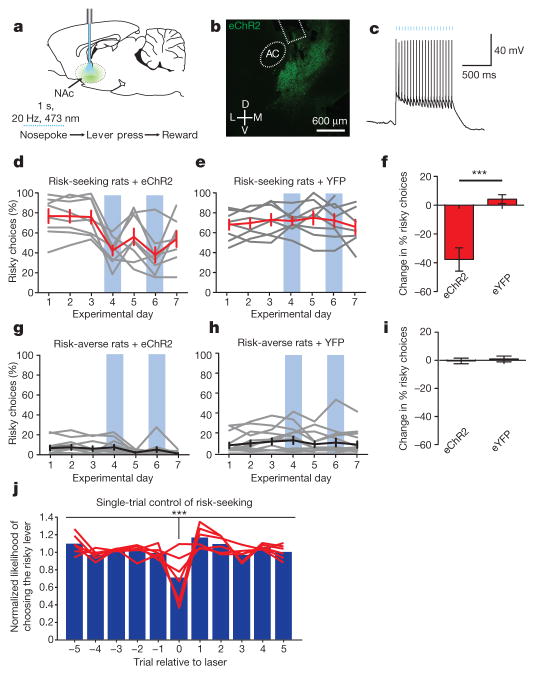
Because decision-period activity predicted risk-preferences and increased before safe choices, we sought to enhance the D2R+ neural signal by optogenetically activating these cells during the decision period. An unanticipated obstacle (D2SP-driven expression of channelrhodopsin-2 eYFP fusion protein (D2SP-ChR2(H134R)-eYFP) leading to protein aggregates in rat NAc neurons) was overcome by adding an endoplasmic reticulum (ER) export motif and trafficking signal29 (producing enhanced channelrhodopsin (eChR2); Methods), resulting in improved expression (Extended Data Fig. 7). In acute slice recordings, NAc cells expressing D2SP-eChR2(H134R)-eYFP tracked 20-Hz optical stimulation with action potentials (Fig. 4c).
Figure 4. Providing phasic activity in D2-expressing NAc cells during the decision period decreased risky choices in risk-seeking rats.
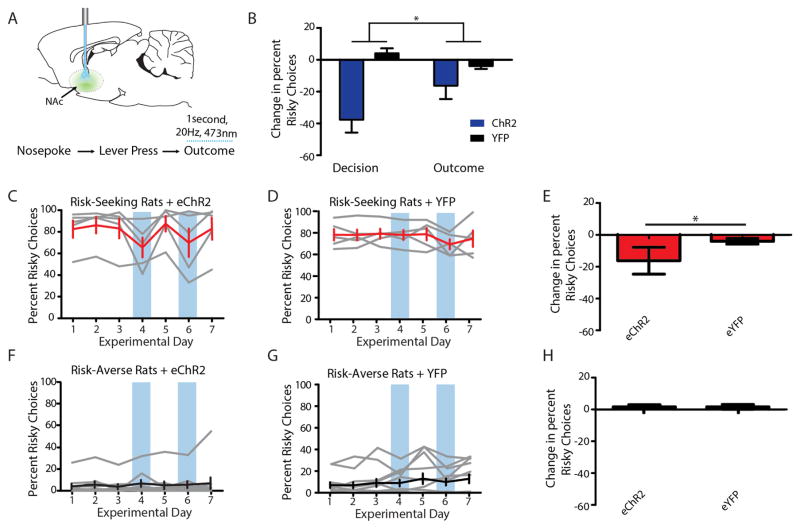
a, NAc cell bodies expressing AAV8-D2SP-eChR2(H134R)-eYFP were stimulated bilaterally during the decision period. b, AAV8-D2SP-eChR2(H134R)-eYFP expression in NAc. AC, anterior commissure. Rectangle indicates fibre location. c, NAc cells expressing D2SP-eChR2-eYFP track 1-s 20-Hz optical stimulation (indicated by blue bars) in acute slices (representative trace; similar behaviour seen in 5 out of 5 cells). d–i, NAc D2R+ cell decision-period stimulation decreased risky choices in risk-seeking rats, but not risk-averse rats relative to YFP-expressing controls (n =8 risk-seeking plus eChR2, 8 risk-seeking plus eYFP, 20 risk-averse plus eChR2, 26 risk-averse plus eYFP; two-way ANOVA, interaction F1,58 =25.37, P < 0.0001; Bonferroni post-hoc test revealed a significant difference between ChR2-expressing and YFP-expressing risk-seeking rats, but no difference between experimental and control risk-averse rats; ***P < 0.001). Grey traces represent individual animals. Black and red traces represent the population mean. Error bars represent s.e.m. Blue boxes indicate days with decision-period stimulation. j, Stimulation significantly decreased risk-seeking choices on a single-trial basis in risk-seeking rats (n = 6 rats; repeated-measures ANOVA, F5,10 =5.504, ***P = 0.0006; Dunnet’s post-hoc test revealed the probability of choosing risky on stimulation trials was significantly lower than each other trial independently, correcting for multiple comparisons; P < 0.01 in every case). Blue bars represent the mean likelihood of risky choice across rats; red lines represent the behaviour of individual rats.
D2R+ neuron stimulation during the decision period (Fig. 4a) decreased risky choices in risk-seeking (Fig. 4d–f) but not risk-averse (Fig. 4g–i) rats. Furthermore, stimulation during a pseudo-random subset of trials decreased risk-seeking choices with single-trial precision (Fig. 4j). The effect could be further narrowed to sub-phases of the task; the same pattern of stimulation delivered during the outcome period, rather than the decision period, resulted in a significantly reduced influence on choice (Extended Data Fig. 10). These findings indicate D2R+ NAc cells can control online selection of risky options and that decision-period activity in these cells causally drives risk-preference.
In summary, we developed behavioural, genetic, imaging and optical stimulation methods for measuring and modulating neural dynamics underlying trait and trial-by-trial variation in risk preference. We observed neural correlates of risky choice in D2R+ NAc cells, and optogenetically demonstrated the causal role of neural activity in this genetically and spatially defined population of neurons in risky choice. Together, these findings suggest individual differences in risk preference can be explained at the behavioural level by divergent responses to loss, and at the neural level by NAc D2R+ cell responses to previous unfavourable outcomes.
These findings indicate interesting directions for further study. For example, population recordings may combine distinct subpopulations of NAc D2R+ cells, which might separately encode upcoming decisions, reward receipt, and choice history. Furthermore, the observed differences in activity on receipt of safe versus risky outcomes are consistent with D2R+ cell activity influencing risk preference through learning and plasticity. This outcome-period activity did not predict choice, however, while decision-period activity did predict choice and modulate behaviour in real-time when enhanced optogenetically. It will be of great interest to test for distinct D2R+ subpopulations, trial-by-trial plasticity, and interactions between reward history and upcoming choice in D2R+ cells30 as they relate to risky choice. Insight into pharmacological disruption of risk preference in patients20,21, and into suboptimal or seemingly irrational choices by healthy individuals2, will benefit from deeper knowledge of how precisely defined cell populations, brain regions, and connections support risky choice.
METHODS
Subjects
Male Long–Evans rats were obtained from Charles River at 8–10 weeks old. Rats were pair housed in a colony maintained on a 12 h light/dark cycle, and were given food and water ad libitum outside of behavioural training. During training, rats were given food ad libitum but worked in a closed economy for water, obtaining 15 ml of 5% sucrose solution during the task. Experimental protocols were approved by Stanford University IACUC to meet guidelines of the National Institutes of Health guide for the Care and Use of Laboratory Animals. Sample sizes were chosen to meet or exceed those in previously published accounts of cognitive and decision-making tasks in rats31,32. Post-hoc tests then verified adequate statistical power given the observed effect sizes (see ‘Power analyses’).
Behavioural training
All behaviour was assessed in operant chambers (Med Associates). One wall of the operant chamber was arranged such that the sucrose port (Med Associates ENV-200R3BM) was positioned in the bottom centre slot. The nosepoke (Med Associates ENV-114BM) used to initiate each trial was slotted immediately above the sucrose port. The retractable choice levers (Med Associates, ENV-112CM) were on either side of the sucrose port (Extended Data Fig. 1).
In the first phase of training, both levers were extended into the chamber, and every press resulted in 50 μl sucrose reward. Rats were given two hours to earn and retrieve 150 total sucrose rewards. Most rats completed this phase in one day. In the second phase of training, a randomly-selected lever entered the chamber and retracted when pressed. Every press resulted in a 50-μl sucrose reward. Rats were given 2 h to earn and retrieve 200 sucrose rewards. In the third phase of training, rats were trained to initiate each trial with a one-second nosepoke. On the first trial, the rat was required to nosepoke for 250 ms, after which both levers would enter the chamber. The rat would then press a lever to obtain a 50-μl sucrose reward. In each subsequent trial, the length of the required nosepoke incremented by 5 ms. Rats were given 2 h to complete 200 lever presses. In the final phase of training, rats were exposed to the behavioural task described in Fig. 1a. Each trial was initiated with a 1-s nosepoke. If the rat failed to hold the nosepoke for 1 s, it could try again immediately without penalty, but the 1-s clock would start again from zero. One lever always delivered a 50-μl reward, while the other delivered a 10-μl reward with 75% probability and a 170-μl reward with 25% probability (expected value =50 μl). These objective expected values were held constant throughout the task. For the first 50 ‘forced choice’ trials, one randomly chosen lever entered the chamber, and the rat pressed it to obtain its reward. For the remaining 200 ‘free choice’ trials, both levers entered the chamber and the rat was allowed to choose. Rats were trained until their fraction of risky choices across three consecutive days varied by less than 10%. On average, rats required approximately 5 sessions in the final phase of training before reaching a stable behavioural baseline (mean =4.85, s.d. =2.29). In total, 12 out of 132 rats failed to learn the task. Rats were excluded from experiments if they failed to learn the initial lever pressing task, lost a fibreoptic implant before the conclusion of testing, or failed to develop stable baseline behaviour; these criteria were established in advance of experimentation. All cell counting data collection in Extended Data Figs 5–7 was conducted blinded to condition; the behavioural experimenter was not blind to the risk preference of each animal, but instead all behaviour was conducted while the experimenter monitored the rats from a different room, so as not to influence the animals’ choices.
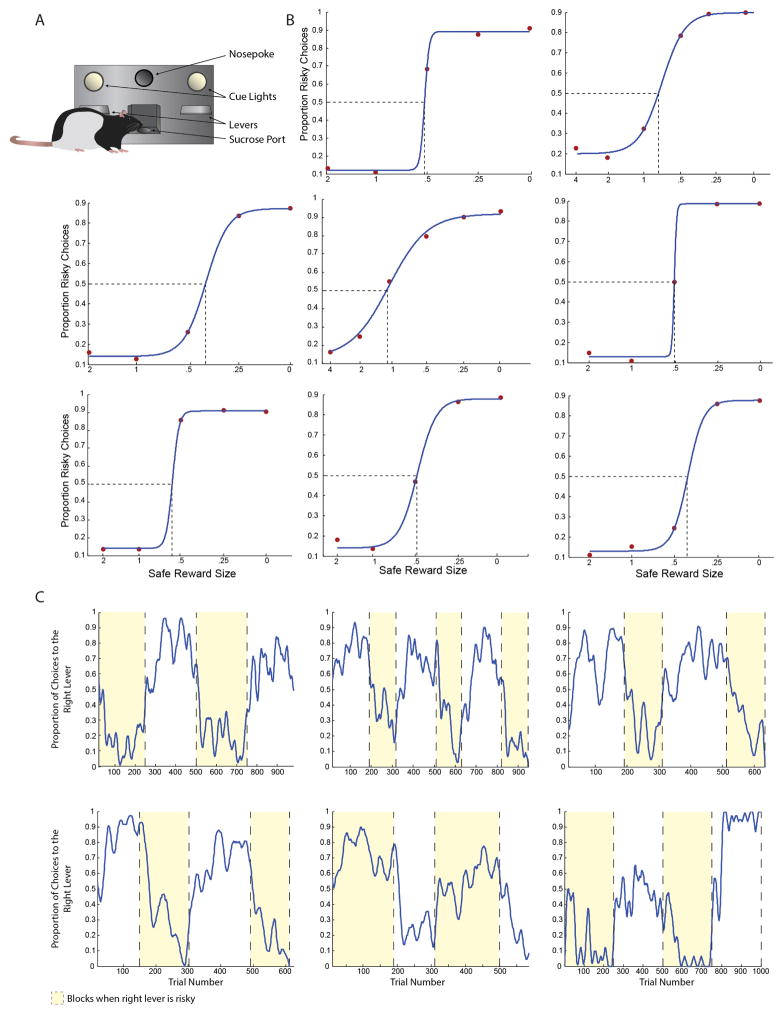
To validate rat sensitivity to relative expected value across the two levers, rats were trained to a stable baseline, as described above. The expected value of the safe lever was then systematically increased across days, to map out behavioural response curves (Extended Data Fig. 1b). To validate that rats’ choices were due to preference for the safe or risky reward schedule, rather than simply to side bias or indifference, rats were trained to a stable baseline. The location of the risky lever was then alternated between left and right levers at an uncued time in blocks of 100–250 trials (Extended Data Fig. 1c). Trial lengths for these blocks were on the order of the number of trials used in the main gambling task (200 free choice trials). The loss-sensitive index is determined as shown in equation (1).
| (1) |
Systemic pharmacology
PPX (Sigma-Aldrich, A1237) and A-77636 hydrochloride (Tocris Biosciences, 1701) were diluted in physiological saline and injected intraperitoneally 30 min before the start of the task at the doses described in Fig. 2. A large cohort of animals was trained to conduct this experiment, and separate animals within the cohort were used for each drug dose. Animals were trained to a stable baseline, as described above, before drug injections were initiated.
Stereotactic viral injection, cannula or fibre implantation, and light delivery
Surgeries were performed on 8–10-week-old rats. Rats were anaesthetized with 2–3% isofluorane; scalps were shaved, and subjects were placed in a stereotactic head apparatus. Rats received a subcutaneous injection of buprenorphine (0.01 mg kg−1) and a subcutaneous injection of lactated ringer’s solution (3 ml). Ophthalmic ointment was applied to prevent eyes from drying. A midline scalp incision was made, and a craniotomy was drilled above each injection or fibre implantation site. For intracranial drug infusion, guide cannulas (PlasticsOne, C313G) were implanted bilaterally. OFC cannulas were implanted at (A/P 4.5, M/L ±1.4, D/V −4.2; all coordinates in mm and relative to bregma (here and below)). NAc cannulas were implanted at (A/P 1.5, M/L ±1.8, D/V −6.5). In both NAc and OFC, left cannulas were implanted vertically while right cannulas were implanted at a 20° angle. Dental adhesive (C&B metabond, Parkell) was applied and dental cement (Stoelting) was added to secure the cannulas to the skull.
For photometry and optogenetics experiments, virus was injected with a 10-μl glass syringe and a 33-gauge beveled metal needle (World Precision Instruments). Importantly, virus should be injected at a titre no greater than 3 ×10¹² viral particles per ml to avoid potential cytotoxicity and diluted in ice-cold PBS if necessary. The injection volume and flow rate (750 nl at 150 nl min−1) were controlled by an injection pump (Harvard Apparatus). Each NAc received two injections (A/P 1.5, M/L ±1.8 mm, D/V −7.6 and −7.0). After injection, the needle was left in place for 5 additional minutes and then slowly withdrawn. All rats were injected and implanted bilaterally. In each NAc, an 8-mm fibre stub, terminated with a 2.5-mm diameter ferrule was implanted at (A/P 1.5 mm, M/L ±1.8 mm, D/V −7.2 mm). Left cannulas were implanted vertically while right cannulas were implanted at a 20° angle. For stimulation, a 30-μm core diameter, 0.37 numerical aperture (NA) fibre was used; for photometry, a 400-μm core diameter, 0.48-NA low-autofluorescence fibre with low-fluorescence epoxy for photometry (implantable fibres assembled by Doric Lenses, using fibre manufactured by ThorLabs or CeramOptec). Dental adhesive (C&B metabond; Parkell) was applied and light-curing composite (Flow-It ALC, Pentron Clinical, N11VH) was added to secure the ferrules to the skull. All behavioural experiments occurred at least 3 weeks after virus injection. Rats’ innate behaviour determined their assignment to ‘risk-seeking’ or ‘risk-averse’ groups. For optogenetic manipulations, half of the rats were randomly assigned to ChR2 or YFP (control) groups.
For photometry, each excitation source was set to an average power of 30 μW at the fibre tip. Light was delivered through a 400-μm core diameter, 0.48-NA low-fluorescence patch cord (Doric Lenses) and joined to the implanted fibre ferrules using zirconia sleeves (Thorlabs). Recording location (left or right NAc) was balanced across subjects. For optogenetic stimulation, light pulses were administered for 1 s at 20 Hz at a power of 15 mW per side (0.75 mW per side corrected for duty cycle). Decision period stimulation began when the rat initiated a nosepoke. Outcome period stimulation occurred in the 1 s after sucrose port entry. Light was delivered through a 300-μm core diameter, 0.37-NA fibre (Thorlabs), fed through a fibre optic rotary joint (Doric Lenses, FRJ_1x1_FC-FC), and split into two beams using a Doric minicube (Doric Lenses, DMC_1x2i_VIS_FC). At each output of the minicube a 0.5-m, 300-μm core diameter, 0.37-NA fibre, terminating in a 2.5-mm ferrule (Thorlabs) was attached. Each fibre was sheathed in a steel spring to protect from chewing (PlasticsOne) and joined to an implanted fibre ferrule using a zirconia sleeve (Thorlabs).
Intracranial drug infusions
Rats were anaesthetized with 1–2% isoflurane and were placed in a stereotactic head apparatus. PPX was dissolved in saline (10 μg μl−1, 0.9% NaCl). Thirty minutes before the behaviour, 0.5 μl of the PPX solution was infused in each side of OFC or each side of NAc via an internal infusion needle (PlasticsOne, C313I) inserted into the guide cannula. The internal needle was connected to a 10-μl Hamilton syringe (Nanofil; WPI). Flow rate (0.1 μl min−1) was regulated by a syringe pump (Harvard Apparatus). Cannula locations were verified in Nissl-stained sections. Infusions were conducted in an ABABA design, alternating infusions of saline or PPX across days.
Immunohistochemistry
Rats were anaesthetized with Beuthanasia and perfused transcardially, first with ice-cold PBS (pH 7.4) and then with 4% paraformaldehyde (PFA) dissolved in PBS. The brains were removed and post-fixed in 4% PFA overnight at 4 °C, and then equilibrated in 30% sucrose in PBS. Forty-micrometre-thick coronal sections were prepared on a freezing microtome (Leica) and stored in cryoprotectant (25% glycerol and 30% ethylene glycol in PBS, pH 6.7) at 4 °C. Cell counts were conducted by blinded experimenters. For anti-D2R staining, (Millipore, AB1558) was used as described below. For anti-ChAT staining (Millipore, AB144P) was used as previously described33. For anti-GFP staining (Life Technologies, A-31852) was used as previously described28.
For D2R staining, the following protocol was used: (1) rinse 40-μm sections in PBS (pH 7.4), 3 × 10 min. (2) Block in PBS plus 3% normal donkey serum and 0.3% Triton-X (PBS++) for 30 min. (3) Incubate in primary antibody (rabbit anti-D2R, Millipore ab1558) at 1:200 in PBS++ for 24 h at room temperature on a rotary shaker. (4) Wash slices for 4 × 15 min in PBS. (5) Incubate in secondary antibody (Alexa-fluor 647, goat anti-rabbit, Life Technologies, A-21245) at 1:200 in PBS++ overnight at room temperature on a rotary shaker. (6) Wash slices for 4 ×15 min in PBS. (7) Incubate in tertiary antibody (Alexa-fluor 647, donkey anti-goat, Life Technologies, A-21447) at 1:500 in PBS++ for 8 h at room temperature on a rotary shaker. (8) Wash for 15 min in PBS. (9) Wash for 15 min in 1:50,000 DAPI in PBS. (10) Wash for 15 min in PBS and mount with PVA-DABCO.
Molecular cloning
We developed a novel dopamine D2R-specific promoter (D2SP) for expression of transgenes in rat D2R+ cells compatible with use in a single AAV vector (Extended Data Fig. 5). The new 1.5-kb D2SP fragment was taken from a region immediately upstream of the rat D2R (also known as Drd2) gene (full sequence: Extended Data Fig. 5), differing from a previously reported D2R promoter region34 by excluding exon 1 and including a Kozak sequence inserted between the promoter region and the gene that it controls. D2SP was amplified from rat genomic DNA using primers 5′-CGCACGCGTTTATCCTCGGTGCATCTCAGAG-3′ and 5′-GGCGGATCCCCCCGGCACTGAGGCTGGACAGCT-3′ digested with MluI and BamHI and ligated with pAAV-hSYN-eYFP or pAAV-hSYN-hChR2(H134R)-eYFP digested with the same two enzymes to yield pAAV-D2SP-eYFP or pAAV-D2SP-hChR2(H134R)-eYFP, respectively. pAAV-D2RE-eYFP was constructed using the D2R promoter sequence described previously34 to replace the hSYN promoter in pAAV-hSYN-eYFP. pAAV-D2SP-eChR2(H134R)-eYFP was constructed with the ER export motif and trafficking signal as described previously29. pGP-CMV-GCaMP6m (Addgene plasmid 40754) and pGP-CMV-GCaMP6f Kim (Addgene plasmid 40755) were a gift from D. Kim. The GCaMP DNA was amplified by PCR using 5′-CCGGATCCGCCACCATGGGTTCTCATCATCATCATC-3′ and 5′-CGATAAGCTTGTCACTTCGCTGTCATCATTTGTAC-3′, digested with BamH1 and HindIII and cloned under the CaMKIIa or D2SP promoters to yield pAAV-CaMKIIa-GCaMP6m, pAAV-CaMKIIa-GCaMP6f, pAAV-D2SP-GCaMP6m and pAAV-GCaMP6f. All constructs were fully sequenced to check for accuracy of the cloning procedure, and all AAV vectors were tested for in vitro expression before viral production as AAV8/Y733F serotype packaged by the Stanford Neuroscience Gene Vector and Virus Core. Updated maps are available at http://optogenetics.org/.
Neuron culture and calcium phosphate transfections
Primary cultured striatal neurons were prepared from P0 Sprague-Dawley rat pups (Charles River). The striatum was isolated, digested with 0.4 mg ml−1 papain (Worthington), and plated onto glass coverslips precoated with 1:30 Matrigel (Beckton Dickinson Labware). Cultures were maintained in a 5% CO2 humid incubator with Neurobasal-A medium (Invitrogen Carlsbad) containing 1.25% FBS (Hyclone), 4% B-27 supplement (Gibco), 2 mM glutamax (Gibco), and FUDR (10 mg 5-fluoro-2′-deoxyuridine and 25 μg uridine) from Sigma, for 6–10 days in a 24-well plate at a density of 65,000 cells per well. For each coverslip, a DNA and CaCl2 mix was prepared with 1.5–3.0 μg DNA (Qiagen endotoxin-free preparation) and 1.875 μl 2 M CaCl2 (final Ca2+ concentration 250 mM) in 15 μl total H2O. To the DNA and CaCl2 mix, 15 μl of 2× HEPES-buffered saline (pH 7.05) was added, and the final volume was mixed well by pipetting. After 20 min at room temperature, the 30 μl DNA–CaCl22–HBS mix was added drop-wise into each well (from which the growth medium had been temporarily removed and replaced with 400 μl pre-warmed MEM) and transfection was allowed to proceed at 37 °C for 45–60 min. At the end of the incubation, each well was washed with 3× 1-ml warm MEM before the original growth medium was returned. Opsin expression was generally observed within 24 h.
Ca2+ imaging in culture
Coverslips of cultured neurons were transferred from the culture medium to a recording bath filled with Tyrode solution (containing in mM: 125 NaCl, 2 KCl, 2 CaCl2, 2 MgCl2, 30 glucose and 25 HEPES). The coverslip was scanned for GCaMP-expressing neurons and a glass monopolar stimulating electrode filled with Tyrode was placed nearby. A 10-s 50-Hz stimulation (pulse width 5-ms, intensity 5–6 mA) was used to obtain maximal responses. Wavelengths of either 475 nm or 400 nm, generated using a Spectra X LED light engine (Lumencor), were used to illuminate the cell. Video was recorded at 10 Hz using a CCD camera (RoleraXR, Q-Imaging).
Cultured neuron physiology
Coverslips of cultured neurons were transferred from the culture medium to a recording bath filled with Tyrode solution (containing in mM: 125 NaCl, 2 KCl, 2 CaCl2, 2 MgCl2, 30 glucose, 25 HEPES, 0.001 TTX, 0.005 NBQX, 0.05 APV and 0.05 picrotoxin). Whole-cell patch-clamp recordings were performed with glass electrodes (resistance 2.5–4.0 MΩ when filled with internal, which includes (in mM): 120 K-gluconate, 11 KCl, 1 CaCl2, 1 MgCl2, 10 EGTA, 10 HEPES, 2 Mg-ATP and 0.3 Na-GTP, adjusted to pH 7.3 with KOH). Signals were amplified with a Multiclamp 700B amplifier, acquired using a Digidata 1440A digitizer, sampled at 10 kHz, and filtered at 2 kHz. All data acquisition and analysis were performed using pCLAMP software (Molecular Devices). ChR2-expressing neurons were visually identified for patching using an upright microscope (Olympus BX51WI) equipped with DIC optics, a filter set for visualizing YFP, and a CCD camera (RoleraXR, Q-Imaging). To stimulate ChR2, 1 s of continuous blue light (~10 mW mm−2) was generated using a Spectra X LED light engine (Lumencor) and delivered to the slice via a ×40/0.8 water immersion objective focused onto the recorded neuron.
Acute brain slice physiology
Acute 300-μm coronal slices were prepared by transcardially perfusing the rat with room-temperature NMDG slicing solution (containing in mM: 92 N-methyl-D-glucamine, 2.5 KCl, 30 NaHCO3, 1.2 NaH2PO4-H2O, 20 HEPES, 25 glucose, 5 sodium ascorbate, 2 thiourea and 3 sodium pyruvate, adjusted to pH 7.4 with HCl) and slicing the brain tissue in the same solution using a vibratome (VT1200S, Leica). Slices were allowed to recover for 10 min at 33 °C in the NMDG solution, then another 20 min at 33 °C in a modified HEPES artificial cerebrospinal fluid (containing in mM: 92 NaCl, 2.5 KCl, 30 NaHCO3, 1.2 NaH2PO4-H2O, 20 HEPES, 25 glucose, 5 sodium ascorbate, 2 thiourea and 3 sodium pyruvate), then another 15 min at room temperature in the HEPES solution. Finally, slices were transferred to standard artificial cerebrospinal fluid (aCSF; containing in mM: 125 NaCl, 2.5 KCl, 2 CaCl2, 1 MgCl2, 26 NaHCO3, 1.25 NaH2PO4-H2O and 11 glucose) bubbled with 95%O2/5%CO2 and stored at room temperature until recording. Whole-cell patch-clamp recordings were performed in aCSF at 30–32 °C. Synaptic blockers (5 μm NBQX, 50 μm D-AP5 (D(−)-2-amino-5-phosphonovaleric acid) and 50 μm picrotoxin; Tocris) were added to the aCSF to isolate direct ChR2 responses. Resistance of the patch pipettes was 2.5–4.0 MΩ when filled with intracellular solution containing the following (in mM): 120 K-gluconate, 11 KCl, 1 CaCl2, 1 MgCl2, 10 EGTA, 10 HEPES, 2 Mg-ATP and 0.3 Na-GTP, adjusted to pH 7.3 with KOH). Signals were amplified with a Multiclamp 700B amplifier, acquired using a Digidata 1440A digitizer, sampled at 10 kHz, and filtered at 2 kHz. All data acquisition and analysis were performed using pCLAMP software (Molecular Devices). ChR2-expressing neurons were visually identified for patching using an upright microscope (Olympus BX51WI) equipped with DIC optics, a filter set for visualizing YFP, and a CCD camera (RoleraXR, Q-Imaging). To stimulate ChR2, 1 s of 5-ms blue light pulses (~10 mW mm−2) were generated at 20 Hz using a Spectra X LED light engine (Lumencor) and delivered to the slice via a ×40/0.8 water immersion objective focused onto the recorded neuron. Ex-vivo and cell culture physiology data were analysed using Clampfit software (Axon Instruments Inc., Molecular Devices). Statistical analyses were performed using MATLAB (Mathworks Inc.) and GraphPad Prism (GraphPad Software).
Code availability
All custom-written MATLAB code is available on request.
Multicolour fibre photometry
As described previously27,28, we measured bulk fluorescence from deep brain regions using a single optical fibre for both delivery of excitation light to, and collection of emitted fluorescence from, the targeted brain region. The fluorescence output of the calcium sensor is modulated by varying the intensity of the excitation light, generating an amplitude-modulated fluorescence signal that can be demodulated to recover the original calcium sensor response. This ‘upconversion’ of the calcium signal to a frequency range of our choice allows us to avoid any contribution to the signal from changes in ambient light levels with behaviour (since these will not be modulated at the appropriate frequency), as well as avoiding drift or low-frequency ‘flicker noise’ in our photodetector.
We have extended this method to the case of multiple excitation wavelengths delivered over the same fibre, each modulated at a distinct carrier frequency, to allow for ratiometric measurements.
Fluorescence excitation was provided by two diode lasers at 488 nm and 405 nm with analogue modulation capabilities (Luxx, Omicron Laserage). A real-time signal processor (RP2.1, Tucker-Davis Technologies) running custom software sinusoidally modulated each laser’s output (average power at the fibre tip was set to 30 μW for each wavelength), and simultaneously demodulated the two output signals from the output of the single photodetector (Model 2151 Femtowatt Photoreceiver) as described below.
Carrier frequencies (211 and 531 Hz for 488 and 405 nm excitation, respectively) were chosen to avoid contamination from overhead lights (120 Hz and harmonics) and cross-talk between channels (the bandwidth of GCaMP6M was observed to be <15 Hz), while remaining within the 30–750-Hz bandwidth of the photodetector. Excitation light from the two lasers was combined by a dichroic mirror (425-nm longpass, DMLP425), passed through a clean-up filter (Thorlabs, FES0500) and a dichroic mirror (505-nm long-pass, DMLP505), before being coupled into a large-core, high-NA, low-fluorescence optical fibre patch cord (400 μm diameter, 0.48 NA, Doric Lenses) using a fixed-focused coupler/collimator with a standard FC connector (F240FC-A, NA 0.51, f = 7.9 mm). The far end of the patch cord is butt-coupled to the chronically implanted fibre using standard 2.5 mm ferrules and a zirconia sleeve, allowing for easy connections and repeated measurements across days, as in standard optogenetics preparations.
A small amount of the fluorescence emitted in the brain is captured at the tip of the implanted fibre and travels back to the rig, where it is collimated and passes through the last dichroic mirror and is focused onto the photodetector by a lens (NA 0.5, f = 12.7 mm, part 62–561, Edmund Optics). The photodetector signal was sampled at 6.1 kHz, and each of the two modulated signals was independently recovered using standard synchronous demodulation techniques: the detector output was routed to two product detectors, one using the selected channel’s modulation signal as a reference, and the other using a 90° phase-shifted copy of the same reference. These outputs were low-pass filtered (corner frequency of 15 Hz), and added in quadrature. This dual-phase detection approach makes the output insensitive to any phase delay between the reference and signal. The resulting fluorescence magnitude signals were then decimated to 382 Hz for recording to disk, and then further filtered using an ~2-Hz low-pass filter.
The ratiometric fluorescence signal used throughout the paper was calculated for each behavioural session as follows. A linear least-squares fit between the two timeseries was calculated (that is, the 405-nm control signal values were the independent variable and the 488-nm signal was the dependent variable). Change in fluorescence (dF) was calculated as (488 nm signal–fitted 405 nm signal), adjusted so that a dF of 0 corresponded to the second percentile value of the signal. dF/F was calculated by dividing each point in dF by the 405-nm fit at that time, which scaled transients according to the degree of bleaching estimated at that time.
Behavioural variables, such as lever presses and reward port entry times, were fed into the real-time processor as TTL signals from the operant chambers.
Statistical analysis
For each figure, a statistical test matching the structure of the experiment and the structure of the data was employed. For simple comparisons between just two groups, t-tests were used. Where the structure of the data did not fit the assumptions of the test, the non-parametric Mann–Whitney (for unpaired tests) or Wilcoxon matched-pairs (for paired tests) was used instead. When comparing the magnitude of effects of a manipulation across two groups, a two-way ANOVA was used, and where significant interactions were detected, a Bonferroni post-hoc test was used to determine the nature of the differences. When quantifying repeated manipulations within a group, a repeated-measures ANOVA was used, and where significant interactions were detected, a Dunnet’s post-hoc test was used to determine whether the manipulation altered behaviour, while correcting for multiple comparisons. For linear correlation, the Pearson’s r test was used throughout. Variances within each group of data are displayed as s.e.m. throughout.
Reliability of risk preferences
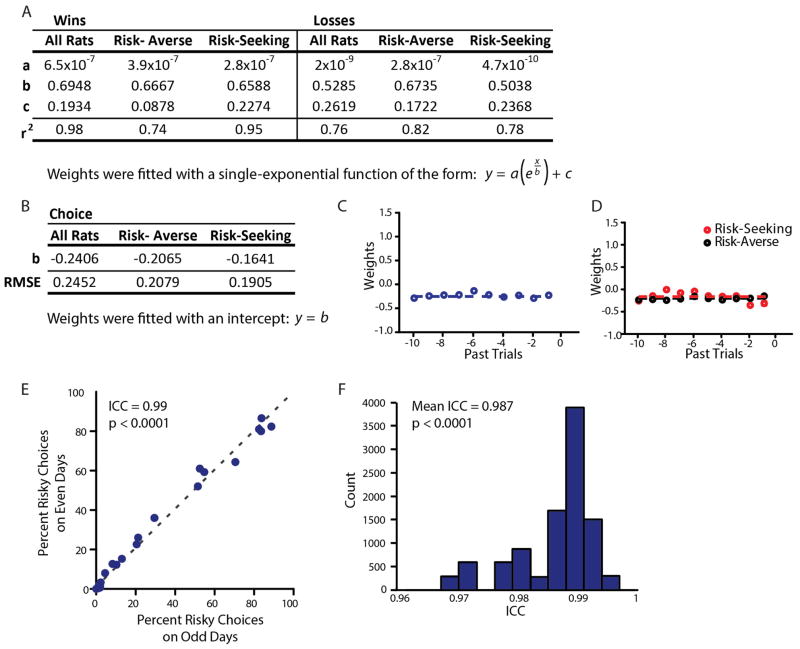
To quantify the temporal stability of individual subjects’ risk preferences across days, we calculated the reliability of percentage risky choices in unmanipulated control animals’ behaviour across 7 days of testing. Odd-versus-even day split-half reliability estimates (as in ref. 35) indicated significant internal consistency in risk preferences for risk-seeking animals (ICC =0.95, P = 0.0003), risk-averse animals (ICC =0.99, P < 0.0001), and overall (ICC =0.99, P < 0.0001). Bootstrap analysis of 10,000 randomly-assigned split halves of the data generates an average ICC =0.987 (P <0.0001; Extended Data Fig. 2). Across rats, the average standard deviation in percentage risky choices across the 7 days of testing was 6.1%.
Photometry within-animal analysis
For each rat, we calculated the median neural activity during each nosepoke, in the 1 s after nosepoke entry, during successfully completed nosepokes, across all free choices, across all days of behaviour. We then sorted nosepoke periods based either on previous trial outcome (Fig. 3g, k) or on the upcoming choice (Fig. 3i, m). In the case of previous trial outcome, a t-test was used to compare a list of all nosepoke-period signals when the animal received a loss outcome (hundreds of individual trials) against a list of all the signals when the animal received a gain or safe outcome (also hundreds of individual trials). In the case of next decision, a t-test compared the list of all activity during nosepokes when the animal was about to choose safe to the list of all nosepoke activity when the rat was about to choose to take a risk. The signal was larger after loss outcomes than after gain or safe outcomes (Fig. 3e–g). This trend is individually significant in 5 out of 6 rats (t-test, P < 0.0001 in all cases). Decision-period activity was higher in D2R+ cells before safe choices versus risky choices (Fig. 3h, i). This trend held in all rats tested and was individually significant in 5 out of 6 rats (t-test, P <0.02 in all cases).
Power analyses
The logistic regression analysis displayed in Fig. 1b–e is supported by 17 animals and >9,800 individual data points. Post-hoc analyses revealed power of 0.9 and 0.84, respectively, for the subpanels in Fig. 1f and a power of 0.99 for Fig. 1g. The one-way ANOVA in Fig. 2a has a power of 0.96. The Mann–Whitney test in Fig. 2c has a power of 0.96. The repeated-measures ANOVA used in Fig. 2f has a power of 0.99. The data in Fig. 3 comprise 31 recording sessions across the 6 rats, totalling >7,500 trials. Post-hoc power tests on Fig. 3g, i, k, m reveal a power >0.84 for all significant results. Tests on the significant correlations reveal a power of 0.95 for Fig. 3n and a power of 0.86 for Fig. 3p. The optogenetics experiments in Fig. 4 contain a total of 62 animals across the 4 groups. Power analyses reveal that the two-way ANOVA used to evaluate Fig. 4d–i has a power of 0.99. The one-way ANOVA in Fig. 4j has a power of 0.89.
Logistic regression
The goal of this classification is to determine the probability that a rat will choose the risky lever on any given trial given recent outcome history. We used a soft-max decision function:
| (2) |
such that:
| (3) |
where x is a vector representing the recent outcome history, y ∈ {0, 1} is a dummy variable indicating whether the rat chose risky on a given trial, and θ is the set of weights learned by the model. In this scenario, we know the outcome history (x) and the choice outcomes (y). We seek to use these data to find a set of weights (θ) that minimizes the difference between the prediction (hθ(x)) and the rat’s actual behaviour (y). To accomplish this, we use the MATLAB gradient descent algorithm fminunc to generate a set of weights (θ) that minimize the cost function:
| (4) |
over m training examples. We use the vectorized implementation:
| (5) |
We then used the weights generated by running this optimization over the training data to determine how well the model generalized to test data from the same rats. To do this, we plugged the weights from the optimization over training data and the outcome histories from the test data into equation (2). The probabilities generated by equation (2) were then compared to actual choice outcomes on a trial-by-trial basis, such that [hθ(x) ≥0.5 when y = 1] or [hθ(x) < 0.5 when y = 0] were considered correct predictions.
Extended Data
Extended Data Figure 1. Task validation and behavioural controls.
a, Scale diagram of the behavioural apparatus, showing the relative size and location of the nosepoke, levers, and sucrose port. b, Rats varied the proportion of choices they made to the risky lever as a function of the relative value of the safe and risky options. Subplots were constructed for each rat. The size of the safe reward is displayed as a proportion of the expected value of the risky reward. Red points indicate the proportion of risky choices each rat made to the risky lever given a particular value of the safe reward; blue lines indicate sigmoidal fits to those values. Dashed lines indicate each rat’s indifference point. Data in the centre panel are from a risk-seeking rat (indifference point >1); all other rats were risk-averse. Side bias, in these data, would appear as an upward or downward shift of the sigmoid, such that behaviour would asymptote without spanning the range of risky choices, and 50% would not centre the sigmoid on the ordinate. An additional cohort of rats was trained specifically for this control experiment. These rats do not appear elsewhere in the manuscript. c, Rats reversed their behaviour to track their preferred reward contingency (safe or risky). Each panel displays the behaviour of one rat across several hundred trials. The location of the risky lever is alternated in blocks of trials. Blocks where the right lever is risky are highlighted in yellow. Rats’ choices are smoothed with a 15-trial moving window. The rat in the bottom centre panel displayed risk-seeking behaviour; all others were risk-averse. An additional cohort of rats was trained specifically for this control experiment. These rats do not appear elsewhere in the manuscript.
Extended Data Figure 2. Parameters for logistic regression classifier.
a, Parameter values and goodness-of-fit for single-exponential fits of the form to weights obtained in the logistic regression classifier (Methods) shown in Fig. 1. b, Parameter values and root mean squared error (RMSE) for fits of the form y = b to weights associated with choosing the safe option in the logistic regression classifier (Methods) shown in Fig. 1. c, Model coefficients associated with choosing the safe lever, as obtained from the entire population of rats. d, Model coefficients associated with choosing the safe lever, obtained for risk-seeking and risk-averse rats separately. e, Split-half reliability. Each dot represents a comparison between a rat’s average risk preference on odd days of behaviour and the rat’s average risk preference on even days of behaviour across seven days of testing. Perfect reliability would be represented by each animal’s data falling along the (grey, dashed) unity line. f, A 10,000-fold bootstrap over randomly assigned split halves of each rat’s behaviour generates an average reliability (intraclass correlation (ICC)) of 0.987. Reliability estimates were generated from control animal behavioural data represented in Fig. 4, as this cohort represents the longest test of unmanipulated behaviour in the manuscript.
Extended Data Figure 3. Predictive validity of the logistic regression classifier.
a–c, The model was trained on two-thirds of data and tested on the one-third of data that was held-out. The blue histogram indicates the chance distribution, determined by the model’s performance over a 1,000-fold shuffle of the held-out test data. The dashed line indicates cross-validation accuracy (CV) on held-out data. This calculation was performed for data from all rats (a; P < 0.001 by Monte Carlo simulation; CV is 24.3 s.d. outside the chance distribution), a balanced subset of data from risk-averse rats, such that approximately 50% of choices were safe and 50% were risky (b; P < 0.001 by Monte Carlo simulation; CV is 20.6 s.d. outside the chance distribution), and a balanced subset of data from risk-seeking rats (c; P < 0.001 by Monte Carlo simulation; CV is 8.5 s.d. outside the chance distribution). d–f, Receiver operating characteristic (ROC) curves derived from model performance on held-out test data across all rats (d; area under the curve (AUC) = 0.85), a balanced subset of data from risk-averse rats (e; AUC = 0.76), and a balanced subset of data from risk-seeking rats (f; AUC =0.78). g, h, Histogram of run lengths for risk-averse rats (g) and risk-seeking rats (h). Blue bars indicate runs on the risky lever. Grey bars indicate runs on the safe lever. Insets show exceptionally long runs.
Extended Data Figure 4. The D1 agonist A-77636 increased intertrial interval without influencing risk preference.
Each rat in this experiment received alternating treatments of intraperitoneal A-77636 and intraperitoneal saline (see Fig. 2d). Each plot represents a different dose of A-77636. On each x axis is the intertrial interval on days receiving saline, and on the y axis is the intertrial interval on days receiving drug. Points above the unity line indicate an increase in intertrial interval with drug administration. a, Vehicle alone does not alter intertrial interval (paired t-test, t17 =1.088, P =0.29). b, A 50 μg kg−1 dose of A-77636 does not significantly alter intertrial interval (paired t-test, t14 =1.598, P =0.13). c, A 350 μg kg−1 dose of A-77636 significantly increases intertrial interval (paired t-test, t16 =4.391, P =0.0005). d, A 700 μg kg−1 dose of A-77636 significantly increases intertrial interval (paired t-test, t16 =2.738, P =0.015). e, A 1,000 μg kg−1 dose of A-77636 significantly increases intertrial interval (paired t-test, t13 =2.948, P =0.011).
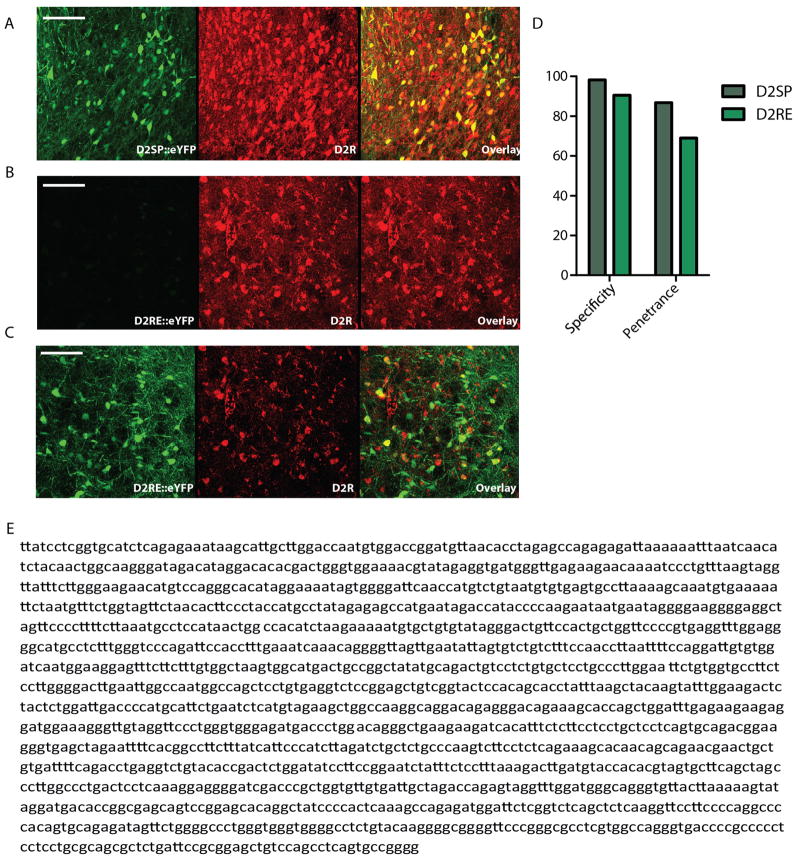
Extended Data Figure 5. The novel D2SP improves expression and specificity over previously published promoters.
a, Expression of eYFP under the novel D2SP. Red shows D2R immunostaining (Methods). Scale bar, 100 μm. b, Expression of eYFP under a D2R promoter based on previously published constructs (D2RE), which included the first exon of the D2 receptor gene30,31. Image taken with settings matched to those used for the D2SP image in a. Scale bar, 100 μm. c, Images are of the same field of view as in b but taken with settings optimized to see the (otherwise dim) eYFP expression. Scale bar, 100 μm. d, Specificity of expression under the D2SP improved from 90.5% to 98.2% under the previously described promoter. Penetrance of expression under the DR2 promoter improved from 69% to 86.8% under the previously described promoter. e, Full sequence of D2SP.
Extended Data Figure 6. Specificity of D2SP.
a, Sagittal sections taken from brains injected with AAV8-hSYN-ChR2-eYFP (top) and AAV8-D2SP-eYFP (bottom). Arrowheads indicate projections expressing eYFP in the hSYN-injected brain that are not expressing eYFP in the D2SP-injected brain. b, Representative injection location, showing minimal overlap of D2SP-eChR2-eYFP with choline acetyltransferase (ChAT)+ cells. Green indicates D2SP-eChR2-eYFP, red indicates ChAT. c, Example of the three ChAT+ cells observed expressing eChR2-eYFP across 6 animals (top) and a ChAT+ cell that does not express eChR2-eYFP (bottom). d, Across NAc sections from the most densely expressing slices from 6 animals, 782 cells expressing eChR2-eYFP, 420 cells expressing ChAT, and 3 cells expressing both ChAT and ChR2-eYFP were observed. e, Within the area of viral infection, 782 cells expressing eChR2-eYFP, 93 cells expressing ChAT, and 3 cells expressing both ChAT and ChR2-eYFP were observed.
Extended Data Figure 7. Characterization of dual-wavelength photometry and eChR2.
a, Images of a GCaMP6m-expressing neuron illuminated at the imaging wavelength (475 nm) and the isosbestic wavelength (400 nm), at baseline (left) and with 10 s of 50 Hz electrical stimulation (right). b, Fluorescence intensity from a representative neuron, illuminated at 475 nm and 400 nm, during 10 s of 50 Hz electrical stimulation. c, Traces from a GCaMP6m-expressing rat (left) and a YFP-expressing rat (right) during the gambling task. Cyan traces are of the imaging wavelength; violet traces are of the isosbestic wavelength; black traces represent the cleaned signal (Methods). d, Expression of D2SP-ChR2-eYFP in rat NAc, showing evidence of opsin accumulations (bright green spots). e, Expression of D2SP-eChR2-eYFP in rat NAc; note greatly reduced accumulation density. f, D2SP-ChR2-eYFP-expressing cells have significantly more aggregates than D2SP-eChR2-eYFP-expressing cells. Quantification is in number of aggregates per expressing cell across ex vivo histological sections (t-test, t7 =21.25, ***P <0.0001; n =168 ChR2-expressing cells in 4 sections, n = 131 eChR2-expressing cells in 5 sections). g, Backbone diagram of pAAV-D2SP-eChR2(H134R)-eYFP showing the membrane trafficking modifications (trafficking signal (TS) and endoplasmic reticulum (ER) export motifs). h, Representative photocurrents evoked by ChR2 and eChR2 in cultured neurons by 1 s 473-nm light. i, Steady-state photocurrents measured from ChR2- and eChR2-expressing cultured neurons. In addition to showing reduced accumulations, photocurrents trended higher with eChR2. j, Peak photocurrents measured from ChR2- and eChR2-expressing cultured neurons; eChR2 trended towards higher peaks as well. k, Expression of eChR2-eYFP in a cultured rat striatal neuron. l, Whole-cell patch-clamp recording from the neuron shown in k. m–p, Resting membrane potential, input resistance, membrane capacitance, and membrane resistance measured from ChR2- and eChR2-expressing cultured neurons; no significant differences were observed. All error bars represent s.e.m.
Extended Data Figure 8. D2R+ (but not pan-neuronal) cellular signals are increased during the decision-period leading to risk rejection (safe choice) and encode prior loss.
a–h, In all plots, black dashed boxes indicate decision-period activity, and blue dashed boxes indicate subsequent decision-period activity. Traces indicate mean neural activity sorted on trial outcome: safe (black), gain (green) or loss (red). Shaded regions indicate s.e.m. a, Average traces from the most risk-averse cell-specific D2SP-GCaMP6m-expressing rats (n = 3). Note increased neural activity during the decision period preceding a safe choice as compared to a risky (gain or loss) choice, as well as increased activity during the subsequent decision period (blue dashed box) following a loss outcome. b, Average traces from the most risk-averse non-cell-type-specific (hSYN-GCaMP6m-expressing) rats (n = 4). Note the increased activity in these cells during the decision period before making a risky (red/green) as compared to safe (black) choice (contrasting with the opposite D2R+-specific result in a). Also in contrast to the D2R+ case, the pan-neuronal signal did not discriminate immediately-preceding loss (red) from immediately-preceding gain (green) during the subsequent decision period. c, d, These pattern were also consistent in the most risk-seeking animals (D2SP-GCaMP6m-expressing rats, n =3; hSYN-GCaMP6m-expressing rats, n =4). e–h, This pattern did not depend on the location of the implant relative to the safe lever. Shown are data from D2SP-GCaMP6m-expressing rats with implants ipsilateral to the location of the safe lever (n = 4); hSYN-GCaMP6m-expressing rats with implants ipsilateral to the location of the safe lever (n =4); D2SP-GCaMP6m-expressing rats with implants contralateral to the location of the safe lever (n = 2); hSYN-GCaMP6m-expressing rats with implants contralateral to the location of the safe lever (n = 4). Data for a, c, e and g are from the rats whose behaviour and neural data are represented in Fig. 3. Data for b, d, f and h are not represented in the main figures of the manuscript. Throughout the figure, traces were analysed as dF/F and z-score normalized before averaging. Scale bars indicate 1 s and 0.25 standard (z-score) units.
Extended Data Figure 9. Pan-neuronal NAc recordings: increased activity associated with risky decisions.
a, Median-normalized dF/F signal during the first second of the outcome period for each hSYN-GCaMP6m-expressing rat, comparing risky outcomes to safe outcomes (n = 8; Wilcoxon matched-pairs test, W =36, P =0.008). b, Lack of correlation between the proportion of choices made by each rat to the risky lever and the individual’s risky versus safe outcome signal ((dF/F) during the first 1 s of risky outcome/(dF/F) during safe outcome) (n =8 rats, Pearson’s r2 =0.12, P =0.40). c, Median-normalized dF/F signal during the first second of the outcome period for each D2SP-GCaMP6m-expressing rat, comparing safe outcomes to risky outcomes (n =6; Wilcoxon matched-pairs test, W =17, P =0.04). d, Lack of correlation between the proportion of choices made by each rat to the risky lever and the individual’s risky versus safe outcome signal ((dF/F) during the first 1 s of safe outcome/(dF/F) during risky outcome) (n =6; Pearson’s r2 =0.11, P =0.51). e, Median-normalized dF/F signal at the time of trial initiation for each hSYN-GCaMP6m-expressing rat, sorted on previous trial outcome, comparing risky outcomes to safe outcomes (n =8; paired t-test, t7 =7.25, P =0.0002). f, Lack of correlation between the proportion of choices made by each rat to the risky lever and the individual’s risk signal ((dF/F) at nosepoke trial initiation after risky outcome/(dF/F) after safe outcome) (n =8; Pearson’s r2 =0.01, P =0.78). g, Median-normalized dF/F signal at the time of trial initiation for each D2SP-GCaMP6m-expressing rat, sorted on previous trial outcome, comparing risky outcomes to safe outcomes (n =6; paired t-test, t5 =6.901, P =0.001). h, Correlation between the proportion of choices made by each D2SP-GCaMP6m-expressing rat to the risky lever and the individual’s risk signal ((dF/F) at nosepoke trial initiation after risky outcome/(dF/F) after safe outcome) (n =6; Pearson’s r2 =0.97, P =0.0003). i, Median-normalized dF/F signal at the time of trial initiation for each hSYN-GCaMP6m-expressing rat, sorted on upcoming choice, comparing risky choices to safe choices (n =8; paired t-test, t7 =2.11, P =0.036). j, Lack of correlation between the proportion of choices made by each rat to the risky lever and the individual’s decision period signal ((dF/F) at nosepoke trial initiation before a risky choice/(dF/F) before a safe choice) (n =8; Pearson’s r2 =0.17, P =0.31). k, Median-normalized dF/F signal at the time of trial initiation for each D2SP-GCaMP6m-expressing rat, sorted on upcoming choice, comparing risky choices to safe choices (n =8; paired t-test, t7 =2.11, P =0.036). l, Lack of correlation between the proportion of choices made by each rat to the risky lever and the individual’s safe choice signal ((dF/F) at nosepoke trial initiation before choosing safe/(dF/F) at nosepoke before choosing risky) (n =6; Pearson’s r2 =0.12, P =0.48). Data from k and l also appear in Fig. 3i, o and are reproduced here for ease of comparison. All error bars represent s.e.m.
Extended Data Figure 10. D2SP-eChR2 stimulation during the outcome period produced a small but still detectable effect on risk preference.
a, Stimulation was as in Fig. 4, except delivered during the first second of reward retrieval rather than during the 1-s decision period. b, The effect of this stimulation during the outcome period was smaller than that of stimulation during the decision period (two-way ANOVA, interaction F1,24 =6.12; *P = 0.02; Bonferroni post-hoc tests revealed a significant effect of stimulation during the decision period, P <0.001, but no effect of stimulation during the outcome period). c–h, As in Fig. 4, 1 s of 20-Hz optical stimulation of NAc DR2+ cells during the outcome period decreased risky choices in risk-seeking, but not risk-averse rats relative to YFP-expressing controls (two-way ANOVA, interaction F1,31 =4.317, P = 0.046; Bonferroni post-hoc test revealed a significant difference between eChR2-expressing and YFP-expressing risk-seeking rats, but no difference between experimental and control risk-averse rats; *P <0.05). Grey traces represent individual animals. Black and red traces represent the population average. Error bars represent s.e.m. Blue boxes indicate days on which optical stimulation was delivered during the outcome.
Acknowledgments
We would like to thank R. Malenka and K. Shenoy for advice on experimental design; A. Andalman for advice on analysis; P. Kalanithi for advice in general; E. Ferenczi, C. Földy, G. Panagiotakos, M. Bennett, A. Bryant, C. Beinat, and M. Palner for preliminary data collection and training in experimental techniques; S. Pak and C. Delacruz for administrative support; and the entire Deisseroth laboratory and Stanford University Neurosciences Program for training and support. All viruses were packaged at the Stanford Viral and Vector Core. K.A.Z. was supported by the NSF Graduate Research Fellowship Program, by the Stanford Neurosciences Program NIH Training Grant, and by an NRSA Predoctoral Fellowship from NIDA (1F31MH105151-01). T.N.L. was supported by a Stanford Dean’s Postdoctoral Fellowship and by an NRSA Postdoctoral Fellowship (1F32MH105053-01). B.K. was supported by a Stanford Neuroscience Institute Big Ideas Grant. K.D. was supported by NIMH, NIDA, NSF, the Wiegers Family Fund, the Nancy and James Grosfeld Foundation, the H.L. Snyder Medical Foundation, the Samuel and Betsy Reeves Fund, and the US Army Research Laboratory and Defense Advanced Research Projects Agency (Cooperative Agreement Number W911NF-14-2-0013); nothing in this material represents official views or policies of our funders. All clones and resources are freely available (http://optogenetics.org, http://clarityresourcecenter.org).
Footnotes
Online Content Methods, along with any additional Extended Data display items and Source Data, are available in the online version of the paper; references unique to these sections appear only in the online paper.
Author Contributions K.A.Z. led the design, performance, and analysis of experiments, in collaboration with C.R. for designing and generating the D2SP constructs, with B.K. for behavioural design and analysis, with T.N.L. for characterizing eChR2 and wavelength-dependent responses of GCaMP6m, and with T.J.D. and T.N.L. for photometry methods development and implementation. K.A.Z. and K.D. planned and wrote the paper with editorial input from all authors. K.D. supervised all aspects of the work.
The authors declare no competing financial interests. Readers are welcome to comment on the online version of the paper
References
- 1.Barkan CPL. A Field test of risk-sensitive foraging in black-capped chickadees (Parus Atricapillus) Ecology. 1990;71:391–400. [Google Scholar]
- 2.Kahneman D, Tversky A. Prospect theory: an analysis of decision under risk. Econometrica. 1979;47:263–291. [Google Scholar]
- 3.Caraco T, Martindale S, Whittam TS. An empirical demonstration of risk-sensitive foraging preferences. Anim Behav. 1980;28:820–830. [Google Scholar]
- 4.Real LA. Uncertainty and pollinator–plant interactions: the foraging behavior of bees and wasps on artificial flowers. Ecology. 1981;62:20–26. [Google Scholar]
- 5.Markowitz H. Portfolio Selection. J Finance. 1952;7:77–91. [Google Scholar]
- 6.Schultz W, et al. Explicit neural signals reflecting reward uncertainty. Philos Trans R Soc B Biol Sci. 2008;363:3801–3811. doi: 10.1098/rstb.2008.0152. [DOI] [PMC free article] [PubMed] [Google Scholar]
- 7.St Onge JR, Floresco SB. Dopaminergic modulation of risk-based decision making. Neuropsychopharmacology. 2009;34:681–697. doi: 10.1038/npp.2008.121. [DOI] [PubMed] [Google Scholar]
- 8.Nasrallah NA, et al. Risk preference following adolescent alcohol use is associated with corrupted encoding of costs but not rewards by mesolimbic dopamine. Proc Natl Acad Sci USA. 2011;108:5466–5471. doi: 10.1073/pnas.1017732108. [DOI] [PMC free article] [PubMed] [Google Scholar]
- 9.Knutson B, Wimmer GE, Kuhnen CM, Winkielman P. Nucleus accumbens activation mediates the influence of reward cues on financial risk taking. Neuroreport. 2008;19:509–513. doi: 10.1097/WNR.0b013e3282f85c01. [DOI] [PubMed] [Google Scholar]
- 10.Tom SM, Fox CR, Trepel C, Poldrack RA. The neural basis of loss aversion in decision-making under risk. Science. 2007;315:515–518. doi: 10.1126/science.1134239. [DOI] [PubMed] [Google Scholar]
- 11.Winstanley CA, Theobald DEH, Dalley JW, Robbins TW. Interactions between serotonin and dopamine in the control of impulsive choice in rats: therapeutic implications for impulse control disorders. Neuropsychopharmacology. 2005;30:669–682. doi: 10.1038/sj.npp.1300610. [DOI] [PubMed] [Google Scholar]
- 12.Bechara A, Damasio AR, Damasio H, Anderson SW. Insensitivity to future consequences following damage to human prefrontal cortex. Cognition. 1994;50:7–15. doi: 10.1016/0010-0277(94)90018-3. [DOI] [PubMed] [Google Scholar]
- 13.Clark L, et al. Differential effects of insular and ventromedial prefrontal cortex lesions on risky decision-making. Brain. 2008;131:1311–1322. doi: 10.1093/brain/awn066. [DOI] [PMC free article] [PubMed] [Google Scholar]
- 14.St Onge JR, Abhari H, Floresco SB. Dissociable contributions by prefrontal D1 and D2 receptors to risk-based decision making. J Neurosci. 2011;31:8625–8633. doi: 10.1523/JNEUROSCI.1020-11.2011. [DOI] [PMC free article] [PubMed] [Google Scholar]
- 15.Bechara A, Damasio H, Damasio AR. Emotion, decision making and the orbitofrontal cortex. Cereb Cortex. 2000;10:295–307. doi: 10.1093/cercor/10.3.295. [DOI] [PubMed] [Google Scholar]
- 16.O’Neill M, Schultz W. Coding of reward risk by orbitofrontal neurons is mostly distinct from coding of reward value. Neuron. 2010;68:789–800. doi: 10.1016/j.neuron.2010.09.031. [DOI] [PubMed] [Google Scholar]
- 17.Stopper CM, Tse MTL, Montes DR, Wiedman CR, Floresco SB. Overriding phasic dopamine signals redirects action selection during risk/reward decision making. Neuron. 2014;84:177–189. doi: 10.1016/j.neuron.2014.08.033. [DOI] [PubMed] [Google Scholar]
- 18.Hayden BY, Platt ML. Gambling for Gatorade: risk-sensitive decision making for fluid rewards in humans. Anim Cogn. 2009;12:201–207. doi: 10.1007/s10071-008-0186-8. [DOI] [PMC free article] [PubMed] [Google Scholar]
- 19.Niv Y, Edlund JA, Dayan P, O’Doherty JP. Neural prediction errors reveal a risk-sensitive reinforcement-learning process in the human brain. J Neurosci. 2012;32:551–562. doi: 10.1523/JNEUROSCI.5498-10.2012. [DOI] [PMC free article] [PubMed] [Google Scholar]
- 20.Dodd ML, et al. Pathological gambling caused by drugs used to treat parkinson disease. Arch Neurol. 2005;62:1377–1381. doi: 10.1001/archneur.62.9.noc50009. [DOI] [PubMed] [Google Scholar]
- 21.Frank MJ, Seeberger LC, O’Reilly RC. By carrot or by stick: cognitive reinforcement learning in parkinsonism. Science. 2004;306:1940–1943. doi: 10.1126/science.1102941. [DOI] [PubMed] [Google Scholar]
- 22.van Eimeren T, et al. Dopamine agonists diminish value sensitivity of the orbitofrontal cortex: a trigger for pathological gambling in Parkinson’s disease? Neuropsychopharmacoly. 2009;34:2758–2766. doi: 10.1038/sj.npp.npp2009124. [DOI] [PMC free article] [PubMed] [Google Scholar]
- 23.Kebabian JW, et al. A-77636: a potent and selective dopamine D1 receptor agonist with antiparkinsonian activity in marmosets. Eur J Pharmacol. 1992;229:203–209. doi: 10.1016/0014-2999(92)90556-j. [DOI] [PubMed] [Google Scholar]
- 24.Dreyer JK, Herrik KF, Berg RW, Hounsgaard JD. Influence of phasic and tonic dopamine release on receptor activation. J Neurosci. 2010;30:14273–14283. doi: 10.1523/JNEUROSCI.1894-10.2010. [DOI] [PMC free article] [PubMed] [Google Scholar]
- 25.Porter-Stransky KA, Seiler JL, Day JJ, Aragona BJ. Development of behavioral preferences for the optimal choice following unexpected reward omission is mediated by a reduction of D2-like receptor tone in the nucleus accumbens. Eur J Neurosci. 2013;38:2572–2588. doi: 10.1111/ejn.12253. [DOI] [PubMed] [Google Scholar]
- 26.Chen TW, et al. Ultrasensitive fluorescent proteins for imaging neuronal activity. Nature. 2013;499:295–300. doi: 10.1038/nature12354. [DOI] [PMC free article] [PubMed] [Google Scholar]
- 27.Gunaydin LA, et al. Natural Neural projection dynamics underlying social behavior. Cell. 2014;157:1535–1551. doi: 10.1016/j.cell.2014.05.017. [DOI] [PMC free article] [PubMed] [Google Scholar]
- 28.Lerner TN, et al. Intact-brain analyses reveal distinct information carried by SNc dopamine subcircuits. Cell. 2015;162:635–647. doi: 10.1016/j.cell.2015.07.014. [DOI] [PMC free article] [PubMed] [Google Scholar]
- 29.Gradinaru V, et al. Molecular and cellular approaches for diversifying and extending optogenetics. Cell. 2010;141:154–165. doi: 10.1016/j.cell.2010.02.037. [DOI] [PMC free article] [PubMed] [Google Scholar]
- 30.Tai LH, Lee AM, Benavidez N, Bonci A, Wilbrecht L. Transient stimulation of distinct subpopulations of striatal neurons mimics changes in action value. Nature Neurosci. 2012;15:1281–1289. doi: 10.1038/nn.3188. [DOI] [PMC free article] [PubMed] [Google Scholar]
- 31.Kepecs A, Uchida N, Zariwala HA, Mainen ZF. Neural correlates, computation and behavioural impact of decision confidence. Nature. 2008;455:227–231. doi: 10.1038/nature07200. [DOI] [PubMed] [Google Scholar]
- 32.Kopec CD, Erlich JC, Brunton BW, Deisseroth K, Brody CD. Cortical and subcortical contributions to short-term memory for orienting movements. Neuron. 2015;88:367–377. doi: 10.1016/j.neuron.2015.08.033. [DOI] [PMC free article] [PubMed] [Google Scholar]
- 33.Witten IB, et al. Recombinase-driver rat lines: tools, techniques, and optogenetic application to dopamine-mediated reinforcement. Neuron. 2011;72:721–733. doi: 10.1016/j.neuron.2011.10.028. [DOI] [PMC free article] [PubMed] [Google Scholar]
- 34.Minowa T, Minowa MT, Mouradian MM. Analysis of the promoter region of the rat D2 dopamine receptor gene. Biochemistry. 1992;31:8389–8396. doi: 10.1021/bi00151a001. [DOI] [PubMed] [Google Scholar]
- 35.Leong JK, Pestilli F, Wu CC, Samanez-Larkin GR, Knutson B. White-matter tract connecting anterior insula to nucleus accumbens correlates with reduced preference for positively skewed gambles. Neuron. 2016;89:63–69. doi: 10.1016/j.neuron.2015.12.015. [DOI] [PMC free article] [PubMed] [Google Scholar]


