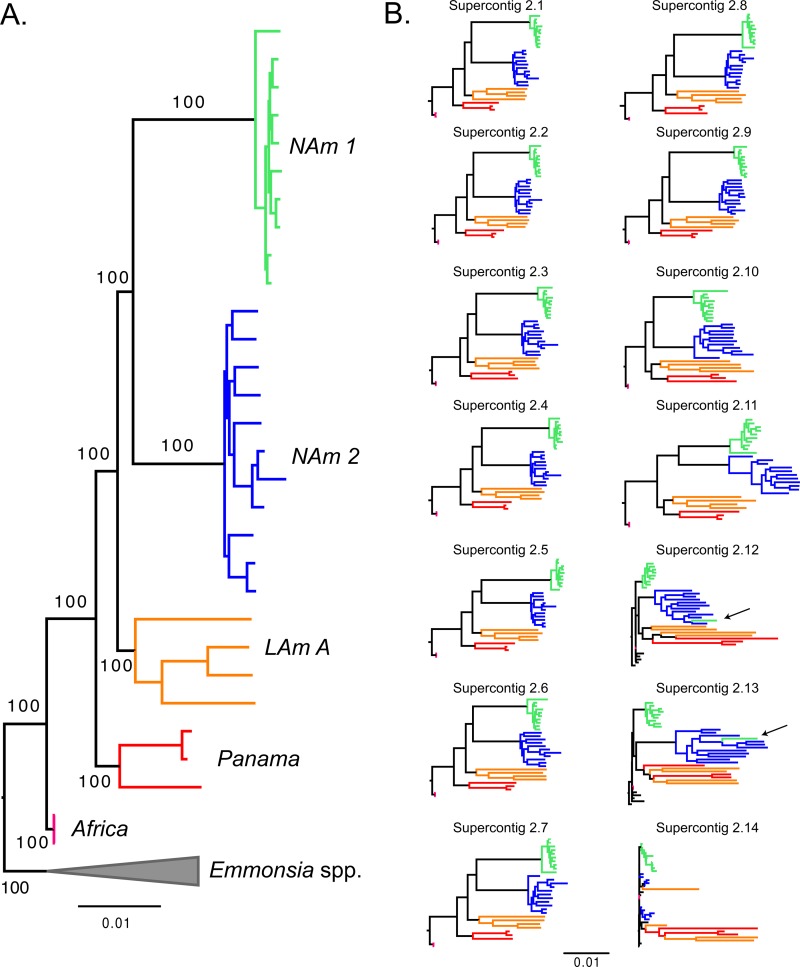
FIG 2 .
Rooted phylogram for the species of the Histoplasma genus using whole-genome data. The leftmost tree (A) shows a tree constructed using the variation from the whole genome. The trees to the right (B) were built with data from each of the 14 supercontigs. (The length of each supercontig is not shown). The length of each branch indicates the amount of genetic divergence. Arrows in the trees to the right show isolates with conflicting positioning for a given supercontig. All topologies are rooted with Emmonsia sp.

