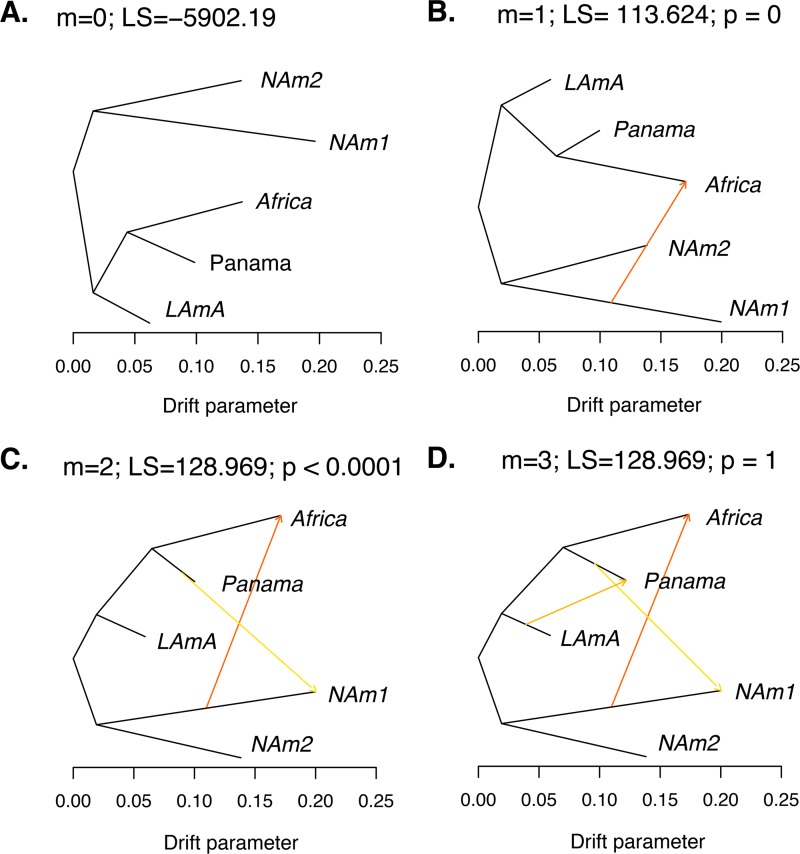
FIG 5 .
TreeMix results show genetic differentiation between species from the Histoplasma genus. (A) Best-fitting genealogy without admixture for Histoplasma species calculated from the variance-covariance matrix of genome-wide allele frequencies. We estimated the likelihood of three demographic scenarios with 1 to 3 migration events (m). The caption for each panel shows the number of migrations (m), the LS of the demographic scenario, and the P value (p) of the comparison between that model and the model with m−1 migration events (also shown in Table 3). (B) m = 1. (C) m = 2. (D) m = 3. To determine the best-fitting demographic scenario, we used LRTs to compare nested models (one migration versus two migrations and two migrations versus three migrations). We also used wAIC to find the best-supported migration scenario (see text). The caption for each panel contains the number of migrations, the likelihood, and the associated P value when comparing that demographic scenario with the previous one. The best-fitting demographic history involved two migration events: one from NAm 1 to Africa and a second one from Panama to NAm 1 (B).

