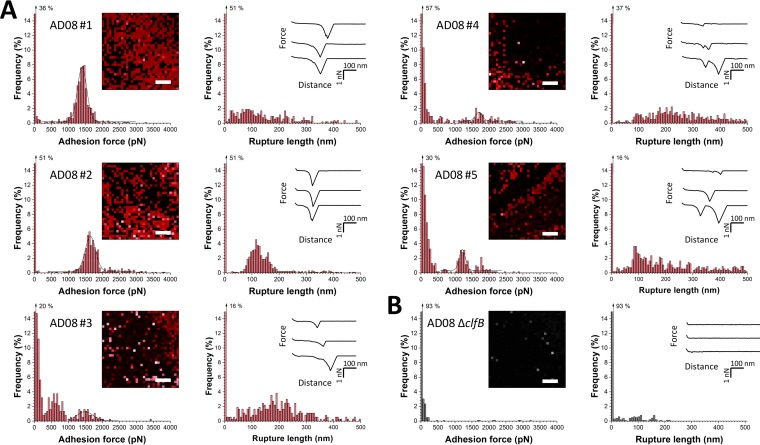
FIG 3 .
SMFS captures the localization and binding strength of ClfB on living bacteria. (A) Adhesion force and rupture length histograms obtained by recording force curves in PBS across the surface of five AD08 cells with tips labeled with Lor. The insets show adhesion force maps (left; scale bars, 100 nm; color scales, 4,000 pN) and representative force curves (right). Each red pixel represents the detection of a single adhesin (sometimes multiple adhesins). (B) Data obtained under the same conditions with an AD08 ΔclfB mutant cell. All curves were obtained by using a contact time of 100 ms, a maximum applied force of 250 pN, and an approach and retraction speed of 1,000 nm ⋅ s−1.

