
Figure 10.
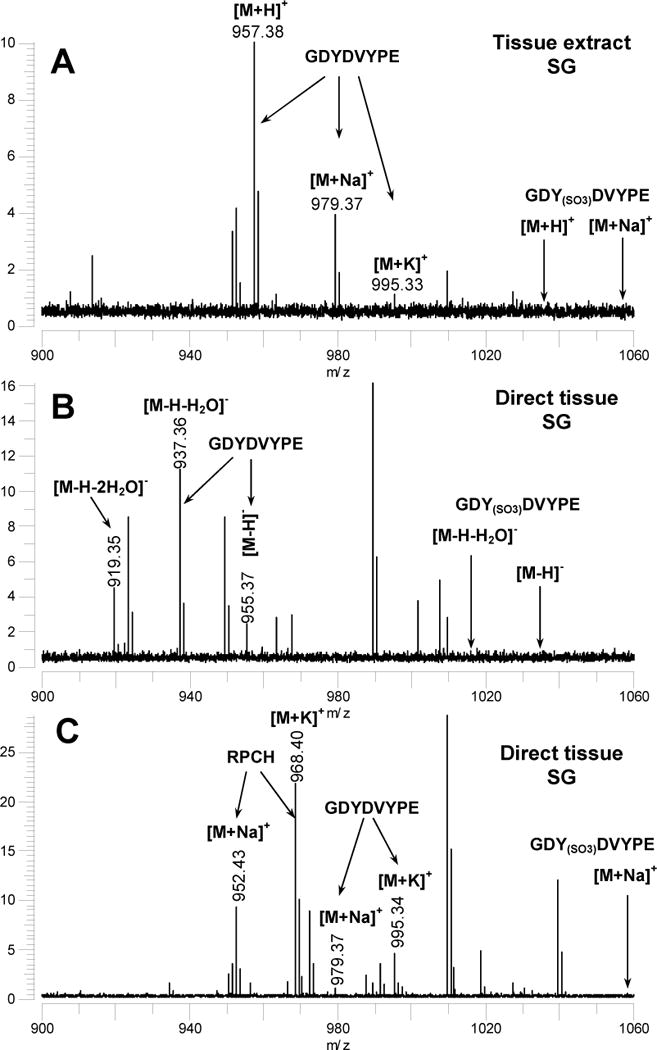
(A) MALDI-FT mass spectrum of a tissue extract from a single SG tissue from Homarus americanus analysed using 3-hydroxypicolinic acid (HPA) as a matrix to reduce metastable loss of SO3 from sulfated peptides. The m/z values where peaks corresponding to GDY(SO3)DVPE (not detected) would appear are indicated. (B) MALDI-FT mass spectrum of a SG tissue sample from H. americanus measured in the negative ion mode using DHB as the MALDI matrix. The m/z values where peaks corresponding to GDY(SO3)DVPE (not detected) would appear are indicated. (C) MALDI-FT mass spectrum of a a SG tissue sample from H. americanus measured using DHB as the MALDI matrix and following the addition of aqueous NaCl and KCl to promote the formation of [M+Na]+ and [M+K]+ ions. All spectra were measured using conditions optimized for the detection of m/z 1500.