Abstract
Perfluorononanoic acid (PFNA) is a perfluoroalkyl substance (PFAS) that is structurally related to perfluorooctanoic acid (PFOA) and perfluorooctane sulfonate (PFOS). Whereas PFOA and PFOS are known immunotoxicants, PFNA is less well characterized. Our previous study showed that PFNA has immunomodulatory effects on leukocyte populations and immune function. The present studies sought to determine whether, and to what degree, the immune system recovered 28 days after PFNA exposure. None of the parameters measured had fully recovered. A few parameters had partially recovered, including decreased spleen size and the decreased ratio of the CD4+/CD8+ double-positive population in thymus. The majority of effects of PFNA remained unchanged 28 days after exposure, including decreased proportion of intact thymocytes (as determined by FSC vs SSC), alterations in the ratios of immune cell populations in spleen and the CD4+, CD8+ and double-negative populations in thymus. Notably, PFNA markedly increased the TNFα response to LPS in vivo, and no recovery was evident 28 days after exposure. The effect of PFNA on CD4+ T cells, CD8+ T cells and CD19+ cells was more pronounced in females. The current study demonstrates that a single high dose exposure to PFNA (e.g. as might occur accidentally in an occupational setting) has long-lasting effects on the immune system.
Keywords: Perfluorononanoic acid (PFNA), Perfluoroalkyl substance (PFAS), T cell, B cell, LPS, TNFα
Introduction
Perfluoroalkyl substances (PFAS’s) are a family of chemicals that have unique water-repelling and oil-repelling characteristics. Because of these characteristics, these chemicals have numerous applications, including protective coatings for paper, cardboard, carpet, leather and textiles. In addition, PFAS’s have been used in waterproofing products, floor polish, flame retardants, fire-fighting foams and adhesives. PFAS’s have also been used in the manufacturing of fluoropolymers, which have various uses including coatings for non-stick cookware and in the insulation of electrical wire (ATSDR, 2009; Prevedouros et al., 2006). In general, chemicals in this class have low water solubility, low volatility, are persistent in the environment, and bioaccumulate in animals. Widespread detection of numerous PFAS’s has been observed in the serum of the U.S. population and in other countries (CDC, 2009; CDC, 2012). While serum levels of several PFAS chemicals appear to be declining in the U.S. and elsewhere, perfluorononanoic acid (PFNA) is a notable exception. Previous studies indicate that serum levels of PFNA doubled over a six year period within the U.S., but the reason for this is not currently clear (Calafat et al., 2007).
Toxicity concerns with respect to the PFAS’s began to emerge when it was found that the ammonium salt of perfluorooctanoic acid (PFOA) has numerous toxic effects in animal models, including hepatotoxicity, alterations in the immune system and in development. With respect to humans, PFOA and perfluorooctane sulfonate (PFOS) exposure have been associated with decreased birth weight (Apelberg et al., 2007). Similarly, PFNA has also been shown to have adverse biological effects. In animal models, PFNA has been shown to disrupt glucose metabolism (Fang et al., 2012), impair neonatal survival and development (Wolf et al., 2010), induce hepatomegaly and hepatic peroxisomal β-oxidation (Kudo et al., 2006) and cause immunotoxicity (Fang et al., 2008; Rockwell et al., 2013).
With respect to immunotoxicity, daily PFNA administration over the course of 14 days caused splenic and thymic atrophy and inhibition of cytokine production in BALB/c mice, an animal model that tends to be Th2-skewed (Fang et al., 2008). In C57BL/6 mice, an animal model that tends to be more Th1-skewed, we found PFNA caused similar effects. A single dose of PFNA (0.1 mmol/kg) caused marked splenic and thymic atrophy and an altered balance of immune cell populations in the spleen and thymus 14 days after administration (Rockwell et al., 2013). The dose of PFNA (0.1 mmol/kg) was chosen to correlate with a relatively high dose as might occur in an accidental and/or occupational exposure. The purpose of the present study was to determine whether there was any recovery from these effects at a later time-point, specifically, 28 days after PFNA administration. This time-point was chosen based on the time to recovery of toxic and immunomodulatory effects of other PFAS’s as determined by previous studies from our lab (unpublished observations) and other investigators.
Materials and Methods
Materials
PFNA (free acid form; 97% purity; M.W. 464 g/mol) was purchased from Sigma-Aldrich Co. (St Louis, MO).
PFNA administration to mice
Eight-week-old adult male and female C57BL/6J mice were purchased from Jackson Laboratories (Bar Harbor, Maine), and housed according to AAALAC (Association for Assessment and Accreditation of Laboratory Animal Care) guidelines. Adult C57BL/6 male (n = 5) and female (n = 5) mice were administered a single dose of PFNA (0.1 mmol/kg of body weight) by intraperitoneal (i.p.) injection. Control mice were treated i.p. with the vehicle, propylene glycol:water (1:1, v/v). After four weeks, the spleen, thymus, and liver were collected from each mouse. For studies with LPS, it was administered 4 weeks after PFNA exposure. The mice were given a single i.p. dose of LPS (1 mg/kg) or vehicle (sterile saline). One hour and thirty minutes after LPS administration, blood was collected from each animal and TNFα concentrations were quantified. The animal studies were conducted in accordance with the Guide for the Care and Use of Laboratory Animals as adopted by the National Institutes of Health, and were approved by the Institutional Animal Care and Use Committee (IACUC) at the University of Kansas Medical Center and/or Michigan State University.
Flow cytometry
Splenocytes and thymocytes were isolated by manually dissociating spleens and thymus respectively using glass slides. Freshly-isolated splenocytes or thymocytes were washed and resuspended in FACS buffer (PBS, 1% FCS). The cells were then incubated with anti-CD4/PerCP (RM4-5, 0.4 µg/ml), anti-CD8/APC (Ly-2, 0.4 µg/ml), anti-CD19/PE (MB19-1, 0.4 µg/ml), and/or anti-CD14/FITC (Sa2-8, 1 µg/ml) for 30 min at 4° C, after which the cells were washed and fixed with BD Cytofix fixation buffer (BD Biosciences, San Jose, CA). The fluorescence was then detected and quantified with a BD™ FACSCalibur flow cytometer (BD Biosciences, San Jose, CA). Spectral overlap was manually compensated by a trained flow cytometrist. The data were analyzed using FlowJo 7.5 software (Tree Star, Inc., Ashland, OR).
TNFα ELISA
TNFα levels in the serum were quantified by a commercially available mouse TNFα ELISA kit according to the manufacturer’s protocol (Ebioscience, San Diego CA). The relative absorbance of each sample was quantified on a Bio-Tek µQuant microplate reader (Highland Park, VT). The TNFα concentrations were calculated using a 4-parameter standard curve.
Statistical Analysis
The mean ± standard error was determined for each treatment in the individual experiments. Homogeneous data were evaluated by two-way parametric analysis of variance. When significant differences were observed, the Holm-Sidak post-hoc test was used to compare treatment groups to the vehicle (VH) control using SigmaStat 3.01a software from Systat Software, Inc. (Chicago, IL).
Results
Splenic and Thymic Atrophy by PFNA
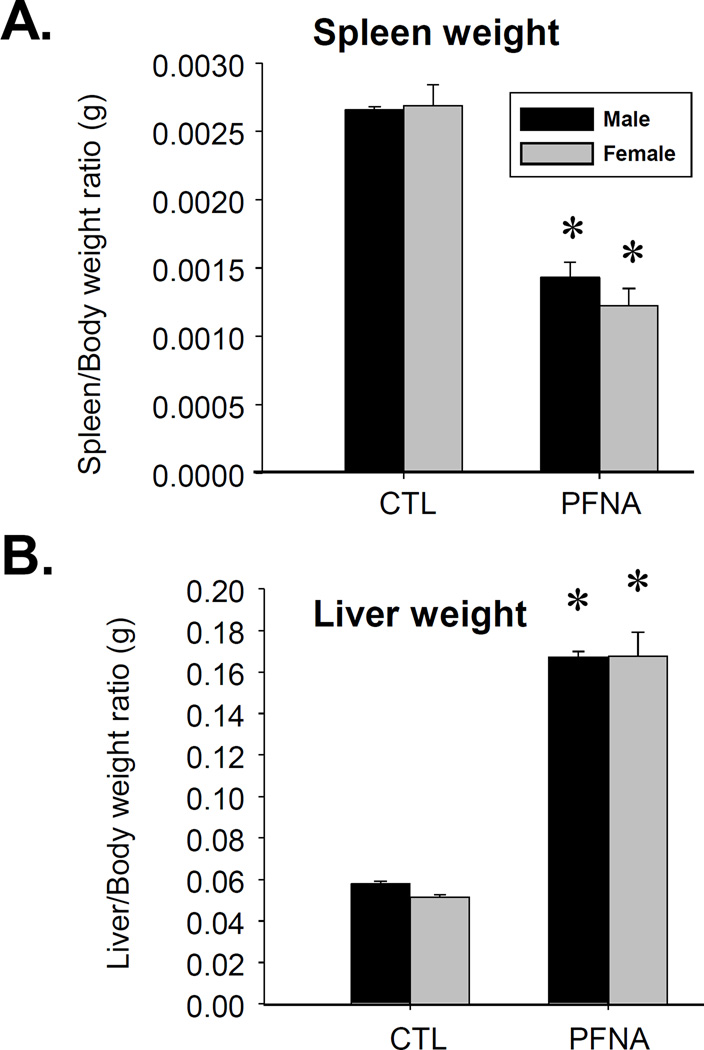
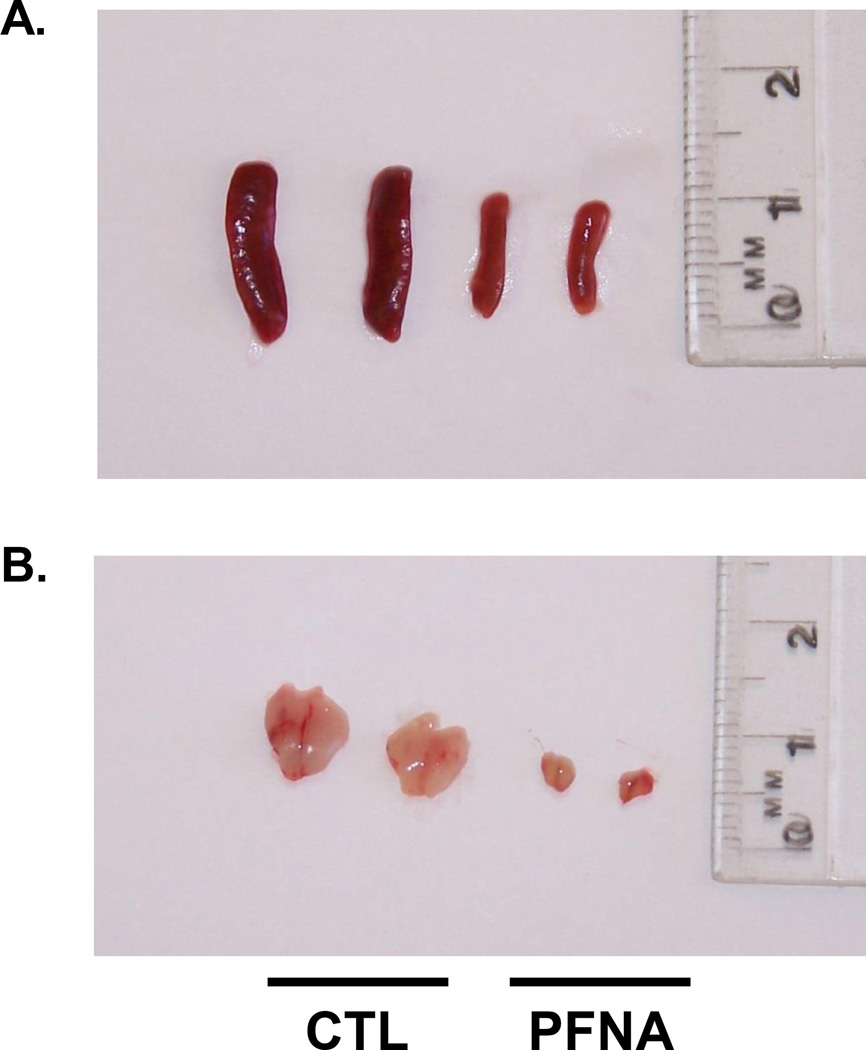
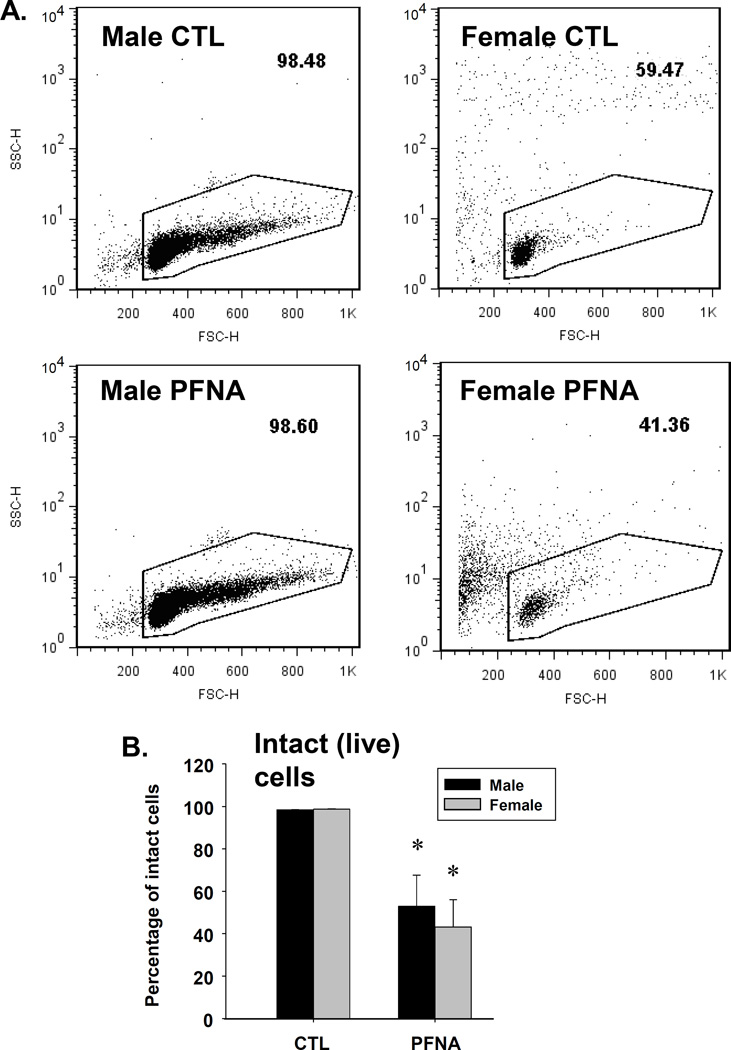
We have previously reported the acute effects of a single dose of PFNA (0.1 mmol/kg) on the immune system in C57BL/6 mice after 2 weeks of exposure (Rockwell et al., 2013). The purpose of the present studies was to assess the effects of PFNA on lymphoid organs and immune cells 4 weeks after administration in order to determine whether recovery had occurred during this time. Spleen/body weight ratio remained decreased 4 wk after PFNA administration (Fig. 1a). This decrease in size was easily discernible by the naked eye (Fig. 2a). However, in comparison to the decrease in spleen/body weight ratio at 2 wk after PFNA administration (~65 – 70% decrease, Rockwell et al., 2013), some modest recovery was observed 4 wk after PFNA administration (~50% decrease, Fig. 1a and Table 1). Consistent with the effects of PFNA after 2 weeks, liver weights remained increased even 4 weeks after administration (Fig. 1b). Similar to the spleen, marked atrophy was also evident in the thymus 4 weeks after PFNA administration and lymph nodes were virtually undetectable (Fig. 2b and data not shown). Although cellular viability was not directly measured using a viability dye, we observed marked effects of PFNA on the ratio of intact thymocytes to debris, which strongly suggests an effect of PFNA on viability. Specifically, we found that the percentage of intact thymocytes was still decreased 4 weeks after PFNA administration (male: ↓47%, female: ↓57%) with no recovery observed between 2 and 4 weeks after exposure (Fig. 3, Table 2).
Fig. 1.
The relative organ weights of mice four weeks after PFNA administration. The ratios of (A) spleen and (B) liver to body weight were measured four weeks after PFNA administration. The data are presented as the mean ± SE. * denotes p<0.05 as compared to the vehicle control (CTL) for the same gender.
Fig. 2.
PFNA causes marked spleen and thymus atrophy. Photo of representative spleens and thymuses of vehicle-treated (CTL) and PFNA-treated male C57Bl/6 mice, 4 weeks after administration depicting a substantial decrease in organ size.
Table 1.
Percent change in splenic immune parameters in PFNA-treated mice as compared to control mice at 2 and 4 weeks.
| Time Pta |
Gender | Spleen Wtb (relative to body wt) |
CD4 T cells (Spleen)c |
CD8 T cells (Spleen)c |
CD19+ cells (Spleen)c |
CD14+ cells (Spleen)c |
|---|---|---|---|---|---|---|
| 2 Wk | Male | ↓ 64.4 +/− 5.4 | ↑ 40.7 +/− 2.2 | ↑ 55.8 +/− 4.2 | ↓ 12.3 +/− 0.7 | ↓ 32.6 +/− 2.4 |
| 2 Wk | Female | ↓ 70.6 +/− 5.9 | ↑ 48.8 +/− 2.9 | ↑ 40.9 +/− 1.4 | ↓ 30.9 +/− 2.2 | ↓ 22.0 +/− 2.8 |
| 4 Wk | Male | ↓ 46.1 +/− 3.6 | ↑ 38.6 +/− 1.1 | ↑ 51.1 +/− 1.9 | ↓ 20.5 +/− 0.5 | ↑ 87.6 +/− 6.9 |
| 4 Wk | Female | ↓ 54.5 +/− 5.6 | ↑ 62.0 +/− 3.8 | ↑ 70.7 +/− 4.2 | ↓ 37.7 +/− 4.0 | ↑ 102.4 +/− 12.5 |
Time point after single PFNA administration
Percent difference as compared to vehicle controls
Percent change in the ratio of each subpopulation (CD4+, CD8+, CD19+, CD14+) relative to the whole splenocyte population as compared to vehicle controls
Fig. 3.
PFNA decreases thymocyte viability as assessed by forward vs. side scatter. Forward vs. side scatter was assessed in (A) male and (B) female thymocytes by flow cytometry. (C) Live cells were quantified and graphed. The data are presented as the mean ± SE. * denotes p<0.05 as compared to the vehicle control (CTL) for the same gender.
Table 2.
Percent change in thymic immune parameters in PFNA treated mice as compared to control mice at 2 and 4 weeks.
| Time Pta |
Gender | Intact Thymocytes (Viability) |
CD4/CD8 Double-negative |
CD4 Single- positive |
CD8 Single- positive |
CD4/CD8 Double- positive |
|---|---|---|---|---|---|---|
| 2 Wk | Male | ↓ 45.7 +/− 10.1 | ↑ 812.2 +/− 126.9 | ↑ 209.1 +/− 43.8 | ↑ 177.7 +/− 45.4 | ↓ 99.3 +/− 39.0 |
| 2 Wk | Female | ↓ 24.5 +/− 3.8 | ↑ 310.2 +/− 79.6 | ↑ 313.9 +/− 34.8 | ↑ 225.1 +/− 31.9 | ↓ 96.5 +/− 34.1 |
| 4 Wk | Male | ↓ 47.0 +/− 14.6 | ↑ 803.9 +/− 385.1 | ↓ 23.1 +/− 3.8 | ↓ 4.0 +/− 0.6 | ↓ 32.6 +/− 8.4 |
| 4 Wk | Female | ↓ 56.8 +/− 12.9 | ↑ 727.4 +/− 147.7 | ↑ 79.3 +/− 13.6 | ↑ 157.4 +/− 41.1 | ↓ 56.6 +/− 19.9 |
Time point after single PFNA administration
No recovery from increased ratios of CD4+ and CD8+ T cells within the whole splenocyte population
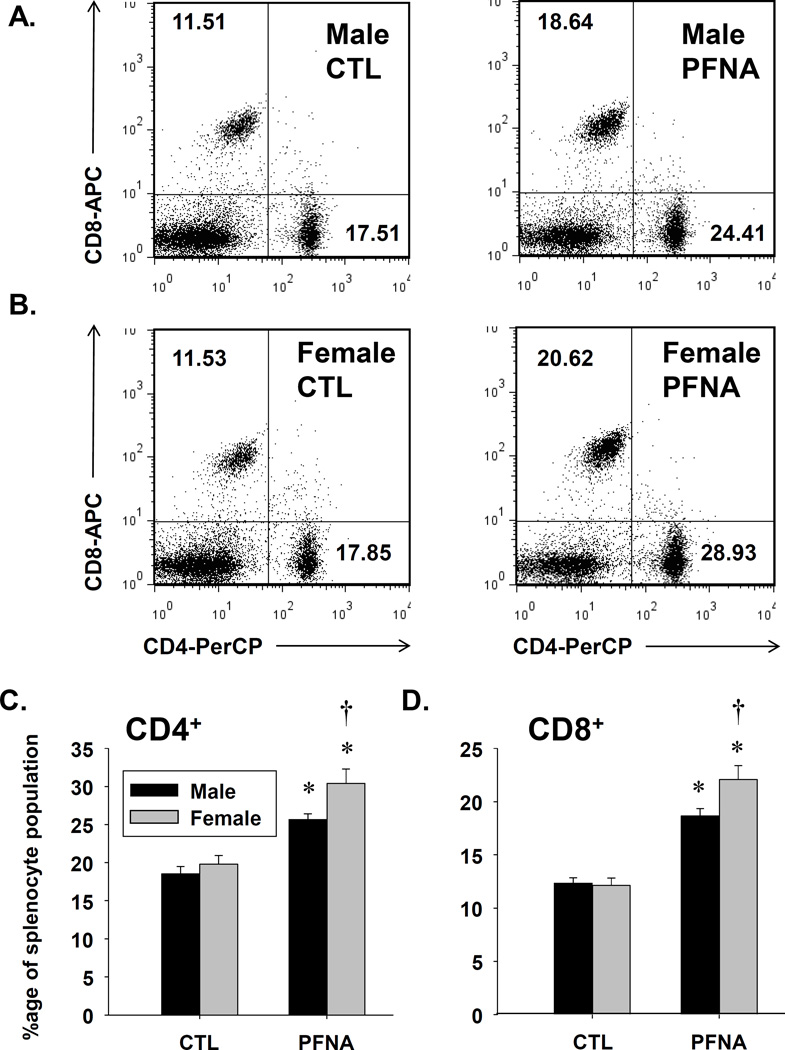
To determine the recovery of various leukocyte populations to PFNA 4 weeks after administration, we conducted immunophenotyping analysis by flow cytometry. As was observed 2 weeks after PFNA administration, the ratios of both CD4+ and CD8+ cells were increased relative to the entire splenocyte population in both male and female mice (Fig. 4 and Table 1). Interestingly, a gender difference was observed in which the percentages of both CD4+ and CD8+ cells were elevated in female mice compared to male mice 4 weeks after PFNA exposure (Fig. 4). In contrast, the percentage of CD8+ T cells was lower in females 2 weeks after PFNA administration. Overall, the data suggest T cells are somewhat less sensitive to the immunomodulatory effects of PFNA compared to other splenic populations.
Fig. 4.
PFNA increases the ratios of CD4+ and CD8+ T cells relative to the whole splenocyte population. Unfractionated splenocytes were washed, incubated with fluorochrome-conjugated antibodies and analyzed by flow cytometry. Representative dot plots of CD4+ and CD8+ T cells are depicted from vehicle-treated (CTL) and PFNA-treated (A) male and (B) female mice. The numbers on the dot plot represent the percentage of the population for that quadrant. Graphical representation of (C) CD4+ and (D) CD8+ T cell percentages with respect to the whole splenocyte population. The data are presented as mean ± SE. * denotes p<0.05 as compared to the vehicle (VH) control for the same gender. † denotes p<0.05 as compared between genders for the same treatment group.
Partial recovery of the CD4+/CD8+ double positive thymic T cells four weeks after PFNA administration
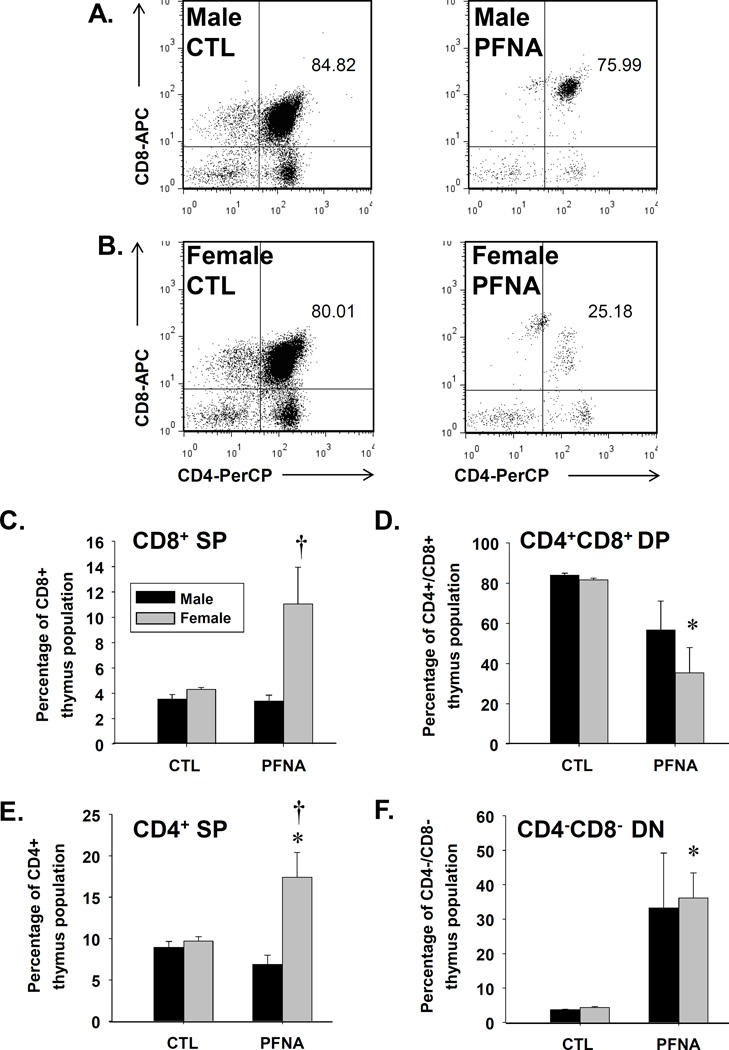
In addition to assessing mature splenic T cells, we investigated the effects of PFNA on immature thymocytes. Two weeks after administration, PFNA completely abrogated the CD4+/CD8+ double-positive thymocyte population, which is normally the dominant lymphocyte population in thymus (Table 2).
Four weeks after PFNA administration, the CD4+/CD8+ double-positive thymocyte population remained substantially diminished (Fig. 5). However, in comparison to the decrease in this population 2 wk after PFNA administration (~99% decreased), some partial recovery was observed 4 wk after administration (~33 – 57% decreased, Table 2). Interestingly, the decrease in CD4+/CD8+ thymocytes was more prevalent in females (decreased 57%) compared to males (decreased 33%, Fig. 5 and Table 2) at 4 wk after PFNA administration.
Fig. 5.
Decrease in the CD4+CD8+ double-positive T cell population in thymus of PFNA-treated mice. Isolated thymocytes were washed, incubated with fluorochrome-conjugated antibodies and analyzed by flow cytometry. Representative dot plots of thymocyte populations are depicted from vehicle-treated (CTL) and PFNA-treated (A) male and (B) female mice. Graphical representation of the ratios of the (C) CD8+ single positive T cells, (D) CD4+ CD8+ double-positive T cells, (E) CD4+ single positive T cells and (F) the CD4− CD8− double-negative T cells with respect to the whole thymocyte population. The data are presented as mean ± SE. * denotes p<0.05 as compared to the vehicle (VH) control for the same gender. † denotes p<0.05 as compared between genders for the same treatment group.
Effect of PFNA on CD19+ and CD14+ cells in spleen four weeks after administration
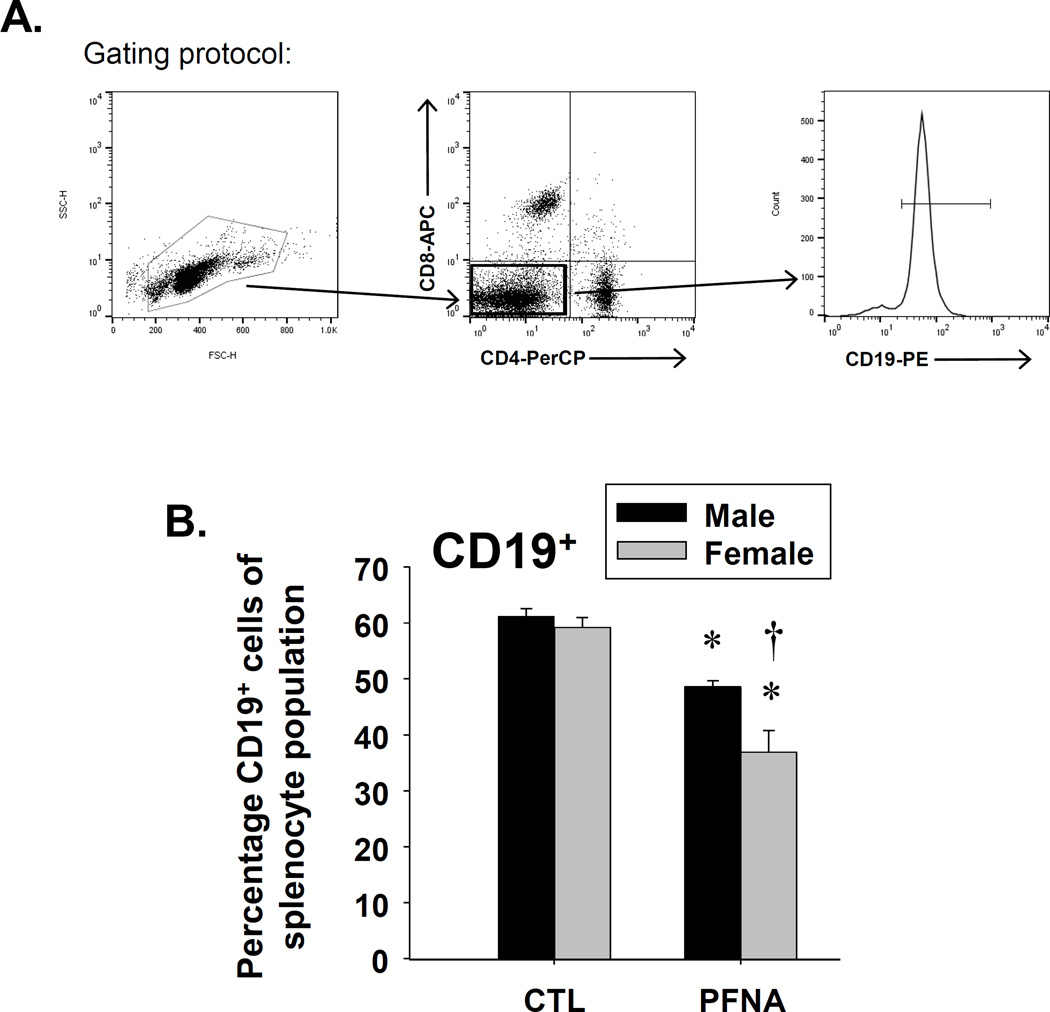
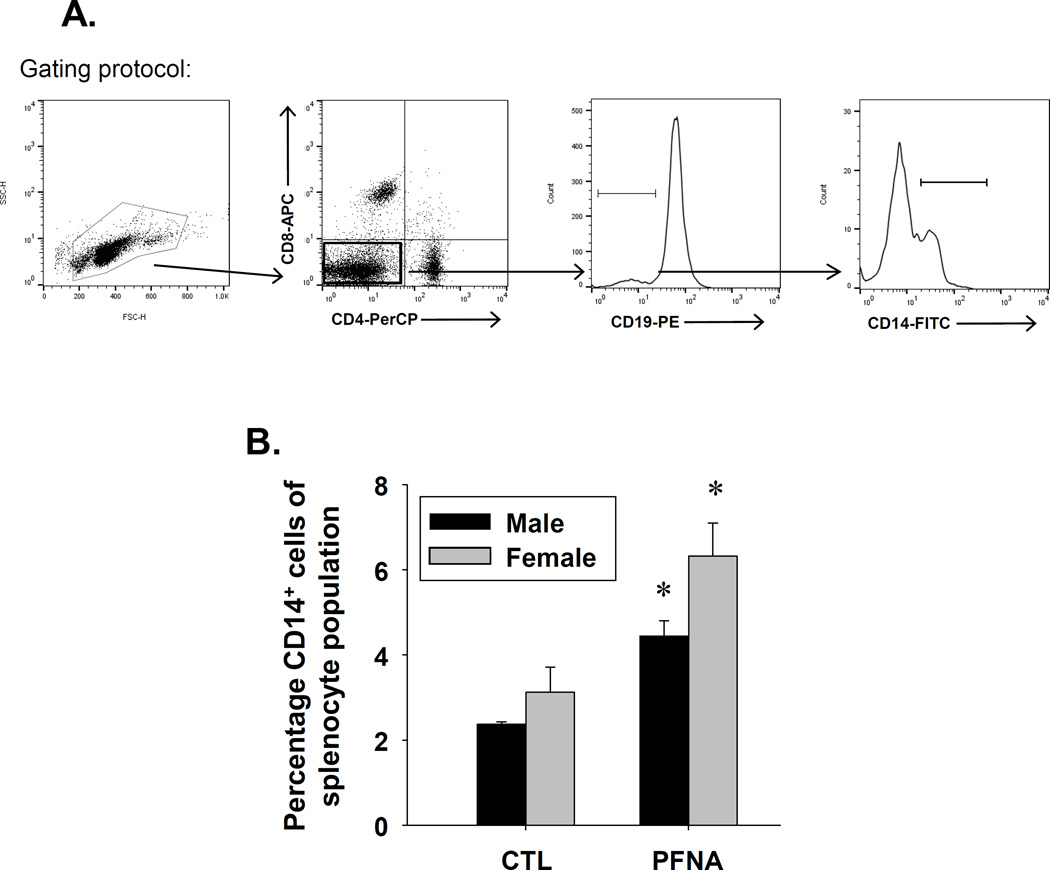
In addition to T cells, we also assessed the effect of PFNA on CD19+ and CD14+ cells four weeks after administration. CD19 is a co-receptor that associates with the B cell receptor and thus, is a commonly-used B cell marker. CD14 is the LPS co-receptor and is expressed by phagocytes, such as dendritic cells and macrophages. PFNA decreased the CD19+ population at both two and four weeks after administration, with no recovery observed at four weeks after administration (Fig. 6, Table 1). A greater decrease in the CD19+ population was observed in females at both two and four weeks after PFNA exposure (Fig. 6, Table 1). In contrast to CD19+ cells, PFNA had differential effects on CD14+ cells two and four weeks after administration (Table 1). Whereas PFNA decreased the percentage of the CD14+ population relative to the whole splenocyte population two weeks after administration, PFNA increased the ratio of CD14+ cells within the splenocyte population at four weeks after administration (Table 1, Fig. 7). Collectively, the data suggest PFNA consistently decreased the B cell population two and four weeks after administration, but had differential effects on CD14+ cells in which it decreased the proportion of CD14+ cells two weeks after administration, but increased the proportion of CD14+ cells four weeks after administration.
Fig. 6.
Decrease in the percentage of CD19+ cells in spleen of female PFNA-treated mice. Unfractionated splenocytes were washed, incubated with fluorochrome-conjugated antibodies and analyzed by flow cytometry. A representative histogram of CD19+ B cells is depicted from vehicle-treated (shown in black) and PFNA-treated (shown in red) (A) male and (B) female mice. (C) Graphical representation of CD19+ B cell percentage with respect to the whole splenocyte population. The cells were gated on those that were CD4−CD8−. The data are presented as mean ± SE. * denotes p<0.05 as compared to the vehicle control (CTL) for the same gender. † denotes p<0.05 as compared between genders for the same treatment group.
Fig. 7.
Increase in the percentage of CD14+ cells in spleen of male and female PFNA-treated mice. Unfractionated splenocytes were washed, incubated with fluorochrome-conjugated antibodies and analyzed by flow cytometry. The cells are gated on the CD4−CD8−CD19− population. A representative histogram of CD14+ cells is depicted from vehicle-treated (shown in black) and PFNA-treated (shown in red) (A) male and (B) female mice. (C) Graphical representation of CD14+ cell percentage with respect to the whole splenocyte population. The data are presented as mean ± SE. * denotes p<0.05 as compared to the vehicle control (CTL) for the same gender.
Effect of PFNA on TNFα response to LPS
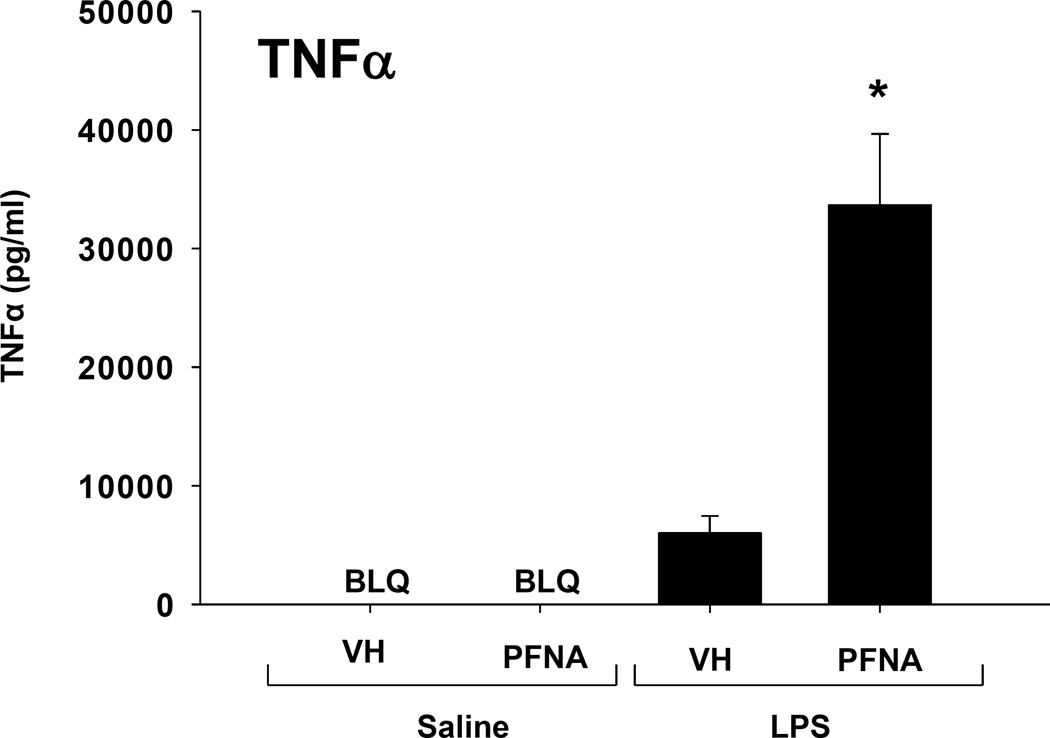
Despite a significant decrease in the proportion of CD14+ cells within the splenocyte population 2 weeks after PFNA administration, LPS induced a markedly increased TNFα response in PFNA-treated animals (Table 3). To determine whether the TNFα response remains increased 4 weeks after PFNA administration, mice were treated with LPS at this time point. As expected, LPS caused a marked increase in TNFα serum concentrations in vehicle-treated mice, however the TNFα response to LPS was markedly increased in the PFNA-treated animals (Fig. 8). The increase in TNFα response to LPS in the PFNA-treated animals was similar at 2 and 4 weeks after PFNA exposure, suggesting that little recovery occurred during this time.
Table 3.
Fold induction of TNF?-induced LPS in PFNA-treated mice as compared to control mice at 2 and 4 weeks.
Time of recovery after single PFNA administration
Fold induction of PFNA-treated group over vehicle control
Fig. 8.
Increase in LPS-induced serum TNFα in PFNA-treated male mice. Blood was collected from vehicle-treated (CTL) or PFNA-treated mice 90 min after they were injected with 1mg/kg LPS or saline, and serum TNFα concentrations were quantified by ELISA. The data are presented as mean ± SE. BLQ denotes samples that were below the level of detection of the assay. * denotes p<0.05 as compared to the vehicle (VH) control.
Discussion
The purpose of the current studies was to assess the effects of a single dose of PFNA (0.1 mmol/kg) on lymphoid organs, immune cell populations and LPS response 4 weeks after administration. We were particularly interested in determining whether there was an evident recovery from the immune effects that we had previously observed and reported at 2 weeks (Rockwell et al., 2013). In that regard, the present studies demonstrate a partial recovery from some of the effects of PFNA on the immune system. Specifically, we observed a partial recovery of spleen weight, but not in the ratios of splenic populations, and a partial recovery of specific thymic populations, but not in thymocyte viability. The partial recovery of the thymic populations was most evident in the CD4+/CD8+ double-positive population, which was abrogated at 2 weeks, but had partially returned by 4 weeks. The TNFα response to LPS was greatly exaggerated in PFNA-treated animals at both 2 and 4 weeks with no evident recovery in this functional parameter. Overall, these results suggest that full recovery of immune parameters from a single dose of PFNA (0.1 mmol/kg) requires greater than 4 weeks duration.
Concentrations of PFAS’s have been quantified in human serum in the U.S. and elsewhere by various governmental and non-governmental groups. By far, the best-characterized PFAS’s in this regard are PFOA and PFOS. In contrast, far less data are available with respect to human exposure to PFNA. Of the data currently available, PFNA is typically found in the low nanomolar range in the majority of the population (CDC, 2012; Kato et al., 2011; Wu et al., 2015). However, there is marked interindividual variation in serum concentrations of PFNA. Children and older adults typically have higher serum concentrations of PFNA than younger adults (Wu et al., 2015). For reasons that are not clear, boys often have higher serum concentrations of PFNA than girls (Kato et al., 2011). In addition, non-hispanic blacks have higher concentrations than non-hispanic whites and Mexican Americans (CDC, 2012). Presumably, markedly higher serum concentrations of PFNA occur in workers exposed in an occupational setting, but there is a lack of data to support or refute this assumption. The wide variation of serum concentrations of PFNA in humans is consistent with the variation in serum concentrations of perfluorinated compounds as a class. Much of this variation is likely to be due to differences in exposure. Indeed, whereas the serum concentrations of most PFAS’s are typically in the low ng/ml level in the general population, concentrations from 10 – 1000 ng/ml have been reported in individuals exposed to PFAS-contaminated water and through other environmental routes (Emmett et al., 2006; Vestergren and Cousins, 2009). Serum concentrations of PFAS’s have been reported from 1000 ng/ml to as high as 100,000 ng/ml in occupationally-exposed workers (Emmett et al., 2006; Olsen et al., 2000; Vestergren and Cousins, 2009). The concentration of PFNA used in the present study is relevant to high-dose occupational exposure and/or accidents.
Numerous studies have demonstrated sex differences in response to PFOA and PFOS, including several studies in humans. Our studies are the first to investigate sex differences in response to PFNA on immune parameters. Previous studies have shown that male B6C3F1 mice are more sensitive to PFOS than females with respect to decrease in splenic CD4+ T cells and impaired IgM production in response to sheep red blood cells, but these effects were not attributable to differences in serum concentration (DeWitt et al., 2009; Peden-Adams et al., 2008). In contrast, the present studies suggest that female C57Bl/6 mice are more sensitive than males to the effects of PFNA on the ratios of the immune cell populations. In spleen, females have a greater increase in T cell subpopulations and a more pronounced decrease in CD19+ cells (B cells) and CD14+ cells (phagocytes). Previously published studies on PFNA pharmacokinetics in mice do not suggest that the sex differences are due to pharmacokinetics because serum elimination of PFNA is actually slightly faster in female CD-1 mice compared to males, but distribution of PFNA in lymphoid organs and elimination of PFNA in C57Bl/6 mice is not yet known and thus, this cannot be eliminated as a possibility (Tatum-Gibbs et al., 2011). Although the differences between the observations of the present studies and previous studies suggest possible differences between the effects of PFNA and PFOS, they may also be due to differences in dose, duration of exposure, route of administration and mouse strain. Taken together, these studies strongly suggest there are gender differences in the effect of PFAS’s on the immune system. Thus, future studies may be aimed at determining the effect of sex hormones on the immunomodulatory effects of PFNA.
In addition to the current study, there have been other investigations of the recovery period of the immune system in response to PFAS’s. Yang et al. showed that the decrease in relative spleen weight and relative thymus weight after PFOA treatment recovered 5 and 10 days later, respectively (Yang et al., 2001). Although the ratios of thymic subpopulations recovered at the same rate as thymic weight, splenic subpopulations remained skewed even after splenic weight had recovered 5 d after exposure. The ratios of the splenic subpopulations had normalized to a large extent by 10 d after exposure, however. In a separate study, the same group showed that PFOA suppressed the production of IgM and IgG1, IgG2b and IgG3 in response to horse RBC. Whereas production of IgM had recovered 5 d after exposure but IgG1, IgG2b and IgG3 remained decreased (Yang et al., 2002). Another group showed that lymphoid organ weights and IgG antibody titers were largely restored to normal levels 15 and 20 days after exposure to PFOA ended (Dewitt et al., 2008).
In general, there was little recovery of the immune parameters measured in the current study 28 d after exposure to PFNA. However, some of the parameters such as relative spleen weight and the ratios of several of the thymic subpopulations, including the CD4 single-positive, CD8 single-positive and the CD4/CD8 double-positive populations exhibited partial recovery after 4 week exposure of PFNA. There was partial recovery of some of the parameters, however. These include relative spleen weight and the ratios of several of the thymic subpopulations, including the CD4 single-positive, CD8 single-positive and the CD4/CD8 double-positive populations. For males, the majority of the other endpoints did not change from to 2 to 4 wk after exposure, with the exception of the relative ratio of the splenic CD19+ population, which continued to decrease. Conversely, in females, numerous parameters actually worsened, including thymocyte viability, and the ratios of various lymphoid subpopulations, including CD4+, CD8+ and CD19+ cells in spleen and the CD4/CD8 double-negative population in the thymus. This may be due in part to milder effects of PFNA on many of these same parameters in female mice at 2 wk, compared to males, suggesting the effects may take longer to manifest in females. Interestingly, the relative ratio of CD14+ cells, which was decreased 2 wk after PFNA exposure, was markedly increased 4 wk after exposure in both genders, suggesting recovery of the phagocyte population may occur more rapidly than the lymphocyte populations. The difference in the kinetics of recovery in the current study compared to previous studies with PFOA may be due to multiple factors, including the difference in PFAS congeners, dosage, duration of exposure and/or the route of administration. Overall, the current studies suggest differential kinetics exist in the recovery of various immune parameters to PFNA.
A number of studies have reported that exposure to PFAS’s increased cytokine production in response to LPS. Specifically, PFOS (50 – 125 mg/kg) increases serum concentrations of TNFα, IL-1β and IL-6, both basally and in response to LPS in male C57Bl/6 mice (Dong et al., 2012). In another study, Qazi et al. showed that PFOA (0.02%) markedly increased serum concentrations of TNFα and IL-6 in response to LPS, but observed no induction with PFOS (0.02%) in male C57Bl/6 mice (Qazi et al., 2009). Thus, the increase in LPS-induced serum TNFα by PFNA observed in the current study is consistent with some previous studies of PFOA and PFOS. Conversely, another group showed no increase in serum concentrations of LPS-induced TNFα or IL-6 by PFOS (0.03 – 10 mg/kg/day) in female B6C3F1 mice (Mollenhauer et al., 2011). Collectively, these studies suggest that numerous factors may influence the effects of PFAS’s on induction of pro-inflammatory cytokines by LPS, including dose, route of administration, duration, strain and gender.
Overall, the present study demonstrates that a single dose of PFNA (0.1 mmol/kg) decreases thymocyte viability, alters the ratios of various leukocyte populations in spleen and thymus and markedly increases the TNFα response to LPS in vivo. Further, this study shows that these effects continue to occur as long as 28 days after exposure with little evidence of recovery during this time period.
Acknowledgments
Funding
This work was supported by the National Institutes of Health grants: [R01 ES024966 and R00 ES018885 to C.E.R], [T32 ES007255 fellowship to A.E.T.] and [R01 ES013714 and R01 ES025708 to C.D.K.]. The funding sources played no role in the study design, sample collection, data analysis and/or interpretation, writing or in the decision to submit this manuscript for publication.
The authors would like to acknowledge Dr. Joyce Slusser and Michael Stewart for technical assistance with flow cytometry analyses, the members of the Klaassen lab for constructive feedback and technical support, Dr. Bryan Copple for use of instrumentation and reagents and Cynthia Rockwell for her assistance with photography of lymphoid organs.
Abbreviations used
- PFAS
Perfluoroalkyl substances
- PFNA
Perfluorononanoic acid
- PFOA
Perfluorooctanoic acid
- PFOS
Perfluorooctane sulfonate
References
- Apelberg BJ, Witter FR, Herbstman JB, Calafat AM, Halden RU, Needham LL, Goldman LR. Cord serum concentrations of perfluorooctane sulfonate (PFOS) and perfluorooctanoate (PFOA) in relation to weight and size at birth. Environ Health Perspect. 2007;115(11):1670–1676. doi: 10.1289/ehp.10334. [DOI] [PMC free article] [PubMed] [Google Scholar]
- ATSDR. Draft Toxicological Profile for Perfluoroalkyls. 2009 [PubMed] [Google Scholar]
- Calafat AM, Wong LY, Kuklenyik Z, Reidy JA, Needham LL. Polyfluoroalkyl chemicals in the U.S. population: data from the National Health and Nutrition Examination Survey (NHANES) 2003–2004 and comparisons with NHANES 1999–2000. Environ Health Perspect. 2007;115(11):1596–1602. doi: 10.1289/ehp.10598. [DOI] [PMC free article] [PubMed] [Google Scholar]
- CDC. The Fourth National Report on Human Exposure to Environmental Chemicals. National Report on Human Exposure to Environmental Chemicals. 2009 [PubMed] [Google Scholar]
- CDC. The Fourth National Report on Human Exposure to Environmental Chemicals, Updated Tables, February 2012. National Report on Human Exposure to Environmental Chemicals. 2012 [Google Scholar]
- Dewitt JC, Copeland CB, Strynar MJ, Luebke RW. Perfluorooctanoic acid-induced immunomodulation in adult C57BL/6J or C57BL/6N female mice. Environ Health Perspect. 2008;116(5):644–650. doi: 10.1289/ehp.10896. [DOI] [PMC free article] [PubMed] [Google Scholar]
- DeWitt JC, Shnyra A, Badr MZ, Loveless SE, Hoban D, Frame SR, Cunard R, Anderson SE, Meade BJ, Peden-Adams MM, et al. Immunotoxicity of perfluorooctanoic acid and perfluorooctane sulfonate and the role of peroxisome proliferator-activated receptor alpha. Crit Rev Toxicol. 2009;39(1):76–94. doi: 10.1080/10408440802209804. [DOI] [PubMed] [Google Scholar]
- Dong GH, Zhang YH, Zheng L, Liang ZF, Jin YH, He QC. Subchronic effects of perfluorooctanesulfonate exposure on inflammation in adult male C57BL/6 mice. Environ Toxicol. 2012;27(5):285–296. doi: 10.1002/tox.20642. 10.1002/tox.20642. [DOI] [PubMed] [Google Scholar]
- Emmett EA, Zhang H, Shofer FS, Freeman D, Rodway NV, Desai C, Shaw LM. Community exposure to perfluorooctanoate: relationships between serum levels and certain health parameters. J Occup Environ Med. 2006;48(8):771–779. doi: 10.1097/01.jom.0000233380.13087.37. 10.1097/01.jom.0000233380.13087.37. [DOI] [PMC free article] [PubMed] [Google Scholar]
- Fang X, Zhang L, Feng Y, Zhao Y, Dai J. Immunotoxic effects of perfluorononanoic acid on BALB/c mice. Toxicol Sci. 2008;105(2):312–321. doi: 10.1093/toxsci/kfn127. [DOI] [PubMed] [Google Scholar]
- Fang X, Gao G, Xue H, Zhang X, Wang H. Exposure of perfluorononanoic acid suppresses the hepatic insulin signal pathway and increases serum glucose in rats. Toxicology. 2012;294(2–3):109–115. doi: 10.1016/j.tox.2012.02.008. 10.1016/j.tox.2012.02.008. [DOI] [PubMed] [Google Scholar]
- Kato K, Wong LY, Jia LT, Kuklenyik Z, Calafat AM. Trends in exposure to polyfluoroalkyl chemicals in the U.S. Population: 1999–2008. Environ Sci Technol. 2011;45(19):8037–8045. doi: 10.1021/es1043613. 10.1021/es1043613. [DOI] [PubMed] [Google Scholar]
- Kudo N, Suzuki-Nakajima E, Mitsumoto A, Kawashima Y. Responses of the liver to perfluorinated fatty acids with different carbon chain length in male and female mice:in relation to induction of hepatomegaly, peroxisomal beta-oxidation and microsomal 1-acylglycerophosphocholine acyltransferase. Biol Pharm Bull. 2006;29(9):1952–1957. doi: 10.1248/bpb.29.1952. [DOI] [PubMed] [Google Scholar]
- Mollenhauer MA, Bradshaw SG, Fair PA, McGuinn WD, Peden-Adams MM. Effects of perfluorooctane sulfonate (PFOS) exposure on markers of inflammation in female B6C3F1 mice. J Environ Sci Health A Tox Hazard Subst Environ Eng. 2011;46(2):97–108. doi: 10.1080/10934529.2011.532418. 10.1080/10934529.2011.532418. [DOI] [PubMed] [Google Scholar]
- Olsen GW, Burris JM, Burlew MM, Mandel JH. Plasma cholecystokinin and hepatic enzymes, cholesterol and lipoproteins in ammonium perfluorooctanoate production workers. Drug Chem Toxicol. 2000;23(4):603–620. doi: 10.1081/dct-100101973. 10.1081/DCT-100101973. [DOI] [PubMed] [Google Scholar]
- Peden-Adams MM, Keller JM, Eudaly JG, Berger J, Gilkeson GS, Keil DE. Suppression of humoral immunity in mice following exposure to perfluorooctane sulfonate. Toxicol Sci. 2008;104(1):144–154. doi: 10.1093/toxsci/kfn059. [DOI] [PubMed] [Google Scholar]
- Prevedouros K, Cousins IT, Buck RC, Korzeniowski SH. Sources, fate and transport of perfluorocarboxylates. Environ Sci Technol. 2006;40(1):32–44. doi: 10.1021/es0512475. [DOI] [PubMed] [Google Scholar]
- Qazi MR, Bogdanska J, Butenhoff JL, Nelson BD, DePierre JW, Abedi-Valugerdi M. High-dose, short-term exposure of mice to perfluorooctanesulfonate (PFOS) or perfluorooctanoate (PFOA) affects the number of circulating neutrophils differently, but enhances the inflammatory responses of macrophages to lipopolysaccharide (LPS) in a similar fashion. Toxicology. 2009;262(3):207–214. doi: 10.1016/j.tox.2009.06.010. 10.1016/j.tox.2009.06.010. [DOI] [PubMed] [Google Scholar]
- Rockwell CE, Turley AE, Cheng XG, Fields PE, Klaassen CD. Acute immunotoxic effects of perfluorononanoic acid (PFNA) in C57Bl/6 mice. Clinical and Experimental Pharmacology. 2013;S4 doi: 10.4172/2161-1459.S4-002. 10.4172/2161-1459.S4-002. [DOI] [PMC free article] [PubMed] [Google Scholar]
- Tatum-Gibbs K, Wambaugh JF, Das KP, Zehr RD, Strynar MJ, Lindstrom AB, Delinsky A, Lau C. Comparative pharmacokinetics of perfluorononanoic acid in rat and mouse. Toxicology. 2011;281(1–3):48–55. doi: 10.1016/j.tox.2011.01.003. [DOI] [PubMed] [Google Scholar]
- Vestergren R, Cousins IT. Tracking the pathways of human exposure to perfluorocarboxylates. Environ Sci Technol. 2009;43(15):5565–5575. doi: 10.1021/es900228k. [DOI] [PubMed] [Google Scholar]
- Wolf CJ, Zehr RD, Schmid JE, Lau C, Abbott BD. Developmental effects of perfluorononanoic Acid in the mouse are dependent on peroxisome proliferator-activated receptor-alpha. PPAR Res. 2010;2010:282896. doi: 10.1155/2010/282896. [DOI] [PMC free article] [PubMed] [Google Scholar]
- Wu XM, Bennett DH, Calafat AM, Kato K, Strynar M, Andersen E, Moran RE, Tancredi DJ, Tulve NS, Hertz-Picciotto I. Serum concentrations of perfluorinated compounds (PFC) among selected populations of children and adults in California. Environ Res. 2015;136:264–273. doi: 10.1016/j.envres.2014.09.026. 10.1016/j.envres.2014.09.026. [DOI] [PMC free article] [PubMed] [Google Scholar]
- Yang Q, Xie Y, Eriksson AM, Nelson BD, DePierre JW. Further evidence for the involvement of inhibition of cell proliferation and development in thymic and splenic atrophy induced by the peroxisome proliferator perfluoroctanoic acid in mice. Biochem Pharmacol. 2001;62(8):1133–1140. doi: 10.1016/s0006-2952(01)00752-3. [DOI] [PubMed] [Google Scholar]
- Yang Q, Abedi-Valugerdi M, Xie Y, Zhao XY, Moller G, Nelson BD, DePierre JW. Potent suppression of the adaptive immune response in mice upon dietary exposure to the potent peroxisome proliferator, perfluorooctanoic acid. Int Immunopharmacol. 2002;2(2–3):389–397. doi: 10.1016/s1567-5769(01)00164-3. [DOI] [PubMed] [Google Scholar]


