

Abstract
While the death of motor neuron is a pathological hallmark of amyotrophic lateral sclerosis (ALS), defects in other cell types or organs may also actively contribute to ALS disease progression. ALS patients experience progressive skeletal muscle wasting that may not only exacerbate neuronal degeneration, but likely has a significant impact on bone function. In our previous published study, we have discovered severe bone loss in an ALS mouse model with overexpression of ALS-associated mutation SOD1G93A (G93A). Here we further provide a mechanistic understanding of the bone loss in ALS animal and cellular models. Combining mitochondrial fluorescent indicators and confocal live cell imaging, we discovered abnormalities in mitochondrial network and dynamics in primary osteocytes derived from the same ALS mouse model G93A. Those mitochondrial defects occur in ALS mice after the onset of neuromuscular symptoms, indicating that mitochondria in bone cells respond to muscle atrophy during ALS disease progression. To examine whether ALS mutation has a direct contribution to mitochondrial dysfunction independent of muscle atrophy, we evaluated mitochondrial morphology and motility in cultured osteocytes (MLO-Y4) with overexpression of mitochondrial targeted SOD1G93A. Compared with osteocytes overexpressing the wild type SOD1 as a control, the SOD1G93A osteocytes showed similar defects in mitochondrial network and dynamic as that of the primary osteocytes derived from the ALS mouse model. In addition, we further discovered that overexpression of SOD1G93A enhanced the expression level of Dynamin-related protein 1 (Drp1), a key protein promoting mitochondrial fission activity, and reduced the expression level of optic atrophy protein 1 (OPA1), a key protein related to mitochondrial fusion. A specific mitochondrial fission inhibitor (Mdivi-1) partially reversed the effect of SOD1G93A on mitochondrial network and dynamics, indicating that SOD1G93A likely promotes mitochondrial fission, but suppresses the fusion activity. Our data provide the first evidence that mitochondria show abnormality in osteocytes derived from an ALS mouse model. The accumulation of mutant SOD1G93A protein inside mitochondria directly causes dysfunction in mitochondrial dynamics in cultured MLO-Y4 osteocytes. In addition, the ALS mutation SOD1G93A-mediated dysfunction in mitochondrial dynamics is associated with an enhanced apoptosis in osteocytes, which could be a potential mechanism underlying the bone loss during ALS progression.
Keywords: Osteocytes, mitochondria, mitochondrial dynamics, amyotrophic lateral sclerosis (ALS)
1. Introduction
ALS is a devastating neuromuscular disease characterized by death of motor neurons (MN) and muscle atrophy. Currently, there is no effective treatment. 95% of ALS patients die within 5 years after disease onset [1]. Most ALS cases are sporadic (SALS), with about 10% being familial (FALS). While multiple factors could contribute to SALS, both SALS and FALS manifest similar pathological and clinical phenotypes of neuromuscular degeneration[2], indicating a common downstream pathological mechanism underlying the disease progression. Despite intensive research, the pathogenic mechanism underlying progressive neuromuscular degeneration in ALS remains largely obscure. Thus, there is an urgent need to further understand the pathogenic mechanism in order to develop novel interventions to alleviate the disease progression and to improve the quality of life for ALS patients.
Although the death of the motor neuron is a pathological hallmark of ALS, defects in other cell types or organs may also actively contribute to ALS disease progression [3-10]. For example, skeletal muscle comprises around 40% of whole-body lean mass of a human and is essential for maintaining the homeostasis of the whole-body metabolism [11]. Skeletal muscle is substantially affected in ALS with severely progressive muscle wasting during the disease progression. Studies from ours [5, 8, 9] and other research groups [4, 6] support muscle as a primary target of ALS, in addition to being a victim of motor axonal withdrawal. It is likely that skeletal muscle experiences double pathological insults, both intrinsic (muscle origin) and extrinsic (denervation), leading to severe atrophy in a short period of time during the rapid progression of ALS. This severe muscle degeneration in ALS may not only exacerbate neuronal degeneration, but likely has a significant impact on bone function.
Bone is a metabolically active organ and constantly undergoes remodeling. Bone remodeling maintains not only the structural integrity of the skeleton but also the homeostasis of the whole body [12]. There is a lifelong interaction between skeletal muscle and bone [13-19]. Skeletal muscle acts as an important source of osteogenic growth factors [20], thus providing important anabolic stimuli for bone remodeling and homeostasis [21-28]. Most importantly, the shape of bones is constantly regulated by muscle force, and the muscle-induced mechanical load regulates key aspects of bone morphogenesis [19, 26, 27, 29, 30]. In the case of ALS, the severe muscle wasting could lead to rapidly reduced mechanical load on skeleton and potentially lead to impairment of bone morphology and function along the disease progression. Indeed, it has been shown that the development of osteopenia and impaired bone integrity in ALS patients [31], and the incidence of fractures was found to be high in ALS patients [32]. Since bone is an important organ that produces muscle trophic factors, impaired bone homeostasis could exacerbate muscle degeneration and accelerate disease progression in ALS. Bone produces various trophic factors including VEGF, FGF-2, BMPs and IGF-1 that are critical for maintaining the homeostasis of muscles and neurons [33, 34]. Interestingly, mesenchymal stem cells from the bone marrow of ALS patients have diminished stem cell capacity and produced fewer trophic factors, and those defects correlate with disease progression [35, 36]. In addition, intraspinal infusion of autologous bone marrow mononuclear cells prevents spinal motor neuron degeneration in ALS patients [37]. Together, those studies suggest a possible interaction between muscle and bone during disease progression in ALS patients.
To understand the potential interaction between muscle and bone in ALS, our previous work has systematically explored whether bone homeostasis is impaired during ALS disease progression in a mouse model (G93A) with overexpression of ALS mutation SOD1G93A. We have found that G93A mice with muscle atrophy have reduced trabecular and cortical bone mass [10]. The reduced bone density in G93A mice is associated with impaired function of osteoblasts, along with striking acceleration of osteoclast formation in bone [10]. While, our previous observations suggest that reduced muscle loading may be a key cause of osteopenia in the ALS mouse model, it is not known if ALS-associated mutation also plays a role in changing the function of bone cells. The current study tested whether ALS-associated mutation has a direct effect on osteocytes by focusing on mitochondrial function.
Abnormal mitochondrial morphology was noted in neurons of sporadic or familial ALS patients [38]. Mitochondria are not only essential for energy supply of the cell but also determine the survival or death of the cell. The role of mitochondria in bone pathophysiology has never been studied in ALS. Mitochondria are morphologically highly dynamic organelles that are constantly remolded by fusion and fission processes [39-41]. This phenomenon, known as mitochondrial dynamics, defines normal mitochondrial morphology and distribution, cell bioenergetics and cell death [41]. Abnormal mitochondrial dynamics is implicated in various neurodegenerative disorders [39, 42, 43]. Changes in mitochondrial dynamics are an early indication of mitochondrial dysfunction. Published studies have shown that abnormal mitochondrial dynamics contribute to the degeneration of cultured motor neurons with overexpression of ALS-causing mutations [44, 45]. In our previous study, we also observed that skeletal muscle cells showed reduced mitochondrial dynamics before ALS disease onset in an ALS mouse model (G93A), and the ALS-causing mutation SOD1G93A could directly lead to abnormal mitochondrial dynamics in muscle cells of normal mice [5]. In the current study, we examined whether primary bone cells (osteocytes) derived from an ALS mouse model show defects in mitochondrial dynamics before and after ALS disease onset. In addition, we examined whether the ALS-causing mutation SOD1G93A could directly change mitochondrial function in osteocytes independent of muscle atrophy.
2. Materials and Methods
2.1 Animals
The ALS mouse model G93A with overexpression of ALS-causing mutation SOD1G93A [46] and the age-matched wild-type (WT) mice were used in the current study. All experiments were carried out in strict accordance with recommendations in the Guide for the Care and Use of Laboratory Animals of the National Institutes of Health. Protocols on usage of mice were approved by the Institutional Animal Care and Use Committee of University of Missouri at Kansas City and Kansas City University of Medicine and Bioscience.
2.2 Reagents
Tissue culture medium and fetal bovine serum (FBS) were purchased from Thermo Fisher Scientific. MitoTracker Deep Red FM was purchased from Invitrogen. Antibodies of E11/GP38 and Mfn1 were purchased from Santa Cruz, the rest of the antibodies were purchased from Cell Signaling Technology. Mdivi-1 was purchased from Sigma. All other chemicals were of analytical grade.
2.3 Isolation and culture of primary osteocytes
Primary osteocytes were isolated and cultured from long bones (femora) of mice following an established protocol of Stern et al [47]. Briefly, the femora were aseptically dissected from 4-month or 2-month-old mice, and extensively washed with PBS following the removal of the surrounding soft tissue and periosteum. After the bone marrow was flushed out with PBS, the bone was cut into small pieces with diameter around 0.5∼1mm. The bone pieces were first incubated in collagenase solution (1mg/mL, sigma #C0130) at 37°C for 25 min, and then washed in PBS. This step was repeated one more time. The bone pieces were incubated with EDTA (tetrasodium salt dehydrate) solution (5 mM, pH 7.4) at 37°C for another 25 min, and then washed in PBS. Lastly, the bone pieces were incubated with collagenase solution at 37°C for 25 min and then washed in PBS. The EDTA solution was prepared in magnesium and calcium-free phosphate-buffered solution with 1% BSA.
These bone pieces were plated on gelatin-coated petri dish at a seeding density of 10∼20 pieces/dish in the α-minimal essential medium (α-MEM, Thermo Fisher Scientific) supplemented with 5% fetal bovine serum (FBS, Thermo Fisher Scientific), 5% calf serum (CS, Thermo Fisher Scientific), 1% penicillin and streptomycin (PS, Thermo Fisher Scientific). The cultures were maintained at 37°C and 5% CO2 in a humidified incubator. The culture medium was half-changed in 72 hours, and was completely changed on the day 5 of post culture.
2.4 MLO-Y4 cell culture and transfection
The murine long bone-derived osteocyte cell line MLO-Y4 [48] (a gift from Dr. Lynda Bonewald, Indiana University) were cultured in α-MEM supplemented with 2.5% fetal bovine serum and 2.5% calf serum at 37°C, 5% CO2 in a humidified incubator. Cells were seeded at a density of 1.5×10⁵/dish in gelatin-coated petri dish. 2.5 μg pcDNA3/mt-SOD1-GFP or pcDNA3/mt-SOD1G93A-GFP plasmids were applied to cultured cells for transfection using Lipofectamine 3000 transfection reagent (Thermo Fisher Scientific) following the manufacturer's protocol with a DNA to Lipofectamine ratio of 1:2.5w/v. A transfection enhancer, the P3000 enhancer reagent (1:2, DNA: Reagent, w/v) was used along with the Lipofectamine 3000 transfection reagent for all transfections. Cells were used for experiments in 48∼72 hours after the transfection.
2.5 pcDNA3/mt-SOD1-GFP and pcDNA3/mt-SOD1G93A-GFP plasmid construction
The cDNAs of SOD1 and SOD1G93A were PCR amplified from pBluescript-SOD1 and pBluescript-SOD1G93A (gifts from Dr. Han-Xiang Deng, Northwestern University). The cDNAs of SOD1-GFP and SOD1G93A-GFP were previously constructed [5]. The “mt” refers to the mitochondrial targeting sequence derived from the subunit VIII of human cytochrome c oxidase [49], which was amplified from pCMV/myc/mito (invitrogen) and subsequently fused at the 5′ end of SOD1-GFP and SOD1G93A-GFP constructs. All final plasmid constructs were confirmed by sequencing.
2.6 Immunofluorescence assay
The cells isolated from bone particles on the day 7 post-isolation, or cultured MLO-Y4 cells were fixed with 4% paraformaldehyde (PFA) for 10 min, then washed with PBS for 3 times. The cells were permeabilized in 0.1% triton x-100 for 10 min. The cells were incubated in 10% normal goat serum (Thermo Fisher Scientific #50062Z) for 1 h at room temperature for reducing nonspecific antibody binding, and then incubated overnight at 4°C with primary antibody E11/GP38 (Santa Cruz, sc-166906), followed by an incubation with the secondary fluorescence-conjugated antibody (anti-mouse IgG Alexa Fluor 594 conjugate, CST #8889). Finally, the cells were washed with PBS, and counter-stained with 4′6′-diamidio-2-phenoylindole (DAPI, Thermo Fisher Scientific). Fluorescence images were collected using a confocal microscope (Leica SP8 confocal microscope system).
2.7 Fluorescent dye loading and confocal microscopic live cell imaging
Leica SP8 confocal microscopy was used for the live cell imaging recording. Primary osteocytes were incubated with 200 nM MitoTracker Deep Red FM for 30 min at 37°C for visualization of mitochondrial morphology and motility. MitoTracker Deep Red FM was excited at 633 nm and its emitted fluorescence was collected at 640-690 nm. Mitochondrial morphology and motility of MLO-Y4 cells were measured in live cells with overexpression of pcDNA3/mt-SOD1-GFP or pcDNA3/mt-SOD1G93A-GFP. GFP was excited at 488 nm and its emitted fluorescence was collected at 490-540 nm.
2.8 Immunoblotting analysis
The protein was extracted from cultured MLO-Y4 cells using a protein lysis buffer. Protein samples were resolved using SDS-polyacrylamide gel electrophoresis (SDS-PAGE; 150 V, 90 min). Protein bands were electro-transferred to nitrocellulose membranes (15 V, 35 min). Membranes were blocked in TBS with 0.1% Tween 20 and 5% milk for 1 h. The primary antibodies used are GAPDH (1:4000, 37 kDa, CST, #5174), Drp1(1:1000, 78∼82 kDa, CST, #8570), p-Drp1(ser 637, corresponding to murine p-Drp1 at Ser 600, [50]) (1:1000, 78∼82 kDa, CST, #4867), OPA1(1:1000, 80∼100 kDa, CST, #80471), Mfn1(1:1000, 86 kDa, Santa Cruz, #50330) and Mfn2(1:1000, 80 kDa, CST, #9482). The primary antibodies were diluted in 5% BSA-TBST-0.05% NaN3. Membranes were incubated with the primary antibody overnight at 4°C. Subsequently, washed three times in TBST buffer, and then detected by horseradish peroxidase-conjugated secondary antibodies at room temperature for 2 h. Results were visualized with ECL reagents (Bio-rad). Densitometry evaluation was conducted using ImageJ software (NIH, Bethesda, MD).
2.9 Data analysis
ImageJ software (NIH, Bethesda, MD) was used for imaging processing. SigmaPlot 13.0 and Microsoft Excel were used for data analysis. Data are presented as mean ± S.E.M. Statistical significance was determined by Student's t test.
3. Results
3.1 Primary osteocytes derived from G93A mice show abnormal mitochondrial network
Osteocytes are major bone cells that play a crucial role in maintaining the integrity of the bone tissue[51]. Our previously studies on morphologic and biochemical properties of the bone derived from an ALS mouse model (G93A) have shown substantial loss of the bone mass after the ALS disease onset with skeletal muscle atrophy [10]. Because mitochondria play a critical role in cell function, in the current study we examined whether there are structural and functional abnormalities of mitochondria in live osteocytes derived from G93A mice, which may be associated with the bone loss in ALS.
We first cultured primary osteocytes from the femurs of G93A and wild type (WT) mice following the established procedure [47]. As shown in Fig 1A, after 7 days in culture medium, cells grew from the edge of the bone particles. As E11/gp38 is a marker for early osteocytes [51], the anti-E11/GP38 antibody was used as an osteocyte marker to confirm whether there were osteocyte-like cells among the primary cells derived from the bone particles [47]. Osteocyte cell line MLO-Y4 was used as a positive control. As shown in Fig 1B, MLO-Y4 cells are positive for E11/GP38 expression following the immunostaining with the antibody. The majority of the primary cells from the bone particle outgrowth was positive for the anti-E11/GP38 antibody and revealed similar size and morphology of MLO-Y4 osteocytes.
Figure 1. Primary osteocytes derived from an ALS mouse model G93A.
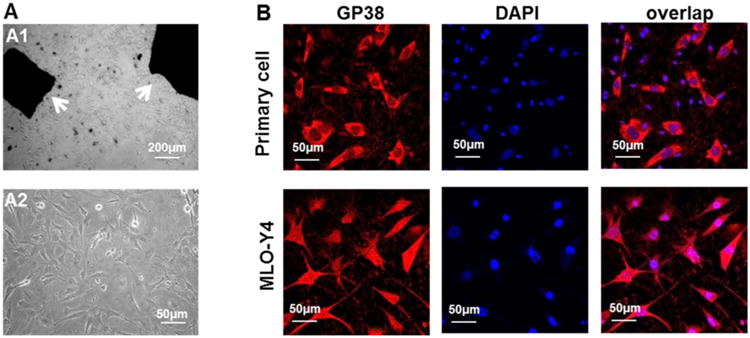
(A1) Small bone pieces (white arrows) derived from a mouse were placed in the culture medium. (A2) Cells grew out of the bone pieces 7 days in the culture. (B) Most of the cells grew out of the bone particls were positive for E11/GP38 expression, indicating that majority of the cells are osteocytes. MLO-Y4 osteocytes were used as a positive control for the E11/GP38 antibody staining. DAPI (blue) was utilized to identify cell nuclei.
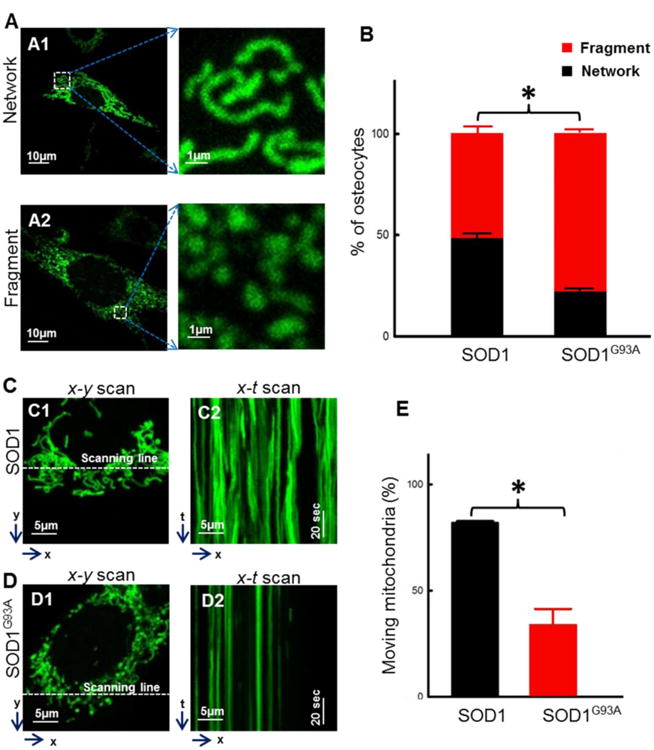
Mitochondrial morphology was first compared between WT and G93A osteocytes derived from mice at the age of 4-month old (after ALS disease onset). The primary cultured cells were labeled with MitoTracker Deep Red for visualization of mitochondria in a live cell imaging under a confocal microscope. In order to quantify the morphologic difference of mitochondria, the primary osteocytes were categorized in two types: the network type (Fig 2A1) and the fragment type (Fig 2A2). The network type of osteocytes was defined when more than 50% of mitochondria in a single cell show that the ratio of the length over the diameter of a single mitochondrion is more than 20. The fragment type of osteocytes was defined when more than 50% of mitochondria in a single cell show that the ratio of the length over the diameter of a single mitochondrion is less than 20. After 7 days in culture, the population of primary osteocytes with different mitochondrial morphology was quantified (Fig 2B). Compared with WT cells, G93A cells showed a significantly reduced population in the network type (G93A: 20.3% ± 3.0% vs WT: 44.1% ± 2.3%, n=30∼50, P<0.01) and a significantly increased population in the fragmented type (G93A: 79.7% ± 3.0% vs WT: 55.9% ± 2.3%, n=30∼50, P<0.01). Mitochondrial morphology was also compared between WT and G93A osteocytes derived from the WT and G93A mice at the age of 2-month old (before ALS disease onset). As shown in Fig 2B, there are no detectable changes in mitochondrial morphology between G93A and WT cells (G93A: 59.8% ± 1.3% vs WT: 66.7% ± 2.2%, n=50∼57, P >0.05).
Figure 2. Primary osteocytes derived from G93A mice show altered mitochondrial morphology.
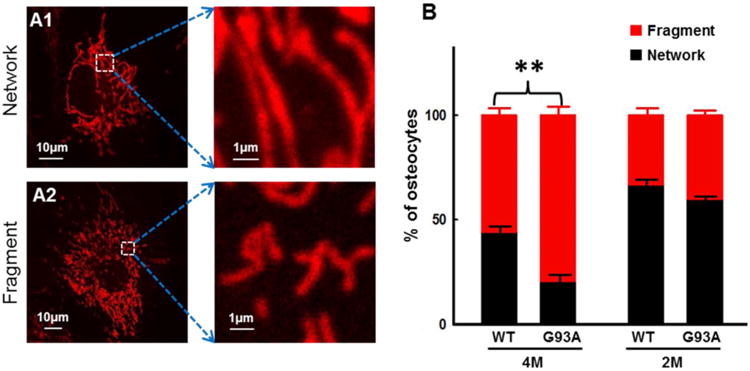
Primary osteocytes were labeled with MitoTracker Deep Red for visualization of mitochondria in a live cell under a confocal microscope. (A1/A2) Representative images of osteocytes with network-type mitochondria (network) and fragmented-type mitochondria (fragment). (B) Population of the primary osteocytes with different types of mitochondria morphology was summarized. 4M: 4-month-old and 2M: 2-month-old mice. The percentage was calculated in 7 days post-isolation (n=30-50 cells, 3 mice/group, **P<0.01).
3.2 Primary osteocytes derived from G93A mice show abnormal mitochondrial dynamics
Mitochondria are dynamic organelles that constantly undergo fusion and fission to maintain their normal functionality. The observed morphological changes with increased fragmented mitochondria in primary G93A osteocytes suggest a potential dysfunction in mitochondrial fission and/or fusion activities. Our previously study has found that impaired mitochondrial dynamics in skeletal muscle cells derived from ALS G93A mice is associated with muscle degeneration during ALS progression [5]. Here we tested whether primary osteocytes derived from G93A mice show similar defects in mitochondrial dynamics.
The primary bone cells were loaded with MitoTracker Deep Red to label mitochondria. Using live cell confocal imaging, the dynamic movement of mitochondria in the primary osteocytes was recorded in a time lapse 2D x-y mode imaging (20 sec/image, total 5 min). As demonstrated in the supplementary movie files (2D movie-WT), the movement of mitochondria in the osteocyte derived from a 4-month old WT mouse could be clearly resolved, while mitochondria in the osteocyte derived from a 4-month old G93A mice showed limited motility (2D movie-G93A). In Fig 3, to visualize mitochondrial dynamics in x-y images, we selected two images from a 2D time lapse serie, the first image at 0 sec (with a pseudo color of red) and the fourth image at 60 sec (with a pseudo color of green). Then, the 0 sec-and 60 sec-images were superimposed to form the “overlay” image. In the overlay image, the yellow color presents a completely overlay of red and green colors, thus indicates no mitochondrial movement, such as the overlay image of a G93A osteocyte in Fig 3B. The red and green colors in the overlay image presents “no overlay” of mitochondria between those two images, which indicates that mitochondria moved during this 60 sec recording period as illustrated in the overlay image of the WT osteocytes in Fig 3A (white arrows).
Figure 3. Primary osteocytes derived from G93A mice show abnormal mitochondrial dynamics.
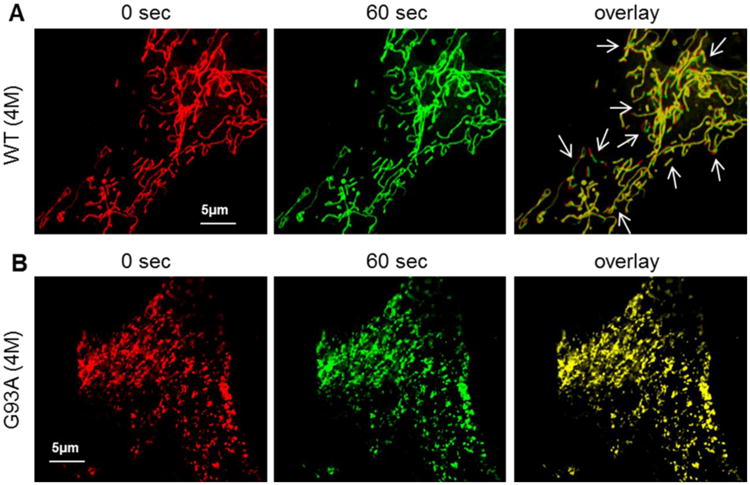
Primary osteocytes were labeled with MitoTracker Deep Red for the live cell imaging. The 2D x-y time lapse movies files were recorded (also see the supplemental data). The first (0 sec, red) and the fourth (60 sec, green) images were selected. The overlay of the image at 0 sec with the image at 60 sec provides a visualization of mitochondrial dynamics. (A) The representative images of an osteocyte derived from a WT mouse. (B) The representative images of an osteocyte derived from a G93A mouse. In the overlay images, non-moved mitochondria in this 60 sec recording time period are marked by yellow color (completely overlap), while moved mitochondria are indicated by the red and green colors (no overlap). Note that there is almost no detectable mitochondrial movement in the G93A cell in 60 sec, while there are multiple mitochondrial movements detected in the WT cell (white arrows in A).
While the 2D x-y mode time lapse and the overlays of images at different collecting time points clearly revealed a reduced mitochondrial motility in the G93A primary osteocyte, the x-t mode line scan imaging allowed a quantitative evaluation of mitochondrial dynamics. As illustrated in representative images of Fig 4A,4B and 4C, the x-y scan mode images were collected to distinguish individual mitochondria in a subcellular region of a WT cell (Fig 4A1), a G93A cell derived from a 4-month old G93A mouse (Fig 4B1) and a G93A cell derived from a 2-month old G93A mouse (Fig 4C1). The line scan x-t mode imaging was conducted to follow up the motility of individual mitochondria in a live osteocyte during a certain time period. During the line scan x-t mode imaging, the fluorescence intensity value was collected along a fixed x line (indicated by the white dashed line in Fig 4A1, 4B1 and 4C1) in every 10 milliseconds/line for a total scan duration of 102 seconds, and then the fluorescence intensity value along the x line were recorded sequentially, forming x-t images (Fig 4A2, 4B2 and 4C2). The changes of fluorescence intensity at certain x positions indicate that either mitochondria move into those positions (with enhanced fluorescence intensity) or move out of those positions (with reduced fluorescence intensity). Thus, mitochondrial motility can be quantified by calculating the percentage of mitochondria in a single cell that moved during those 102 seconds of recording time (Fig 4D). Clearly, compared to WT primary osteocytes, the numbers of moving mitochondria in primary osteocytes derived from 4-month old G93A mice are significantly reduced. The percentage of moving mitochondria in a single cell is 36.17% ± 9.5% for G93A (4M old) vs 69.4% ± 8.2% for WT (4 M old) (n=17∼22 cells, P<0.05; total 308 mitochondria evaluated for G93A cells and 251 for WT cells). In addition, there are no significant changes observed in primary osteocytes derived from 2-month old G93A mice compared with WT mice at the same age (G93A-2M: 76.4% ± 3.8% vs WT-2M: 83.1%.40 ± 4.1%, n=21cells, P>0.05; total 400 mitochondria evaluated for G93A cells and 363 for WT cells). The data indicate that primary osteocytes derived from G93A mice have reduced mitochondrial motility after ALS disease onset.
Figure 4. Quantification of mitochondrial motility of primary osteocytes derived from G93A and WT mice.
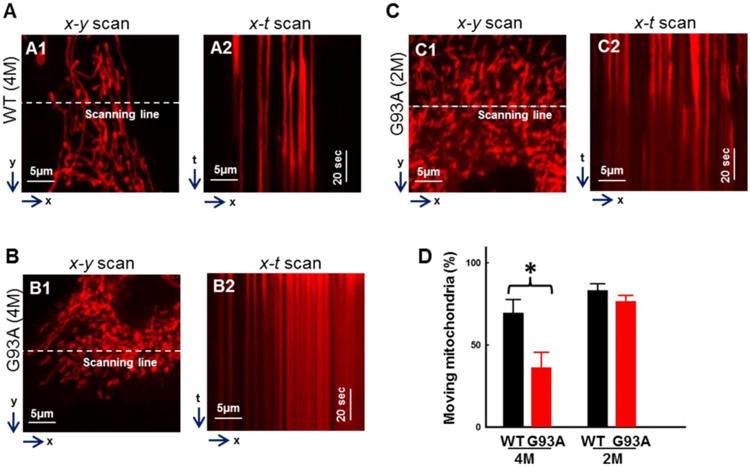
Primary osteocytes were labeled with MitoTracker Deep Red for the live cell imaging. The x-y scan images were collected to distinguish individual mitochondria in a subcellular region of a WT (A1), a G93A cell from a 4-month old G93A mouse (B1) and a G93A cell from a 2-month old G93A mouse (C1). The x-t line scan imaging was then conducted to follow up the motility of individual mitochondria along the scan line (the white dashed line indicated in A1, B1 and C1) (A2, B2, C2). The motility of mitochondria was quantified by calculating the percentage of mitochondria in a single cell that moved during the recording time (D). n=17-22, *P<0.05
3.3 Overexpression of ALS mutation SOD1G93A in MLO-Y4 osteocytes directly altered mitochondrial morphology and motility
The altered mitochondrial structure and function were only detected in osteocytes derived from 4-month old G93A mice. It suggests this phenomenon may be only a response of osteocytes to muscle atrophy at the later stage of ALS disease. However, it is not known whether ALS mutation directly contribute to this mitochondrial defects in osteocytes independent of muscle atrophy. To test this hypothesis, we overexpressed mitochondria-targeted SOD1G93A (mt-SOD1G93A-GFP) fusion protein in cultured MLO-Y4 osteocytes. The wild type SOD1 (mt-SOD1-GFP) fusion protein was overexpressed in MLO-Y4 osteocytes as a control. Due to the expression of GFP, mitochondrial morphology and motility can be evaluated in transfected MLO-Y4 cells by monitoring the GFP fluorescence.
The morphology of mitochondria was compared between MLO-Y4 osteocytes with overexpression of the fusion protein mt-SOD1G93A-GFP or mt-SOD1-GFP. Remarkably, 3 days after transfection, cultured MLO-Y4 osteocytes with overexpression of mt-SOD1G93A-GFP showed mitochondrial morphology and function similar to that of primary osteocytes derived from the ALS G93A mice at the age of 4-month old, while cultured MLO-Y4 osteocytes with overexpression of wild type mt-SOD1-GFP showed mitochondrial morphology and function similar to that of primary osteocytes derived from the WT mice. As demonstrated in Fig 5A/B, compared to WT (mt-SOD1-GFP) overexpression, the MLO-Y4 osteocytes with mt-SOD1G93A-GFP overexpression showed significant reduction in the cell population with network type mitochondria (G93A: 22.6% ± 0.9% vs WT: 48.8% ± 5.1%, n=50∼60, P<0.05) and a significant increase in the cell population with fragment type mitochondria (G93A: 77.4% ± 0.9% vs WT: 51.2% ± 5.1%, n=50∼60, P<0.05).
Figure 5. Overexpression of SOD1G93A directly altered mitochondrial morphology and motility in MLO-Y4 osteocytes.
Plasmid mt-SOD1G93A-GFP or mt-SOD1-GFP was transfected into MLO-Y4 cells for 72h. (A1/A2) Representative images of transfected cells. (B) Population of cells with network or fragment type of mitochondria. (n = 50∼60. * P<0.05). (C/D) Representative x-y and x-t scan images of the transfected cells for the quantification of mitochondrial motility. (E) The percentage of mitochondria in a single cell that moved during the x-t scan recording time. (n=9. *P<0.05).
To test whether the ALS mutation SOD1G93A has a direct effect on mitochondrial dynamics in MLO-Y4 osteocytes, the line scan x-t mode imaging (a similar procedure used in Fig 4) was applied to follow up the motility of individual mitochondria in MLO-Y4 osteocytes with overexpression of mt-SOD1G93A-GFP or wild type mt-SOD1-GFP as a control. As illustrated in representative images of Fig 5C and 5D, x-y mode images were first collected to distinguish individual mitochondria in a subcellular region of a MLO-Y4 osteocyte with the WT SOD1 (Fig 5C1) or the SOD1G93A overexpression (Fig 5D1). The line scan x-t mode images were then collected along a fixed x line (indicated by white dashed lines in Fig 5C1 and 5D1) in every 10 milliseconds/line for a total scan duration of 102 seconds (Fig 5C2 and 5D2). The motility of mitochondria was quantified by calculating the numbers of mitochondria in a single cell that moved during the recording time. As demonstrated in Fig 5E, compared to MLO-Y4 osteocytes with SOD1 overexpression, MLO-Y4 osteocytes with SOD1G93A overexpression showed significantly reduced numbers of moving mitochondria. The percentage of moving mitochondria in a single osteocyte is 34.0% ± 7.3% (SOD1G93A) vs 82.1% ± 0.6%, (SOD1) (n=9 cells, P<0.05; total 119 mitochondria evaluated for SOD1G93A cells and 161 for WT SOD1 cells). The data indicate that the ALS mutation SOD1G93A has a direct impact on mitochondrial morphology and motility in osteocytes.
3.4 Overexpression of SOD1G93A altered the expression level of key proteins related to mitochondrial fission and fusion activities in MLO-Y4 osteocytes
Normal mitochondrial morphology and dynamics rely on the balance between mitochondrial fusion and fission processes. The fusion and fission events are regulated by key proteins such as dynamin-related protein 1 (Drp1), which was found to promote mitochondrial fission events [52], while Optic Atrophy 1 (OPA1), Mitofusin 1 (Mfn1) and Mitofusin 2 (Mfn2) are key proteins for promoting mitochondrial fusion activity [53, 54]. To determine whether ALS mutation plays a direct role in changing the key proteins related to mitochondrial dynamics in osteocytes, we conducted immunoblotting analysis to determine the expression level of those key proteins in MLO-Y4 osteocytes transfected with mt-SOD1-GFP or mt-SOD1G93A-GFP. As shown in the representative images of Fig 6A, we obtained around 50% transfection efficiency in both osteocyte cell cultures with overexpression of mt-SOD1-GFP or mt-SOD1G93A-GFP, in 3 days after transfection. Three to six independent cell preparations were collected for immunoblotting analysis. As demonstrated in Fig 6B, Drp1 and the phosphorylated Drp1 (at Ser 600) were significantly increased in mt-SOD1G93A-GFP transfected cells. Although Mfn1 and Mfn2 did not show significant changes in SOD1G93A transfected cells (Fig 6D and 6E), the protein expression level of OPA1 was significant decreased (Fig 6C).
Figure 6. Overexpression of SOD1G93A altered the expression level of key proteins related to mitochondrial fission and fusion activities in MLO-Y4 osteocytes.
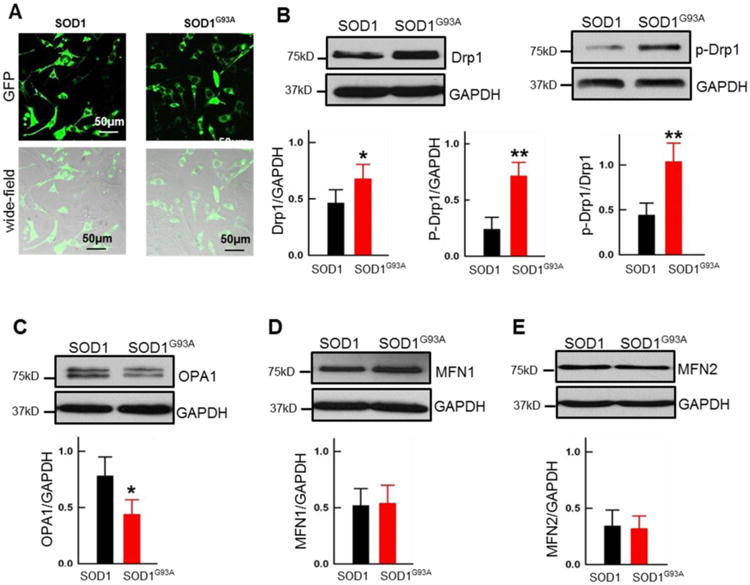
Plasmid mt-SOD1G93A-GFP or mt-SOD1-GFP was transfected into MLO-Y4 osteocytes for 72h. (A) Representative images to show the transfection efficiency (∼50%) in the osteocyte cultures collected for immunoblotting analysis. (B-E) Immunoblotting analysis of the expression level of Drp1, p-Drp1, OPA1, Mfn1 and Mfn2 in SOD1 or SOD1G93A in transfected MLO-Y4 osteocytes. GAPDH was used as the loading control, (n=6 for Drp1, p-Drp1; n=3 for OPA1 and MFN1/2, *P<0.05, **P<0.01).
3.5 Mdivi-1 partially restored mitochondrial morphology and motility in osteocytes with overexpression of mt-SOD1G93A-GFP
Mdivi-1 is an inhibitor of mitochondrial fission by inhibiting Drp1 self-assembly [55]. We further examined whether inhibition of mitochondrial fission protein Drp1 by Mdivi-1 could restore mitochondrial morphology and motility in osteocytes with overexpression of mt-SOD1G93A-GFP. Cultured osteocytes were transfected with mt-SOD1G93A-GFP. Three days following the transfection, mitochondrial morphology and motility in transfected osteocytes were evaluated under the conditions with or without the application of 10 μM Mdivi-1 in cultured medium for 24 hours (0.1% final Dimethyl sulfoxide (DMSO) concentration in culture medium as a solvent of Mdivi-1). The control groups were treated with 0.1% DMSO in the culture medium. Representative x-y and x-t scan images of osteocytes with overexpression of mt-SOD1-GFP or mt-SOD1G93A-GFP, and mt-SOD1G93A-GFP in the presence of Midivi-1 are shown in Fig 7A, 7B and 7C respectively. The quantitative analysis showed that Mdivi-1 treatment significantly restored mitochondrial network (Fig 7D). The cell population with the network type mitochondria was significantly increased in the group of Mdivi-1 treatment (G93A: 22.0% ± 1.2% vs G93A + Mdivi-1: 34.0% ± 5.0%, n=100, P<0.05). Compared to the non-treated osteocytes, the numbers of moving mitochondria in G93A osteocytes with Mdivi-1 treatment was also partially, but significantly restored (G93A+Mdivi-1: 36.8% ± 1.5% vs G93A: 29.3% ± 3.2%, n=9 cells, P<0.05; total 114 mitochondria evaluated for G93A cells and 196 for G93A+Mdivi-1 cells). The data suggest that inhibition of mitochondrial fission by Mdivi-1 significantly rescued mitochondrial network and motility in osteocytes with ALS mutation overexpression, although the restoration was not fully established when compared to osteocytes with the wild type SOD1 overexpression (network type: 46.0% ± 1.2%, mitochondrial motility: 65.1% ± 2.4%; n=9 cell, total 159 mitochondria evaluated).
Figure 7. Mdivi-1 partially restored mitochondrial morphology and motility in MLO-Y4 osteocytes expressing SOD1G93A.
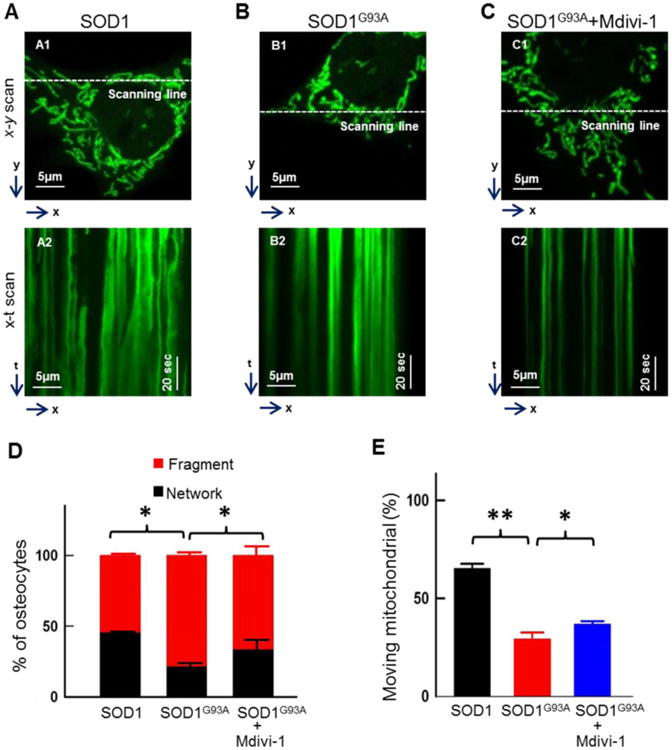
MLO-Y4 cells were transfected with mt-SOD1G93A-GFP or mt-SOD1-GFP for 72h. One group of SOD1G93A osteocytes was treated with 10μM Mdivi-1 for 24h. (A-C) Representative x-y and x-t scan images of the transfected cells for the quantification of mitochondrial morphology in the absence or presence of 10μM Mdivi-1. (D) Population of cells with network or fragment type of mitochondria (n = 100). (E) The percentage of mitochondria in a single cell that moved during the recording time (n = 7∼22). **P < 0.01, *P<0.05.
3.6 Enhanced apoptosis in G93A primary osteocytes and osteocytes with overexpression of mt-SOD1G93A-GFP
Excessive mitochondrial fission is linked to programed cell death, apoptosis [56]. We examined whether activation of apoptosis is associated with the defective mitochondrial dynamics in primary osteocytes derived from G93A mice at the ages of 2-month before the disease onset and 4-month old after the disease onset. Because activation of apoptosis is characterized by cell membrane blebbing and nuclear bubble budding [57, 58], we first evaluated whether these apoptosis phonotypes can be observed in primary osteocytes. The live primary osteocytes derived from G93A and wild type mice at the same ages were stained with DAPI for visualizing the morphology of nucleus under the confocal microscope. The representative images of a primary osteocyte show a normal nucleus (Fig 8A, a1) or a nucleus with bubbles (Fig 8A, a2, white arrows). The osteocytes with nuclear bubbles usually show cell membrane blebbing (Fig 8A, a2-2, a2-3, black arrows). The percentage of the primary osteocytes with nuclear bubbles was quantified in different experimental groups. As shown in Fig 8B, the percentage of primary osteocytes with nuclear bubbles was increased in G93A mice (4-month old) when compared with WT primary osteocytes (G93A: 26.8% ± 1.84% vs WT: 14.46% ± 1.36%, n=3 mice/group, 3-4 dishes/mouse, 50-69 cells/dish, P<0.05). There is no significant difference between primary osteocytes derived from 2-month old G93A and the same age-wild type mice (data not shown). Our live cell imaging data suggested an enhanced apoptosis activity in G93A osteocytes after ALS disease onset. This finding let us to further examine the apoptosis pathway in G93A osteocytes by evaluating a well-established apoptotic marker, cleaved caspase-3 [59, 60]. Because limited amount of primary osteocytes could be collected for immunoblotting analysis, especially in the case of G93A mice after the disease onset, we evaluated the expression of caspase-3 in MLO-Y4 osteocytes with overexpression of mt-SOD1G93A-GFP or mt-SOD1-GFP fusion proteins. Another important rationale for using MLO-Y4 cell line was to examine whether ALS mutation SOD1G93A could directly induce apoptosis in osteocytes. As shown in Fig 8C and 8D, the level of cleaved caspase-3 was significantly increased in the MLO-Y4 cells with 72h overexpression of mt-SOD1G93A-GFP, while the total caspase-3 stayed the same.
Figure 8. Enhanced apoptosis in G93A osteocytes.
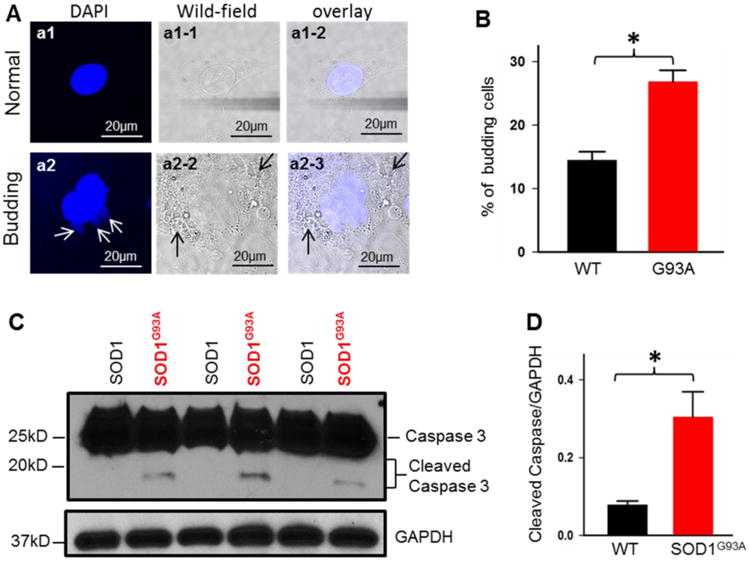
(A) Representative images of osteocytes with DAPI staining show normal nucleus (a1) or budding nucleus (a2, white arrows). The osteocyte with budding nucleus also shows membrane blebbing (a2-2 and a2-3, black arrows). (B) The primary osteocytes derived from 4-month old G93A mice show higher percentage of cells with budding nucleus (n=3, *p<0.05). (C, D) Immunoblotting analysis of MLO-Y4 osteocytes transfected with mt-SOD1G93A-GFP or mt-SOD1-GFP. Note increased cleaved Caspase 3 in SOD1G93A-transfected MLO-Y4 cells. (n=6, *P<0.05)
4. Discussion
ALS affects neuromuscular system and leads to severe muscle wasting. Bone responses to muscle atrophy with various defects that likely impact ALS progression. We previously found reduced trabecular and cortical bone mass in the ALS mouse model G93A with severe muscle atrophy [10]. To better understand the molecular and cellular mechanism underlying the bone wasting in ALS, we examined mitochondrial function in osteocytes derived from bone particles of the ALS mouse model G93A at different disease stages. We discovered that osteocytes derived from G93A mice after the onset of ALS disease showed altered mitochondrial network and dynamics. By overexpression of the ALS-causing mutation SOD1G93A in cultured MLO-Y4 osteocytes, we demonstrated that SOD1G93A mutation directly led to abnormalities in mitochondrial structure and function by altering the key proteins related to mitochondrial fission and fusion activities. In addition, the ALS mutation SOD1G93A-mediated dysfunction in mitochondrial dynamics is associated with an enhanced apoptosis in osteocytes, which could be a potential mechanism underlying the bone loss during ALS progression. It has been found that ALS-causing mutation SOD1G93A reduced mitochondrial dynamics in cultured motor neuron cell lines and primary motor neuron cultures derived from rodent embryos [44, 45]. Our previous study also demonstrated that ALS mutation directly causes abnormal mitochondrial dynamics in skeletal muscle cells [5]. Through examining mitochondrial dynamics in osteocytes we provide new evidence supporting that impaired mitochondrial dynamics is likely a common pathologic defect caused by ALS-linked mutations in bone, muscle and motor neurons during ALS disease progression.
Bone is a metabolically active organ and constantly undergoes resorption and formation defined as bone remodeling. There are three types of bone cells critical for bone remodeling. Among them, osteocytes are the most abundant cells in bone [12] and play key roles in coordinating the function of osteoblasts and osteoclasts [13, 61-67]. Thus, the current study focused on osteocytes derived from ALS G93A mice, specifically the mitochondrial function in osteocytes. We first examined mitochondria labeled with MitoTracker Deep Red in primary osteocytes derived from G93A mice. Mitochondrial morphology in G93A osteocytes is significantly altered with reduced length of individual mitochondrion (fragmented mitochondria), indicating that mitochondria are less connected, and the size of mitochondrial network is significantly reduced in G93A osteocytes. The increased number in fragmented mitochondria suggests an enhanced mitochondrial fission and/or reduced fusion activities in G93A osteocytes. Remarkably, a significant reduction of mitochondrial motility is observed in G93A osteocytes. Mitochondrial motility (transportation on microtubules) is ATP dependent [68]. Published studies have linked enhanced fission activity to reduced level of cellular ATP production[69]. It is possible that an excessive mitochondrial fission-mediated reduction in the cellular ATP level may be involved in the reduced mitochondrial motility.
The abnormal mitochondrial dynamics were observed in osteocytes derived from 4-month old G93A mice after ALS disease onset, but not at a younger age (2-month old). The result is in line with our previous finding in which the reduced bone density and other abnormalities in molecular and biochemical properties only occur in G93A mice after ALS disease onset with severe muscle atrophy [10]. Together, our data suggest that mitochondrial defects in osteocytes of G93A mice are likely a response to skeletal muscle atrophy during ALS disease progression. However, this does not rule out the possibility that ALS mutation also has a direct effect on mitochondrial function in bone cells. To address this fundamental question, we examined mitochondrial morphology and motility in cultured MLO-Y4 osteocytes with overexpression of ALS mutation SOD1G93A or wild type SOD1 as a control in the absence of muscle atrophy.
SOD1 is a cytosolic enzyme that is also associated with different intracellular organelles including mitochondria [70]. Published studies on ALS transgenic animal models have shown that accumulation of mutant SOD1 proteins inside mitochondria of motor neurons likely contributes to neuronal dysfunction [71, 72]. In our previous study, we have demonstrated that both wild type SOD1-GFP and mutant SOD1G93A-GFP could accumulate inside mitochondria of muscle fibers when expressed in cytosol [5]. As ALS is an age-dependent disease, it is likely that mutant SOD1G93A accumulation causes mitochondrial toxicity in a time-dependent manner. The ALS mouse model G93A is a transgenic mouse model with systemic overexpression of ALS mutation SOD1G93A in cytosol [46]. It is possible that 2-month accumulation of SOD1G93A in mitochondria may not be enough to cause detectable changes in mitochondrial dynamics in a G93A mouse. We previously found that short time expression of mutant SOD1G93A-GFP (7 days transfection) in the cytosol did not cause detectable changes in mitochondrial morphology and dynamics in skeletal muscle fibers [5]. To bypass the time-dependent accumulation process of the mutant protein, we used mitochondria-targeted SOD1 fusion proteins (mt-SOD1G93A-GFP and mt-SOD1-GFP). Three days after transfection, osteocytes with overexpression of mt-SOD1G93A-GFP showed changes in mitochondrial network and dynamics similar to that of primary osteocytes derived from 4-month old G93A mice, while the osteocytes with overexpression of the wild type mt-SOD1-GFP showed no significant changes in both mitochondrial network and dynamics comparing with primary osteocytes derived from wild type mice. Although the later onset of mitochondrial defect in primary G93A osteocytes suggests a muscle atrophy-related response of mitochondria, the result with ALS mutation overexpression in MLO-Y4 osteocytes provides additional evidence that accumulation of mutant SOD1G93A inside mitochondria is able to directly disrupt the homeostasis of mitochondrial fission and fusion activities in osteocytes in the absence of muscle impact.
In the current study, both primary osteocytes and cultured MLO-Y4 osteocytes with overexpression of the ALS mutation SOD1G93A show significantly more fragmented mitochondria, indicating an enhanced mitochondrial fission activity and/or a reduced fusion activity. There are key proteins involved in regulation of mitochondrial fission and fusion activities [73]. Changes in the protein expression level of those proteins alter mitochondrial size and motility in other cell types [74, 75]. It has been shown that enhanced mitochondrial fission mediated by Drp1 induces excessive mitochondrial fragmentation [73], [76]. This is a common pathway that leads to abnormal mitochondrial function critical to neuronal cell death [40,41]. In current study, we identified a significantly enhanced expression level of Drp1 in cultured osteocytes with overexpression of the ALS mutation SOD1G93A, indicating that the targeting of SOD1G93A to mitochondria promotes a Drp1-related mitochondrial fission activity. To further confirm the potential role of Drp1 in mitochondrial fission in osteocytes, we applied Mdivi-1, an inhibitor of mitochondrial fission protein Drp1 [55], to cultured MLO-Y4 osteocytes with overexpression of mt-SOD1G93A-GFP. Remarkably, inhibition of Drp1 by Mdivi-1 reduced the number of fragmented mitochondria induced by SOD1G93A and partially but significantly restored mitochondrial motility. The results further support that mutant SOD1G93A promotes Drp1-related mitochondrial fission in osteocytes.
Although overexpression of the ALS mutation SOD1G93A in osteocytes led to an increase in the protein expression level of Drp1 that could directly promote mitochondrial fission activity, accumulating evidence has shown that post-translational regulation of Drp1 also plays an important role in regulation of mitochondrial fission activity [69, 77, 78]. There are multiple putative phosphorylation sites in Drp1. While phosphorylation at Ser 579 (corresponding to Ser 616 in human [50]) has been shown consistently promote mitochondrial fission[69], the role of phosphorylation at Ser 600 (corresponding to Ser 637 in human [50]) on mitochondrial dynamics is under debate. Studies from several groups have provided evidence showing that de-phosphorylation at the site of Ser 637 of human Drp1 promotes mitochondrial fission activity in Hela cells [79, 80]. In contrast, the phosphorylation of murine Drp1 (p-Drp1) at Ser 600 residue was found to promote mitochondrial fission events in Podocytes and Endothelial Cells [52]. Interestingly, in the current study, we found that overexpression of the ALS mutation SOD1G93A in osteocytes also led to an increase in phosphorylation level of Drp1 at Ser 600. Thus, our study provides additional evidence that enhanced phosphorylation level of murine Drp1 at Ser 600 may be also involved in promoting mitochondrial fission, at least in osteocytes. The effect of post-translational regulation of Drp1 on mitochondrial dynamics is far from comprehensive and additional phosphorylation sites were also found to be involved [69, 77, 78]. Future effort should further explore other putative phosphorylation sites and their role in regulation of mitochondrial dynamics in osteocytes.
Normal mitochondrial network and dynamics rely on balanced fusion and fission activities that depend on the coordinated function of several key proteins [73]. Mdivi-1, a specific inhibitor of mitochondrial fission, specifically block the self-assembly of Drp1 [55]. Because the inhibition of Drp1 by Mdivi-1 did not completely restore mitochondrial network and motility in osteocytes expressing SOD1G93A, this suggests that there may be a reduced function of mitochondrial fusion activity. We examined the expression level of those key proteins involved in mitochondrial fusion activity (OPA1, Mfn1 and Mfn2) in the cultured osteocytes and found that the expression level of OPA1 was significantly reduced in osteocytes with overexpression of the ALS mutation SOD1G93A, although there are no detectable changes found in the expression level of Mfn1/2. Together, those data suggest that ALS mutation of SODG93A leads to abnormal mitochondrial network and dynamics by promoting the Drp1-related fission activity and suppressing the OPA1-related mitochondrial fusion activity.
We are aware of a recent publication by Bordt et al. (2017) that challenged the ability of Mdivi-1 to inhibit Drp1 and impact mitochondrial fission. In their study, Mdivi-1 (at a concentration of 50 μM) reversibly inhibited mitochondrial complex I, but did not play a role in mitochondrial elongation [81]. In our current study, we used 5-fold less concentration of Mdivi-1 (10 μM), a concentration that might not be enough to inhibit the complex I, but it indeed significantly altered mitochondrial morphology and motility of the osteocytes. These discrepancies could be due to the different concentrations used. At 50 μM, Mdivi-1 inhibits mitochondrial complex I respiratory function. A compromised mitochondrial respiratory function causes mitochondrial membrane depolarization that has been shown to promote fission activity [82]. We previously also showed that mitochondrial depolarization directly caused a reduction in mitochondrial dynamics in skeletal muscle cells[5]. It is possible that the specific inhibition of Mdivi-1 (10 μM) on Drp1 was covered by the inhibition of complex I at the high concentration of 50 μM. In addition, in responding to the study by Bordt et al 2017, Smith and Gallo published a recent review on “To Mdivi-1 or not to Mdivi-1: is that the Question?”[83], in which they summarized 42 publications that used Mdivi-1 as a Drp1 inhibitor in vitro and argued in favor of the originally described bioactivity of Mdivi-1 as an inhibitor of Drp1 mediated fission in mammalian cells. They concluded that “Although a flag of caution has been raised by Bordt et al. (2017) regarding the suitability of Mdivi-1 as a tool to manipulate Drp1 function, consideration of the literature using Mdivi-1 under controlled in vitro conditions does not support the notion that the field should stop using Mdivi-1 to address mitochondrial fission.”
Published studies have linked the uncontrolled activation of mitochondrial fission to apoptotic cell death in other cell types [55, 74, 84]. Here we provided evidence that the defective mitochondrial dynamics is accompanied by an enhanced apoptosis in osteocytes of G93A mice. Overexpression of the ALS mutation SOD1G93A in normal MLO-Y4 osteocytes directly induced apoptosis, which could be a potential downstream mechanism underlying the bone loss observed in G93A mice [10]. Future study should focus on exploring the upstream pathways by which ALS mutation SOD1G93A alters the expression level and/or post-translational regulation of OAP1 and Drp-1, and the downstream signaling pathways by which the defective mitochondrial dynamics initiates apoptosis-related cell death as a potential mechanism underlying the bone loss during ALS disease progression. As our previous biochemical study has found an enhanced osteoclast activity and reduced osteoblast activity in the bone of G93A mice after ALS disease onset [10], the effect of ALS mutations on mitochondrial function in osteoblasts and osteoclasts should be another important focus of the future study.
Conclusion
Our current study suggests that mitochondrial defect, specifically the abnormality in mitochondrial dynamics, is associated with bone loss during ALS disease progression. ALS-associated mutation SOD1G93A directly reduces mitochondrial motility through regulating the key proteins-related to mitochondria dynamics. Our results together with published data from us and other research groups provide evidences that ALS-causing mutation directly leads to dysfunction of mitochondrial fission and fusion activities in multiple organs. The dysfunction of mitochondrial dynamics seems a common potential mechanism related to the degeneration of motor neurons, muscle atrophy and bone loss in ALS. Those data provide new insight suggesting that restoration of mitochondrial dynamics could be developed as a potential means to alleviate ALS disease progression.
Supplementary Material
Highlights.
The primary osteocytes derived from an ALS mouse model show defects in mitochondrial morphology and motility.
The accumulation of ALS mutant SOD1G93A protein in mitochondria is causally linked to mitochondrial dysfunction in ALS osteocytes.
ALS mutant SOD1G93A alters the expression level of key proteins that regulate mitochondrial fission and fusion.
The ALS mutation SOD1G93A-mediated dysfunction in mitochondrial dynamics is associated with an enhanced apoptosis in osteocytes.
Acknowledgments
We appreciate Dr. Lynda Bonewald (Indiana University) for providing the MLO-Y4 cell line, Dr. Han-Xiang Deng (Northwestern University) for providing the ALS mouse model G93A and SOD1 cDNAs, and Mr. Frank Yi for editing the manuscript.
Funding: This work was supported by grants from NIAMS/National Institutes of Health Grant R01 AR057404, Bank of American Victor E. Speas Foundation and ALS Association (16-IIP-288) to Jingsong Zhou. Zhou laboratory was also supported by the McCown Gordon Gala Research Gift.
Abbreviations
- ALS
Amyotrophic Lateral Sclerosis
- Drp1
Dynamin-related protein 1
- G93A
an ALS mouse model with overexpression of ALS-associated mutation SOD1G93A
- GFP
green fluorescence protein
- OPA1
optic atrophy protein 1
- SOD1
superoxide dismutase 1
- SOD1G93A
superoxide dismutase G to A mutation at the position 93
- WT
wild type
Footnotes
Ethics approval: All animal experiments were performed according to the procedures approved by Institutional Animal Care and Use Committee of Kansas City University and University of Missouri at Kansas City.
Competing interests: The authors declare that they have no competing interests.
Publisher's Disclaimer: This is a PDF file of an unedited manuscript that has been accepted for publication. As a service to our customers we are providing this early version of the manuscript. The manuscript will undergo copyediting, typesetting, and review of the resulting proof before it is published in its final citable form. Please note that during the production process errors may be discovered which could affect the content, and all legal disclaimers that apply to the journal pertain.
References
- 1.Alonso A, Logroscino G, Jick SS, Hernan MA. Incidence and lifetime risk of motor neuron disease in the United Kingdom: a population-based study. Eur J Neurol. 2009 Jun;16:745–51. doi: 10.1111/j.1468-1331.2009.02586.x. [DOI] [PMC free article] [PubMed] [Google Scholar]
- 2.Pasinelli P, Brown RH. Molecular biology of amyotrophic lateral sclerosis: insights from genetics. Nat Rev Neurosci. 2006 Sep;7:710–23. doi: 10.1038/nrn1971. [DOI] [PubMed] [Google Scholar]
- 3.Boillee S, Vande Velde C, Cleveland DW. ALS: a disease of motor neurons and their nonneuronal neighbors. Neuron. 2006 Oct 05;52:39–59. doi: 10.1016/j.neuron.2006.09.018. [DOI] [PubMed] [Google Scholar]
- 4.Dobrowolny G, Aucello M, Rizzuto E, Beccafico S, Mammucari C, Boncompagni S, Belia S, Wannenes F, Nicoletti C, Del Prete Z, Rosenthal N, Molinaro M, Protasi F, Fano G, Sandri M, Musaro A. Skeletal muscle is a primary target of SOD1G93A-mediated toxicity. Cell metabolism. 2008 Nov;8:425–36. doi: 10.1016/j.cmet.2008.09.002. [DOI] [PubMed] [Google Scholar]
- 5.Luo G, Yi J, Ma C, Xiao Y, Yi F, Yu T, Zhou J. Defective mitochondrial dynamics is an early event in skeletal muscle of an amyotrophic lateral sclerosis mouse model. PLoS One. 2013;8:e82112. doi: 10.1371/journal.pone.0082112. [DOI] [PMC free article] [PubMed] [Google Scholar]
- 6.Wong M, Martin LJ. Skeletal muscle-restricted expression of human SOD1 causes motor neuron degeneration in transgenic mice. Hum Mol Genet. 2010 Jun 1;19:2284–302. doi: 10.1093/hmg/ddq106. [DOI] [PMC free article] [PubMed] [Google Scholar]
- 7.Wu S, Yi J, Zhang YG, Zhou J, Sun J. Leaky intestine and impaired microbiome in an amyotrophic lateral sclerosis mouse model. Physiological reports. 2015 Apr;3 doi: 10.14814/phy2.12356. [DOI] [PMC free article] [PubMed] [Google Scholar]
- 8.Yi J, Ma C, Li Y, Weisleder N, Rios E, Ma J, Zhou J. Mitochondrial calcium uptake regulates rapid calcium transients in skeletal muscle during excitation-contraction (E-C) coupling. J Biol Chem. 2011 Sep 16;286:32436–43. doi: 10.1074/jbc.M110.217711. [DOI] [PMC free article] [PubMed] [Google Scholar]
- 9.Zhou J, Yi J, Fu R, Liu E, Siddique T, Rios E, Deng HX. Hyperactive intracellular calcium signaling associated with localized mitochondrial defects in skeletal muscle of an animal model of amyotrophic lateral sclerosis. J Biol Chem. 2010 Jan 1;285:705–12. doi: 10.1074/jbc.M109.041319. [DOI] [PMC free article] [PubMed] [Google Scholar]
- 10.Zhu K, Yi J, Xiao Y, Lai Y, Song P, Zheng W, Jiao H, Fan J, Wu C, Chen D, Zhou J, Xiao G. Impaired bone homeostasis in amyotrophic lateral sclerosis mice with muscle atrophy. J Biol Chem. 2015 Mar 27;290:8081–94. doi: 10.1074/jbc.M114.603985. [DOI] [PMC free article] [PubMed] [Google Scholar]
- 11.Neel BA, Lin Y, Pessin JE. Skeletal muscle autophagy: a new metabolic regulator. Trends in endocrinology and metabolism: TEM. 2013 Dec;24:635–43. doi: 10.1016/j.tem.2013.09.004. [DOI] [PMC free article] [PubMed] [Google Scholar]
- 12.Raisz LG. Physiology and pathophysiology of bone remodeling. Clin Chem. 1999 Aug;45:1353–8. [PubMed] [Google Scholar]
- 13.Bonewald LF, Kiel DP, Clemens TL, Esser K, Orwoll ES, O'Keefe RJ, Fielding RA. Forum on bone and skeletal muscle interactions: summary of the proceedings of an ASBMR workshop. J Bone Miner Res. 2013 Sep;28:1857–65. doi: 10.1002/jbmr.1980. [DOI] [PMC free article] [PubMed] [Google Scholar]
- 14.Edwards MH, Gregson CL, Patel HP, Jameson KA, Harvey NC, Sayer AA, Dennison EM, Cooper C. Muscle size, strength, and physical performance and their associations with bone structure in the Hertfordshire Cohort Study. J Bone Miner Res. 2013 Nov;28:2295–304. doi: 10.1002/jbmr.1972. [DOI] [PMC free article] [PubMed] [Google Scholar]
- 15.Hamrick M. JMNI special issue: basic science and mechanisms of muscle-bone interactions. J Musculoskelet Neuronal Interact. 2010 Mar;10:1–2. [PubMed] [Google Scholar]
- 16.Kaji H. Interaction between Muscle and Bone. J Bone Metab. 2014 Feb;21:29–40. doi: 10.11005/jbm.2014.21.1.29. [DOI] [PMC free article] [PubMed] [Google Scholar]
- 17.Lang TF. The bone-muscle relationship in men and women. J Osteoporos. 2011;2011:702735. doi: 10.4061/2011/702735. [DOI] [PMC free article] [PubMed] [Google Scholar]
- 18.Lebrasseur NK, Achenbach SJ, Melton LJ, 3rd, Amin S, Khosla S. Skeletal muscle mass is associated with bone geometry and microstructure and serum insulin-like growth factor binding protein-2 levels in adult women and men. J Bone Miner Res. 2012 Oct;27:2159–69. doi: 10.1002/jbmr.1666. [DOI] [PMC free article] [PubMed] [Google Scholar]
- 19.Shackelford LC, LeBlanc AD, Driscoll TB, Evans HJ, Rianon NJ, Smith SM, Spector E, Feeback DL, Lai D. Resistance exercise as a countermeasure to disuse-induced bone loss. J Appl Physiol (1985) 2004 Jul;97:119–29. doi: 10.1152/japplphysiol.00741.2003. [DOI] [PubMed] [Google Scholar]
- 20.Hamrick MW, McNeil PL, Patterson SL. Role of muscle-derived growth factors in bone formation. J Musculoskelet Neuronal Interact. 2010 Mar;10:64–70. [PMC free article] [PubMed] [Google Scholar]
- 21.Blitz E, Viukov S, Sharir A, Shwartz Y, Galloway JL, Pryce BA, Johnson RL, Tabin CJ, Schweitzer R, Zelzer E. Bone ridge patterning during musculoskeletal assembly is mediated through SCX regulation of Bmp4 at the tendon-skeleton junction. Dev Cell. 2009 Dec;17:861–73. doi: 10.1016/j.devcel.2009.10.010. [DOI] [PMC free article] [PubMed] [Google Scholar]
- 22.Kahn J, Shwartz Y, Blitz E, Krief S, Sharir A, Breitel DA, Rattenbach R, Relaix F, Maire P, Rountree RB, Kingsley DM, Zelzer E. Muscle contraction is necessary to maintain joint progenitor cell fate. Dev Cell. 2009 May;16:734–43. doi: 10.1016/j.devcel.2009.04.013. [DOI] [PubMed] [Google Scholar]
- 23.Lee JY, Qu-Petersen Z, Cao B, Kimura S, Jankowski R, Cummins J, Usas A, Gates C, Robbins P, Wernig A, Huard J. Clonal isolation of muscle-derived cells capable of enhancing muscle regeneration and bone healing. J Cell Biol. 2000 Sep 4;150:1085–100. doi: 10.1083/jcb.150.5.1085. [DOI] [PMC free article] [PubMed] [Google Scholar]
- 24.Li H, Johnson NR, Usas A, Lu A, Poddar M, Wang Y, Huard J. Sustained release of bone morphogenetic protein 2 via coacervate improves the osteogenic potential of muscle-derived stem cells. Stem Cells Transl Med. 2013 Sep;2:667–77. doi: 10.5966/sctm.2013-0027. [DOI] [PMC free article] [PubMed] [Google Scholar]
- 25.Oishi T, Uezumi A, Kanaji A, Yamamoto N, Yamaguchi A, Yamada H, Tsuchida K. Osteogenic differentiation capacity of human skeletal muscle-derived progenitor cells. PLoS One. 2013;8:e56641. doi: 10.1371/journal.pone.0056641. [DOI] [PMC free article] [PubMed] [Google Scholar]
- 26.Sharir A, Stern T, Rot C, Shahar R, Zelzer E. Muscle force regulates bone shaping for optimal load-bearing capacity during embryogenesis. Development. 2011 Aug;138:3247–59. doi: 10.1242/dev.063768. [DOI] [PubMed] [Google Scholar]
- 27.Shwartz Y, Farkas Z, Stern T, Aszodi A, Zelzer E. Muscle contraction controls skeletal morphogenesis through regulation of chondrocyte convergent extension. Dev Biol. 2012 Oct 1;370:154–63. doi: 10.1016/j.ydbio.2012.07.026. [DOI] [PubMed] [Google Scholar]
- 28.Sun JS, Wu SY, Lin FH. The role of muscle-derived stem cells in bone tissue engineering. Biomaterials. 2005 Jun;26:3953–60. doi: 10.1016/j.biomaterials.2004.10.016. [DOI] [PubMed] [Google Scholar]
- 29.Bikle DD, Sakata T, Halloran BP. The impact of skeletal unloading on bone formation. Gravit Space Biol Bull. 2003 Jun;16:45–54. [PubMed] [Google Scholar]
- 30.Robling AG, Niziolek PJ, Baldridge LA, Condon KW, Allen MR, Alam I, Mantila SM, Gluhak-Heinrich J, Bellido TM, Harris SE, Turner CH. Mechanical stimulation of bone in vivo reduces osteocyte expression of Sost/sclerostin. J Biol Chem. 2008 Feb 29;283:5866–75. doi: 10.1074/jbc.M705092200. [DOI] [PubMed] [Google Scholar]
- 31.Sato Y, Honda Y, Asoh T, Kikuyama M, Oizumi K. Hypovitaminosis D and decreased bone mineral density in amyotrophic lateral sclerosis. Eur Neurol. 1997;37:225–9. doi: 10.1159/000117447. [DOI] [PubMed] [Google Scholar]
- 32.Sato Y, Honda Y, Iwamoto J. Etidronate for fracture prevention in amyotrophic lateral sclerosis: a randomized controlled trial. Bone. 2006 Nov;39:1080–6. doi: 10.1016/j.bone.2006.04.025. [DOI] [PubMed] [Google Scholar]
- 33.Majka SM, Jackson KA, Kienstra KA, Majesky MW, Goodell MA, Hirschi KK. Distinct progenitor populations in skeletal muscle are bone marrow derived and exhibit different cell fates during vascular regeneration. J Clin Invest. 2003 Jan;111:71–9. doi: 10.1172/JCI16157. [DOI] [PMC free article] [PubMed] [Google Scholar]
- 34.Sassoli C, Pini A, Chellini F, Mazzanti B, Nistri S, Nosi D, Saccardi R, Quercioli F, Zecchi-Orlandini S, Formigli L. Bone marrow mesenchymal stromal cells stimulate skeletal myoblast proliferation through the paracrine release of VEGF. PLoS One. 2012;7:e37512. doi: 10.1371/journal.pone.0037512. [DOI] [PMC free article] [PubMed] [Google Scholar]
- 35.Koh SH, Baik W, Noh MY, Cho GW, Kim HY, Kim KS, Kim SH. The functional deficiency of bone marrow mesenchymal stromal cells in ALS patients is proportional to disease progression rate. Exp Neurol. 2012 Jan;233:472–80. doi: 10.1016/j.expneurol.2011.11.021. [DOI] [PubMed] [Google Scholar]
- 36.Cho GW, Noh MY, Kim HY, Koh SH, Kim KS, Kim SH. Bone marrow-derived stromal cells from amyotrophic lateral sclerosis patients have diminished stem cell capacity. Stem Cells Dev. 2010 Jul;19:1035–42. doi: 10.1089/scd.2009.0453. [DOI] [PubMed] [Google Scholar]
- 37.Blanquer M, Moraleda JM, Iniesta F, Gomez-Espuch J, Meca-Lallana J, Villaverde R, Perez-Espejo MA, Ruiz-Lopez FJ, Garcia Santos JM, Bleda P, Izura V, Saez M, De Mingo P, Vivancos L, Carles R, Jimenez J, Hernandez J, Guardiola J, Del Rio ST, et al. Neurotrophic bone marrow cellular nests prevent spinal motoneuron degeneration in amyotrophic lateral sclerosis patients: a pilot safety study. Stem Cells. 2012 Jun;30:1277–85. doi: 10.1002/stem.1080. [DOI] [PubMed] [Google Scholar]
- 38.Gao J, Wang L, Liu J, Xie F, Su B, Wang X. Abnormalities of Mitochondrial Dynamics in Neurodegenerative Diseases. Antioxidants (Basel) 2017 Apr 05;6 doi: 10.3390/antiox6020025. [DOI] [PMC free article] [PubMed] [Google Scholar]
- 39.Chen H, Chan DC. Mitochondrial dynamics--fusion, fission, movement, and mitophagy--in neurodegenerative diseases. Hum Mol Genet. 2009 Oct 15;18:R169–76. doi: 10.1093/hmg/ddp326. [DOI] [PMC free article] [PubMed] [Google Scholar]
- 40.Lackner LL. Shaping the dynamic mitochondrial network. BMC Biol. 2014 May 27;12:35. doi: 10.1186/1741-7007-12-35. [DOI] [PMC free article] [PubMed] [Google Scholar]
- 41.Liu X, Weaver D, Shirihai O, Hajnoczky G. Mitochondrial ‘kiss-and-run’: interplay between mitochondrial motility and fusion-fission dynamics. EMBO J. 2009 Oct 21;28:3074–89. doi: 10.1038/emboj.2009.255. [DOI] [PMC free article] [PubMed] [Google Scholar]
- 42.Cho DH, Nakamura T, Lipton SA. Mitochondrial dynamics in cell death and neurodegeneration. Cell Mol Life Sci. 2010 Oct;67:3435–47. doi: 10.1007/s00018-010-0435-2. [DOI] [PMC free article] [PubMed] [Google Scholar]
- 43.Lu B. Mitochondrial dynamics and neurodegeneration. Curr Neurol Neurosci Rep. 2009 May;9:212–9. doi: 10.1007/s11910-009-0032-7. [DOI] [PMC free article] [PubMed] [Google Scholar]
- 44.Magrane J, Hervias I, Henning MS, Damiano M, Kawamata H, Manfredi G. Mutant SOD1 in neuronal mitochondria causes toxicity and mitochondrial dynamics abnormalities. Hum Mol Genet. 2009 Dec 01;18:4552–64. doi: 10.1093/hmg/ddp421. [DOI] [PMC free article] [PubMed] [Google Scholar]
- 45.Song W, Song Y, Kincaid B, Bossy B, Bossy-Wetzel E. Mutant SOD1G93A triggers mitochondrial fragmentation in spinal cord motor neurons: neuroprotection by SIRT3 and PGC-1alpha. Neurobiol Dis. 2013 Mar;51:72–81. doi: 10.1016/j.nbd.2012.07.004. [DOI] [PMC free article] [PubMed] [Google Scholar]
- 46.Gurney ME, Pu H, Chiu AY, Dal Canto MC, Polchow CY, Alexander DD, Caliendo J, Hentati A, Kwon YW, Deng HX, et al. Motor neuron degeneration in mice that express a human Cu,Zn superoxide dismutase mutation. Science. 1994 Jun 17;264:1772–5. doi: 10.1126/science.8209258. [DOI] [PubMed] [Google Scholar]
- 47.Stern AR, Stern MM, Van Dyke ME, Jahn K, Prideaux M, Bonewald LF. Isolation and culture of primary osteocytes from the long bones of skeletally mature and aged mice. Biotechniques. 2012 Jun;52:361–73. doi: 10.2144/0000113876. [DOI] [PMC free article] [PubMed] [Google Scholar]
- 48.Kato Y, Windle JJ, Koop BA, Mundy GR, Bonewald LF. Establishment of an osteocyte-like cell line, MLO-Y4. J Bone Miner Res. 1997 Dec;12(12):2014–2023. doi: 10.1359/jbmr.1997.12.12.2014. [DOI] [PubMed] [Google Scholar]
- 49.Loro G, Drago I, Pozzan T, Schiavo FL, Zottini M, Costa A. Targeting of Cameleons to various subcellular compartments reveals a strict cytoplasmic/mitochondrial Ca(2)(+) handling relationship in plant cells. Plant J. 2012 Jul;71:1–13. doi: 10.1111/j.1365-313X.2012.04968.x. [DOI] [PubMed] [Google Scholar]
- 50.Li G, Zhou J, Budhraja A, Hu X, Chen Y, Cheng Q, Liu L, Zhou T, Li P, Liu E, Gao N. Mitochondrial translocation and interaction of cofilin and Drp1 are required for erucin-induced mitochondrial fission and apoptosis. Oncotarget. 2015 Jan 30;6:1834–49. doi: 10.18632/oncotarget.2795. [DOI] [PMC free article] [PubMed] [Google Scholar]
- 51.Zhang K, Barragan-Adjemian C, Ye L, Kotha S, Dallas M, Lu Y, Zhao S, Harris M, Harris SE, Feng JQ, Bonewald LF. E11/gp38 selective expression in osteocytes: regulation by mechanical strain and role in dendrite elongation. Mol Cell Biol. 2006 Jun;26:4539–52. doi: 10.1128/MCB.02120-05. [DOI] [PMC free article] [PubMed] [Google Scholar]
- 52.Wang W, Wang Y, Long J, Wang J, Haudek SB, Overbeek P, Chang BH, Schumacker PT, Danesh FR. Mitochondrial fission triggered by hyperglycemia is mediated by ROCK1 activation in podocytes and endothelial cells. Cell Metab. 2012 Feb 08;15:186–200. doi: 10.1016/j.cmet.2012.01.009. [DOI] [PMC free article] [PubMed] [Google Scholar]
- 53.Duvezin-Caubet S, Jagasia R, Wagener J, Hofmann S, Trifunovic A, Hansson A, Chomyn A, Bauer MF, Attardi G, Larsson NG, Neupert W, Reichert AS. Proteolytic processing of OPA1 links mitochondrial dysfunction to alterations in mitochondrial morphology. J Biol Chem. 2006 Dec 08;281:37972–9. doi: 10.1074/jbc.M606059200. [DOI] [PubMed] [Google Scholar]
- 54.Ishihara N, Eura Y, Mihara K. Mitofusin 1 and 2 play distinct roles in mitochondrial fusion reactions via GTPase activity. J Cell Sci. 2004 Dec 15;117:6535–46. doi: 10.1242/jcs.01565. [DOI] [PubMed] [Google Scholar]
- 55.Cassidy-Stone A, Chipuk JE, Ingerman E, Song C, Yoo C, Kuwana T, Kurth MJ, Shaw JT, Hinshaw JE, Green DR, Nunnari J. Chemical inhibition of the mitochondrial division dynamin reveals its role in Bax/Bak-dependent mitochondrial outer membrane permeabilization. Dev Cell. 2008 Feb;14:193–204. doi: 10.1016/j.devcel.2007.11.019. [DOI] [PMC free article] [PubMed] [Google Scholar]
- 56.Youle RJ, Karbowski M. Mitochondrial fission in apoptosis. Nat Rev Mol Cell Biol. 2005 Aug;6:657–63. doi: 10.1038/nrm1697. [DOI] [PubMed] [Google Scholar]
- 57.Coleman ML, Sahai EA, Yeo M, Bosch M, Dewar A, Olson MF. Membrane blebbing during apoptosis results from caspase-mediated activation of ROCK I. Nat Cell Biol. 2001 Apr;3:339–45. doi: 10.1038/35070009. [DOI] [PubMed] [Google Scholar]
- 58.Lindenboim L, Sasson T, Worman HJ, Borner C, Stein R. Cellular stress induces Bax-regulated nuclear bubble budding and rupture followed by nuclear protein release. Nucleus. 2014;5:527–41. doi: 10.4161/19491034.2014.970105. [DOI] [PMC free article] [PubMed] [Google Scholar]
- 59.McIlwain DR, Berger T, Mak TW. Caspase functions in cell death and disease. Cold Spring Harb Perspect Biol. 2013 Apr 01;5:a008656. doi: 10.1101/cshperspect.a008656. [DOI] [PMC free article] [PubMed] [Google Scholar]
- 60.Xiao Y, Ma C, Yi J, Wu S, Luo G, Xu X, Lin PH, Sun J, Zhou J. Suppressed autophagy flux in skeletal muscle of an amyotrophic lateral sclerosis mouse model during disease progression. Physiological reports. 2015 Jan 1;3 doi: 10.14814/phy2.12271. [DOI] [PMC free article] [PubMed] [Google Scholar]
- 61.Lin C, Jiang X, Dai Z, Guo X, Weng T, Wang J, Li Y, Feng G, Gao X, He L. Sclerostin mediates bone response to mechanical unloading through antagonizing Wnt/beta-catenin signaling. J Bone Miner Res. 2009 Oct;24:1651–61. doi: 10.1359/jbmr.090411. [DOI] [PubMed] [Google Scholar]
- 62.Di Monaco M, Vallero F, Di Monaco R, Tappero R. Prevalence of sarcopenia and its association with osteoporosis in 313 older women following a hip fracture. Arch Gerontol Geriatr. 2011 Jan-Feb;52:71–4. doi: 10.1016/j.archger.2010.02.002. [DOI] [PubMed] [Google Scholar]
- 63.Galli C, Passeri G, Macaluso GM. Osteocytes and WNT: the mechanical control of bone formation. J Dent Res. 2010 Apr;89:331–43. doi: 10.1177/0022034510363963. [DOI] [PubMed] [Google Scholar]
- 64.Tu X, Rhee Y, Condon KW, Bivi N, Allen MR, Dwyer D, Stolina M, Turner CH, Robling AG, Plotkin LI, Bellido T. Sost downregulation and local Wnt signaling are required for the osteogenic response to mechanical loading. Bone. 2012 Jan;50:209–17. doi: 10.1016/j.bone.2011.10.025. [DOI] [PMC free article] [PubMed] [Google Scholar]
- 65.Zhao L, Shim JW, Dodge TR, Robling AG, Yokota H. Inactivation of Lrp5 in osteocytes reduces young's modulus and responsiveness to the mechanical loading. Bone. 2013 May;54:35–43. doi: 10.1016/j.bone.2013.01.033. [DOI] [PMC free article] [PubMed] [Google Scholar]
- 66.Bivi N, Pacheco-Costa R, Brun LR, Murphy TR, Farlow NR, Robling AG, Bellido T, Plotkin LI. Absence of Cx43 selectively from osteocytes enhances responsiveness to mechanical force in mice. J Orthop Res. 2013 Jul;31:1075–81. doi: 10.1002/jor.22341. [DOI] [PMC free article] [PubMed] [Google Scholar]
- 67.Javaheri B, Stern AR, Lara N, Dallas M, Zhao H, Liu Y, Bonewald LF, Johnson ML. Deletion of a single beta-catenin allele in osteocytes abolishes the bone anabolic response to loading. J Bone Miner Res. 2014 Mar;29:705–15. doi: 10.1002/jbmr.2064. [DOI] [PMC free article] [PubMed] [Google Scholar]
- 68.Lin MY, Sheng ZH. Regulation of mitochondrial transport in neurons. Exp Cell Res. 2015 May 15;334:35–44. doi: 10.1016/j.yexcr.2015.01.004. [DOI] [PMC free article] [PubMed] [Google Scholar]
- 69.Flippo KH, Strack S. Mitochondrial dynamics in neuronal injury, development and plasticity. J Cell Sci. 2017 Feb 15;130:671–681. doi: 10.1242/jcs.171017. [DOI] [PMC free article] [PubMed] [Google Scholar]
- 70.Okado-Matsumoto A, Fridovich I. Subcellular distribution of superoxide dismutases (SOD) in rat liver: Cu,Zn-SOD in mitochondria. J Biol Chem. 2001 Oct 19;276:38388–93. doi: 10.1074/jbc.M105395200. [DOI] [PubMed] [Google Scholar]
- 71.Deng HX, Shi Y, Furukawa Y, Zhai H, Fu R, Liu E, Gorrie GH, Khan MS, Hung WY, Bigio EH, Lukas T, Dal Canto MC, O'Halloran TVO, Siddique T. Conversion to the amyotrophic lateral sclerosis phenotype is associated with intermolecular linked insoluble aggregates of SOD1 in mitochondria. Proc Natl Acad Sci U S A. 2006 May 2;103:7142–7. doi: 10.1073/pnas.0602046103. [DOI] [PMC free article] [PubMed] [Google Scholar]
- 72.Higgins CM, Jung C, Ding H, Xu Z. Mutant Cu, Zn superoxide dismutase that causes motoneuron degeneration is present in mitochondria in the CNS. J Neurosci. 2002 Mar 15;22:RC215. doi: 10.1523/JNEUROSCI.22-06-j0001.2002. [DOI] [PMC free article] [PubMed] [Google Scholar]
- 73.Detmer SA, Chan DC. Functions and dysfunctions of mitochondrial dynamics. Nat Rev Mol Cell Biol. 2007 Nov;8:870–9. doi: 10.1038/nrm2275. [DOI] [PubMed] [Google Scholar]
- 74.Estaquier J, Arnoult D. Inhibiting Drp1-mediated mitochondrial fission selectively prevents the release of cytochrome c during apoptosis. Cell Death Differ. 2007 Jun;14:1086–94. doi: 10.1038/sj.cdd.4402107. [DOI] [PubMed] [Google Scholar]
- 75.Uo T, Dworzak J, Kinoshita C, Inman DM, Kinoshita Y, Horner PJ, Morrison RS. Drp1 levels constitutively regulate mitochondrial dynamics and cell survival in cortical neurons. Exp Neurol. 2009 Aug;218:274–85. doi: 10.1016/j.expneurol.2009.05.010. [DOI] [PMC free article] [PubMed] [Google Scholar]
- 76.Frank S, Gaume B, Bergmann-Leitner ES, Leitner WW, Robert EG, Catez F, Smith CL, Youle RJ. The role of dynamin-related protein 1, a mediator of mitochondrial fission, in apoptosis. Dev Cell. 2001 Oct;1:515–25. doi: 10.1016/s1534-5807(01)00055-7. [DOI] [PubMed] [Google Scholar]
- 77.Hu C, Huang Y, Li L. Drp1-Dependent Mitochondrial Fission Plays Critical Roles in Physiological and Pathological Progresses in Mammals. Int J Mol Sci. 2017 Jan 13;18 doi: 10.3390/ijms18010144. [DOI] [PMC free article] [PubMed] [Google Scholar]
- 78.Prieto J, Leon M, Ponsoda X, Sendra R, Bort R, Ferrer-Lorente R, Raya A, Lopez-Garcia C, Torres J. Early ERK1/2 activation promotes DRP1-dependent mitochondrial fission necessary for cell reprogramming. Nat Commun. 2016 Mar 31;7:11124. doi: 10.1038/ncomms11124. [DOI] [PMC free article] [PubMed] [Google Scholar]
- 79.Cereghetti GM, Stangherlin A, Martins de Brito O, Chang CR, Blackstone C, Bernardi P, Scorrano L. Dephosphorylation by calcineurin regulates translocation of Drp1 to mitochondria. Proc Natl Acad Sci U S A. 2008 Oct 14;105:15803–8. doi: 10.1073/pnas.0808249105. [DOI] [PMC free article] [PubMed] [Google Scholar]
- 80.Chang CR, Blackstone C. Cyclic AMP-dependent protein kinase phosphorylation of Drp1 regulates its GTPase activity and mitochondrial morphology. J Biol Chem. 2007 Jul 27;282:21583–7. doi: 10.1074/jbc.C700083200. [DOI] [PubMed] [Google Scholar]
- 81.Bordt EA, Clerc P, Roelofs BA, Saladino AJ, Tretter L, Adam-Vizi V, Cherok E, Khalil A, Yadava N, Ge SX, Francis TC, Kennedy NW, Picton LK, Kumar T, Uppuluri S, Miller AM, Itoh K, Karbowski M, Sesaki H, et al. The Putative Drp1 Inhibitor mdivi-1 Is a Reversible Mitochondrial Complex I Inhibitor that Modulates Reactive Oxygen Species. Dev Cell. 2017 Mar 27;40:583–594 e6. doi: 10.1016/j.devcel.2017.02.020. [DOI] [PMC free article] [PubMed] [Google Scholar]
- 82.Jheng HF, Tsai PJ, Guo SM, Kuo LH, Chang CS, Su IJ, Chang CR, Tsai YS. Mitochondrial fission contributes to mitochondrial dysfunction and insulin resistance in skeletal muscle. Mol Cell Biol. 2012 Jan;32:309–19. doi: 10.1128/MCB.05603-11. [DOI] [PMC free article] [PubMed] [Google Scholar]
- 83.Smith G, Gallo G. To mdivi-1 or not to mdivi-1: Is that the question? Dev Neurobiol. 2017 doi: 10.1002/dneu.22519. [DOI] [PMC free article] [PubMed] [Google Scholar]
- 84.Neuspiel M, Zunino R, Gangaraju S, Rippstein P, McBride H. Activated mitofusin 2 signals mitochondrial fusion, interferes with Bax activation, and reduces susceptibility to radical induced depolarization. J Biol Chem. 2005 Jul 01;280:25060–70. doi: 10.1074/jbc.M501599200. [DOI] [PubMed] [Google Scholar]
Associated Data
This section collects any data citations, data availability statements, or supplementary materials included in this article.