

Abstract
Endogenous electric fields play an important role in embryogenesis, regeneration, and wound repair and previous studies have shown that many populations of cells, leukocytes, fibroblasts, epithelial cells, and endothelial cells, exhibit directed migration in response to electric fields. As regenerative therapies continue to explore ways to control mesenchymal progenitor cells to recreate desirable tissues, it is increasingly necessary to characterize the vast nature of biological responses imposed by physical phenomena. Murine adipose-derived stromal cells (mASCs) migrated toward the cathode in direct current (DC) fields of physiologic strength and show a dose dependence of migration rate to stronger fields. Electric fields also caused mASCs to orient perpendicularly to the field vector and elicited a transient increase in cytosolic calcium. Additionally, their galvanotactic response appears to share classic chemotactic signaling pathways that are involved in the migration of other cell types. Galvanotaxis is one predominant result of electric fields on mASCs and it may be exploited to engineer adult stem cell concentrations and locations within implanted grafts or toward sites of wound repair.
Keywords: DC Electric Field, Mesenchymal Stem cell, Cell Migration, Galvanotaxis, Cell Orientation
Introduction
Electric fields are present in organisms and can direct and influence a number of biological processes including embryogenesis, regeneration, and wound healing [1,2]. Spatial differences in transepithelial potentials generate electric fields with current densities up to 100 μA/cm2 exiting the blastopore in intact Xenopus embryos [3]. The sites where currents such as these exit the embryo are typically regions of major tissue reorganization suggesting that tissue migration and electric fields are related [4]. Disruption of electric fields along the neural groove in salamander embryos during development causes defects emphasizing the pivotal role that electric fields play in tissue organization during genesis and repair [5].
In adult organisms, after injuries, an electric field is established with a cathode such that current is directed toward the center of wounded epithelium. Field strengths on the order of 1.4 V/cm help to regulate wound re-epithelialization through directed cell migration [6–8]. In vitro electric fields of similar magnitudes have been shown to cause galvanotaxis in a diverse number of cell types. In most cases, cells such as bovine aortic vascular endothelial cells, human keratinocytes, and mouse embryonic fibroblasts migrate towards the cathode [9–11]. However some cells including human granulocytes, rabbit corneal endothelial cells, and human vascular endothelial cells migrate towards the anode [12–14]. As demonstrated by the diverse responses, electric field effects on cells are type and species specific, and cells need to be examined on a case-by-case basis.
The vital role of stem cells in environments where electric fields exert strong organizational cues suggests the juxtaposition may engender specialized cellular responses. ASCs, as a source of multipotent cells, are of particular interest due to their potential utility in regenerative therapies. The likelihood for those therapies to involve cells coupled with scaffolds and possibly external stimuli such as electric fields is high. Little is known about the effect of electric fields on multipotent cells, therefore this work examines the effect of physiologic and nonphysiologic electric fields on mASCs. To improve therapies involving progenitor cells, we seek to understand and possibly exploit the effect of electric fields on ASCs.
Materials and Methods
Chemicals and Media
Dulbecco’s modified Eagle’s medium (DMEM), carbon dioxide independent medium, rhodamine phalloidin, Alexa Fluor 488 conjugated actin, and Fura-2 AM were purchased from Invitrogen (Carlsbad, CA). Fetal bovine serum was purchased from Gemini Bioproducts (Woodland, CA). Akt inhibitor and U0126 were purchased from Calbiochem (San Diego, CA). Y27632, nifedipine, nickel chloride, gadolinium chloride, dispase II, and collagenase A were purchased from Sigma (St. Louis, MO). Anti diphosphorylated ERK, polyclonal anti ERK1/2, was also purchased from sigma and was used in conjunction with a mouse on mouse staining kit (Vector Labs, Burlingame, CA). LY294002 was purchased from Promega (Madison, WI). The anti EGF receptor antibody and FITC conjugated secondary antibody were obtained from Santa Cruz Biotechnology (Santa Cruz, CA).
Cell Culture
All experiments were performed in accordance with Stanford University Animal Care and Use Committee guidelines. CD-1 mice were purchased from Charles River Laboratories (Wilmington, MA) and mASCs were derived as previously described [15]. Cells up to the second passage were used for experiments at densities of 104 cells/cm2.
For fibroblast isolation, post-natal day 1 mice were anesthetized. Dorsal skin was collected under sterile conditions and digested in 0.1% collagenase A in PBS for 20 minutes in a 37°C shaking water bath. Cells were then pelleted by centrifugation and resuspended in growth medium, consisting of DMEM, 10% FBS, and 1% penicillin/streptomycin. Second passage through fourth passage cells were used for all experiments.
Whole calvarial derived osteoblasts (cOBs) were isolated from post-natal day 5 mice. Calvarial bones were dissected to remove all sutural, periosteal, and dural tissues and finely minced. Serial digestions were performed in 0.1% collagenase A and 0.2% dispase II in DMEM for 30 minutes each. The first digestion was discarded. The subsequent three digestions were collected, pelleted, resuspended in medium, and plated in culture dishes. Cells were used from the second passage through fourth passage for migration experiments.
Electrical Stimulation Chamber
Chambers were fabricated by laminating optically clear acrylic to a culture dish with a mylar adhesive film creating a 2 cm long, 1 cm wide, and 100 μm deep channel in which cells were cultured and electrically stimulated. A new device was used for each experiment.
Migration and Orientation
Cells were allowed to adhere to the culture surface in the chamber overnight at 37°C and 5% CO2. CO2 independent medium with 10% FBS and 1% penicillin-streptomycin was added to the reservoir. Agarose 2% salt bridges were connected between the cell chamber with platinum electrodes immersed in saline reservoirs connected to a DC power supply (Agilent Technologies, Santa Clara, CA). The chamber was placed on an inverted microscope stage (Carl Zeiss, Thornwood, NY) and allowed to equilibrate for 10 minutes. A field was applied and cell migration was recorded by time-lapse microscopy at 1 frame every 10 minutes for 6 hours. For experiments with cell pathway inhibitors, the cells were incubated with medium containing the inhibitor for one hour prior to cell migration experimentation.
Movement was tracked by using NIH ImageJ (v. 1.42d) to yield x-y coordinates for the cell centroid at the start and final frame. Best-fit ellipses were calculated from cell outlines and the major and minor axes lengths as well as the major axis angle, α, were measured. Over 100 cell tracks from multiple independent experiments were analyzed. The movement of cells was quantitatively evaluated by the average cosine of the migration angle θ, presented as the average value ± standard error of the mean (<Cos(θ)> ± SEM); the average speed (V) calculated as d/Δt ± SEM; and mean migration direction. The Rayleigh test for circular uniformity was applied, with a significance level of 0.05. The mean direction and the 95% confidence interval were calculated as well as the concentration parameter, κ. The orientation index, the average Cos (2α) ± SEM, (<Cos (2α)> ± SEM) was used as an indicator of cell reorientation. A value of -1 indicates a cell elongated perpendicular to the field and a value of 1, a cell elongated parallel to the field. A value approaching 0 shows circular or randomly oriented cells. Changes in migration and orientation between control and inhibited cells produced by the field exposure were examined using Student’s t-test. Results were deemed statistically significant when p < 0.05.
Calcium Imaging
Prior to electric field exposure, cells were incubated with 10 μM Fura-2 AM for 30 minutes at 31°C to reduce dye compartmentalization in phenol red free DMEM then washed with fresh DMEM and 1% FBS. Following Fura-2-AM loading, the galvanotaxis chambers were mounted on a fluorescent microscope and left undisturbed for 30 minutes. Fluorescent images were collected at 10 second intervals for 5 minutes prior to, during, and after applying an electric field to the cells. All experiments were performed at room temperature.
Cytoskeletal Imaging
Areas of active actin polymerization were labeled with fluorescent actin (after ref 16). The cells were permeabilized for 3 minutes in cytoskeleton buffer containing sucrose (CBS) (10mM MES, pH 6.1, 138 mM KCl, 3 mM MgCl2, 2 mM EGTA, 0.2 mg/ml saponin, 1 mM ATP, and 15 μg/ml Alexa Fluor 488 conjugated actin) in the presence of the electric field. The cells were then fixed and incubated for with rhodamine phalloidin to stain all actin filaments and imaged.
EGF and ERK Staining
The cells were exposed to a 10 V/cm electric field for 6 hours. The cells were quickly washed in PBS and immediately incubated for 15 minutes in 0.5% Triton X-100, and 0.25% glutaraldehyde in buffer 1 (60 mM PIPES, 25 mM HEPES, 10 mM EDTA, and 2 mM MgCl2, pH 6.90). The cells were postfixed for 20 minutes in 1% glutaraldeyde for 15 minutes. The cells were blocked in normal donkey serum and incubated in primary antibody, goat anti EGFR. The cells were rinsed, incubated with a FITC conjugated secondary antibody, washed and imaged. For ERK1/2 staining, the cells were similarly fixed, washed, and blocked. Then the cells were incubated with MOM blocking solution and prepared further following the manufacturer’s instructions.
Results
Galvanotaxis and Orientation
The most robust response of mASCs to DC electric fields was a strong migratory response coupled with a remarkable change in cellular orientation. Cellular migration was measured during exposure to uniform DC electric fields for six hours in physiologic 1 V/cm, and supraphysiologic conditions, 6 V/cm and 10 V/cm. The <Cos(θ)> value was computed for each case. The electrodes were positioned such that a <Cos(θ)> value approaching 1 signifies cell migration directed toward the cathode and −1 toward the anode and 0 indicating random migration. The directedness increased with increasing field strength. In the absence of a field, the value was 0.02 ± 0.09 showing no migratory bias. The 1 V/cm condition indicated cells migrated toward the cathode (0.38 ± 0.04) with 6 V/cm and 10 V/cm exhibiting values of 0.51 ± 0.04 and 0.77 ± 0.03, respectively, demonstrating increased cathodal directedness. The mean migration angle, μ, reflected the same trend and the concentration parameter, κ, also increased with stronger fields (Fig. 2A). The migration speed increased in a dose dependent manner as well (Fig. 2B). The cells demonstrated a dramatic reorientation, aligning their long axes perpendicular to the electric field as shown by the change in orientation indices (Fig. 2C). An example of the cellular reorientation is shown in phase images of the cells before and after a 6 hour, 10 V/cm field application (Fig. 2D and E).
Fig. 2.

Fura-2 imaging (A) Traces of individual cell fluorescence intensity ratios demonstrating an increase in calcium (B) Corresponding pseudocolored ratiometric images before the field, two points during the field, and 150 s after the field.
Specificity of mASCs Galvanotaxis
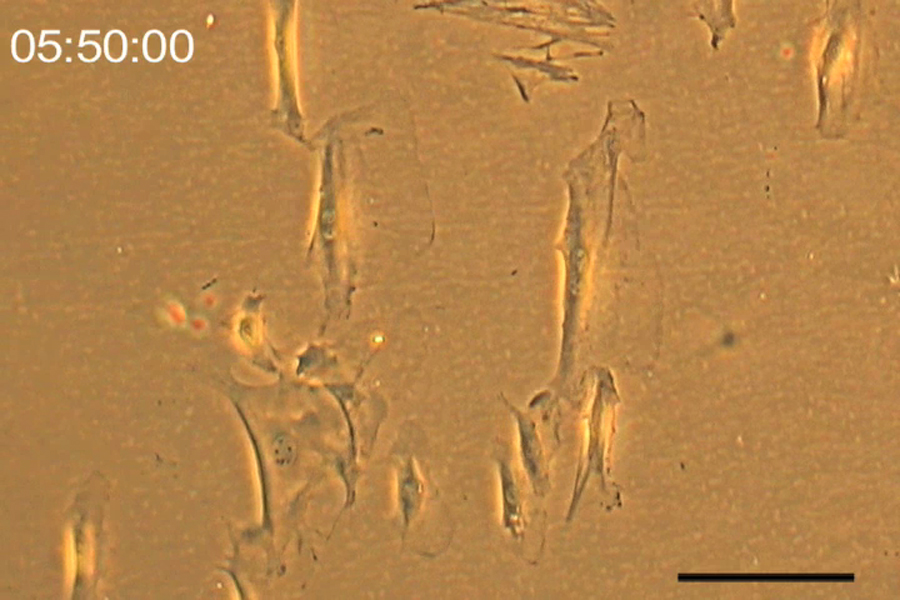
To investigate the specificity of galvanotaxis, we compared mASCs to a downstream differentiation target, osteoblasts, and fibroblasts as a control. Osteoblasts are competent migratory cells that navigate within living bone [17]. Fibroblasts are both chemotactic and electrotactic cells [18,19]. ASCs, fibroblasts, and osteoblasts clearly exhibited galvanotaxis towards the cathode. However, the osteoblasts migrated at 5.80 ± 0.40 μm/hr, 1.6 times faster than the ASCs or fibroblasts. The fibroblasts and ASCs migrated at comparable rates to each other, 3.46 ± 0.20 μm/hr and 3.59 ± 0.15 μm/hr, respectively. The osteoblasts had more remarkable lamellipodia extending further away from their cell body towards the cathode (Fig. S1 and Movie S1). The fibroblasts migrated in a similar fashion to the mASCs but more rapidly extended and retracted filopodia (Movie S2 and S3).
Calcium Transients
To ascertain potential mechanisms for galvanotaxis in ASCs, we investigated the role of intracellular calcium ([Ca2+]i) as a ubiquitous second messenger. The electric field clearly elicited a transient increase in [Ca2+]i coincident with the onset of the 6 V/cm electric field. Multiple intermittent discrete calcium events were observed lasting a minimum of 10 to 20 seconds up to 60 seconds during the electric field exposure. The responses began within 20 seconds after initiating the field and persisted until 30 seconds after the field ceased subsiding for several minutes after field termination (Movie S4). Greater than 90% of the cells responded to the field with at least one calcium event but many cells had multiple events over the duration of the field exposure (Fig. 2). The cells exhibited a threshold phenomenon; fields below 3 V/cm did not reproducibly elicit calcium responses (data not shown). This strongly suggested the participation of voltage gated calcium channels. We, therefore, investigated whether inhibiting voltage gated calcium channels could affect migration. Neither nifedipine 50 μM, L-type calcium channel inhibitor, gadolinium 100 μM, stretch activated calcium channel inhibitor, nor nickel 5 mM, nonspecific T-type inhibitor, significantly altered the migration rates. However, nickel appeared to reduce the cellular reorientation (Fig. 3).
Fig. 3.

Effects of cell pathway inhibitors (A) migration speed in a 6 hour, 10 V/cm electric field. Inhibition of PI3K by LY294002 (50μM), LY, Akt Akt inhibitor (50 μM), Akti, inhibition of ERK1/2 activation by U0126 (100 μM), U0, all showed a significant reduction in migration speed. Inhibition of ROCK by Y27632 (25 μM), Y27, L-type calcium channels Nifedipine (50 μM), Nif, stretch activated calcium channels by gadolinium chloride (100 μM), Gd, and T-type calcium channels with nickel chloride (5 mM), Ni, was not significant versus vehicle control, * p < 0.01. (B) LY, Akti, U0126, and Ni all showed significant decreases in reorientation, but blocking L-type channels and stretch-activated channels did not. Y27632 and Ni still had a significant impact on cell orientation despite their lack of affect on cell migration. # p <0.01 Actin incorporated in living cells exposed to the electric field is indicated in green, while the red is rhodamine phalloidin staining all actin. (C) cell- no electric field (D) cell in a 6 hour 10 V/cm electric field (E) Electrical stimulation with 50 μM PI3K inhibitor. (F) Electrical stimulation with 50 μM Akt inhibitor. (G) Electrical stimulation with 100 μM MAPK inhibitor. (H) Electrical stimulation with 25 μM ROCK inhibitor. Scale bar indicates 50 μm and the arrow shows the field vector.
Inhibitors of chemotactic pathways decrease galvanotaxis
We investigated intracellular pathways that control cell migration, cell membrane protrusion, and cell adhesion. Both the PI3K inhibitor, LY294002, and Akt inhibitor decreased migration speed (Fig. 3A) and also decreased the directionality toward the cathode 0.64 ± 0.04 and 0.31 ± 0.07 versus 0.77 ± 0.03 (* p < 0.05). PI3K and Akt inhibition impaired reorientation of the cells (Fig. 3B). The MAPK inhibitor U0126 also impeded migration rate and reorientation (Fig. 3A and B), but did not have a significant effect on directionality of migration toward the cathode 0.75 ± 0.03 versus 0.77 ± 0.03 for controls. Rho-associated protein kinase (ROCK) inhibitor, Y27632, was able to disrupt cytoskeletal tension and actin filament organization, but did not have an impact on cell migration speed (Fig. 3A) or directedness of migration 0.75 ± 0.04 versus 0.77 ± 0.03 for controls.
Cells were pulsed with fluorescent green actin to incorporate at sites of active actin polymerization and stained with rhodamine phalloidin to illuminate all polymerized actin. The unstimulated mASCs did not appear to polymerize new actin signifying a lack of motility (Fig. 3C). The cells exposed to only the electric field showed a clear polarization in actin accumulation in the form of lamellipodia on the cathode facing side of the cell and perpendicularly oriented actin stress fibers in red (Fig. 3D). The LY294002 treated cells showed an inability to create lamellipodia and were largely immobile after reorienting perpendicular to the electric field (Fig. 3E), while the Akt inhibitor treated cells were able to form small lamellipodia (Fig. 3F). U0126 treated cells failed to form lamellipodia on the cathode facing side of the cell and their stress fibers were smaller with a generally finer structural appearance within the actin cytoskeleton (Fig. 3G). The greatest inhibitors of cell migration LY294002 and U0126 did not show cathodal accumulation of newly polymerized actin. The perpendicular alignment of stress fibers, however, is evident in PI3K and MAPK inhibited cells as shown in Fig. 3, E and G. Alternatively, the akt inhibitor treated cells did show cathodal accumulation of newly incorporated actin as well as perpendicular stress fibers and small lamellipodia were evident on the cathode side of the cell (Fig. 3F). ROCK inhibitor, Y27632, had a remarkable impact on cell morphology without affecting cell migration rate. In fact, the evidence supports a trend toward an increased migration speed. The Y27632 treated cells failed to organize fibers perpendicular to the electric field but did show cathodal accumulation of green fluorescent actin in the form of clear lamellipodia on the cathode side of the cell (Fig. 3H).
The impact of inhibiting the MAPK pathway suggests the participation of growth factor signaling in mASC galvanotaxis similar to chemotaxis of epithelial cells in wound healing models [20]. MAPK signaling and subsequent phosphorylation of ERK1/2 regulates cell motility [21]. In fibroblasts, the activation of ERK is associated with the formation of actin structures and active ERK is recruited to new adhesion sites between the cell and substrate [22]. We looked for phosphorylated ERK1/2 and there appeared to be localized activated ERK in particular at protruding sites on the leading edge of the migrating mASCs (Fig. 4A). This was observed in a number of cells, while some cells show no ERK staining. This inconsistency suggests that ERK activation by electric fields is a transient phenomena that is not constitutively active during the lamellipod extension. Growth factors contained in FBS represent a plausible signaling source. However, galvanotaxis experiments in the absence of serum resulted in unabated cell migration (data not shown). The persistence of motility in the absence of putative soluble growth factors was confounding as well as the lack of EGF receptor polarization in response to electrical stimulation (Fig. 4B).
Fig. 4.

Phosphorylated ERK1/2 and EGF receptor localization (A) Activated ERK1/2 after a 10 V/cm, 6 hour electric field (B) Lack of EGF receptor polarization. Scale bar 50 μm, white arrow indicates the field vector.
Discussion
The purpose of this study was to characterize the effects of electric fields on a multipotent cell type such as mASCs. Our studies show that mASCs exhibited cathodal galvanotaxis in physiologic fields and migrated in a dose dependent manner to stronger electric fields. The orientation index and directionality of migration increased with increasing field strength, as well. It is well established that a number of cells respond to electric fields by migrating and reorganizing their cytoskeleton. Accordingly, the result shown here is not a new cellular phenomena, however it is important and interesting to document in mASCs, since no information was available on the effect of electric fields specifically on multipotent cells. Mouse ASCs showed equivalent migration speeds to fibroblasts and slower migration speeds compared to progeny lineage cells like osteoblasts. At some point along the differentiation cascade the cells acquire the ability to migrate at a faster rate suggesting the heterogeneity within the population may be accessed through galvanotaxis. A more thorough exploration of this topic with defined subpopulations of ASCs may yield a deeper connection between progenitor cells and their galvanotactic competence.
A number of studies support the necessity of calcium in galvanotaxis, however there is still debate in the literature as to the sufficiency of this condition [19]. Cytosolic calcium increased transiently in mASCs in response to the fields. The cell reorientation occured first followed by organization of a well-formed lamellipodium and then steady state migration towards the cathode. Since the calcium events occur within the first 20 seconds while electrophoresis of putative integral membrane signaling components will take considerably longer, it is reasonable to propose that the calcium mobilization plays an immediate role reorientation of mASCs. Impaired reorientation in the presence of T-type calcium inhibitors support this conclusion.
Leading theories for galvanotaxis in mammalian cells largely follow the chemotaxis paradigm. Ubiquitous ligand meets a steep gradient in receptors created by electrophoresis at the cathode side of the cell causing localized actin polymerization. We were able to link the electric field driven cell motility of mASCs to one of the fundamental cell motility pathways via PI3K and its downstream target Akt. The perpendicular alignment is less affected by PI3K inhibition than migration, suggesting that the rapid reorientation and stress fiber alignment might be governed by a different mechanism than the migration.
Phosphatase and tensin homolog deleted on chromosome ten (PTEN), a negative regulator of the PI3 kinase/Akt pathway, was recently reported to be stimulated by rho kinase [21]. It appears that inhibition of ROCK by Y27632 may also inhibit PTEN. This suggests that ROCK and PTEN play a role in orienting actin stress fibers perpendicularly to the electric field. While the activation of ERK at the leading edge of the migrating cell suggests growth factor signaling through the MAPK pathway, no gradient in receptor could be observed. The upstream activation of the putative receptor tyrosine kinase signaling is still unclear. EGF receptors have been implicated in electrotaxis in other cells types [20], but there is a lack of cathodal accumulation of EGF receptors in mASCs.
This work suggests growth factor activation and subsequent common cell motility pathways transduce electric fields into cell migration via the MAPK and PI3K pathways and cellular orientation may be linked to calcium transients and ROCK signaling, but further study is needed to substantiate the latter. These conclusions suggest that galvanotaxis converges on highly conserved cell migration mechanisms rather than the cells possessing a superior or differing capacity to detect electrical signals. However, differences in migratory ability between the progenitor cell and its progeny suggest galvanotaxis-based devices may be able to separate heterogeneous cell populations into meaningful subpopulations. Electric fields could also be a powerful tool in causing alignment of cells or populations of progenitors for specific applications requiring anisotropy for improved graft integrity.
Supplementary Material
Figure S1 Comparison of different types of cells’ morphologies in response to a 10 V/cm DC electric field for a duration of six hours.
Movie S1 Osteoblast galvanotaxis morphology
Movie S2 Fibroblast galvanotaxis morphology
Movie S3 Adipose-derived stromal cell galvanotaxis morphology.
Movie S4 Calcium transients in ASCs in response to a 6 V/cm electric field.
Fig. 1.

Migration direction and speed increased with increasing field strength (A) no field, 1 V/cm, 6 V/cm, 10 V/cm. (B) mASC migration rates increased with electric field strength. * p <0.001 (C) The 6 V/cm and 10 V/cm fields show significant cell reorientation while the effects of 1 V/cm are less pronounced ** p<0.0001. (D) before and (E) after 6 hour 10 V/cm field showing cell reorientation. Arrow shows field direction. Scale bar is 500 μm.
Acknowledgments
The authors thank Dr. Yue Xu for mouse osteoblasts. We also thank Dr. Antoine L. Carre for mouse fibroblasts. We thank Chris Jacobs for the use of his microscope.
This work was supported by an NIH Regenerative Medicine Training Program (T90 DK070103) and the Rodney H. Adams Fellowship.
Abbreviations
- mASCs
murine adipose-derived stromal cells
- DC
direct current
- cOBs
calvarial-derived osteoblasts
- CBS
cytoskeletal buffer containing sucrose
Footnotes
Publisher's Disclaimer: This is a PDF file of an unedited manuscript that has been accepted for publication. As a service to our customers we are providing this early version of the manuscript. The manuscript will undergo copyediting, typesetting, and review of the resulting proof before it is published in its final citable form. Please note that during the production process errors may be discovered which could affect the content, and all legal disclaimers that apply to the journal pertain.
References
- 1.Nuccitelli R. Physiological electric fields can influence cell motility, growth and polarity. Adv Cell Biol. 1988;2:213–233. [Google Scholar]
- 2.Nuccitelli R. Endogenous ionic currents and DC electric fields in multicellular animal tissues. Bioelectromagnetics. 1992;1(Suppl):147–157. doi: 10.1002/bem.2250130714. [DOI] [PubMed] [Google Scholar]
- 3.Hotary KB, Robinson KR. Endogenous electrical currents and voltage gradients in Xenopus embryos and the consequences of their disruption. Dev Biol. 1994;166:789–800. doi: 10.1006/dbio.1994.1357. [DOI] [PubMed] [Google Scholar]
- 4.Robinson KR, Messerli MA. Electric embryos: the embryonic epithelium as a generator of developmental information. In: McCaig CD, editor. Nerve Growth and Nerve Guidance. Portland Press; London: 1996. pp. 131–141. [Google Scholar]
- 5.Metcalf MEM, Borgens RB. Weak applied voltages interfere with amphibian morphogenesis and pattern. J Exp Zool. 1994;268:322–338. [Google Scholar]
- 6.Barker AT, Jaffe LF, Vanable JW., Jr The glabrous epidermis of cavies contains a powerful battery. Am J Physiol. 1982;242:R358–R366. doi: 10.1152/ajpregu.1982.242.3.R358. [DOI] [PubMed] [Google Scholar]
- 7.Song B, Zhao M, Forrester JV, et al. Electrical cues regulate the orientation and frequency of cell division and the rate of wound healing in vivo. Proc Natl Acad Sci USA. 2002;99:13577–13582. doi: 10.1073/pnas.202235299. [DOI] [PMC free article] [PubMed] [Google Scholar]
- 8.Zhao M, Song B, Pu J, et al. Electrical signals control wound healing through phosphatidylinositol-3-OH kinase-γ and PTEN. Nature. 2006;442:457–460. doi: 10.1038/nature04925. [DOI] [PubMed] [Google Scholar]
- 9.Li X, Kolega J. Effects of direct current electric fields on cell migration and actin filament distribution in bovine vascular endothelial cells. J Vasc Res. 2002;39:391–404. doi: 10.1159/000064517. [DOI] [PubMed] [Google Scholar]
- 10.Sheridan DM, Isseroff RR, Nuccitelli R. Imposition of a physiologic DC electric field alters the migratory response of human keratinocytes on extracellular matrix molecules. J Invest Dermatol. 1996;106:642–646. doi: 10.1111/1523-1747.ep12345456. [DOI] [PubMed] [Google Scholar]
- 11.Onuma EK, Hui SW. A calcium requirement for electric field-induced cell shape changes and preferential orientation. Cell Calcium. 1985;6:281–292. doi: 10.1016/0143-4160(85)90012-0. [DOI] [PubMed] [Google Scholar]
- 12.Rapp B, de Boisfleury-Chevance A, Gruler H. Galvanotaxis of human granulocytes. Dose-response curve. Eur Biophys J. 1988;16:313–319. doi: 10.1007/BF00254068. [DOI] [PubMed] [Google Scholar]
- 13.Chang PCT, Sulik GI, Soong HK, et al. Galvanotropic and galvanotactic responses of corneal endothelial cells. J Formos Med Assoc. 1996;95:623–627. [PubMed] [Google Scholar]
- 14.Zhao M, Bai H, Wang E, et al. Electrical stimulation directly induces pre-angiogenic responses in vascular endothelial cells by signaling through VEGF receptors. J Cell Sci. 2004;117:397–405. doi: 10.1242/jcs.00868. [DOI] [PMC free article] [PubMed] [Google Scholar]
- 15.Hammerick KE, James AW, Huang Z, et al. Pulsed direct current electric fields enhance osteogenesis in adipose-derived stromal cells. Tissue Eng Part A. 2010;16:917–31. doi: 10.1089/ten.tea.2009.0267. [DOI] [PMC free article] [PubMed] [Google Scholar]
- 16.Weiner OD, Servant G, Welch MD, et al. Spatial control of actin polymerization during neutrophil chemotaxis. Nat Cell Biol. 1999;1:75–81. doi: 10.1038/10042. [DOI] [PMC free article] [PubMed] [Google Scholar]
- 17.Ponte AL, Marais E, Gallay N, et al. The in vitro migration capacity of human bone marrow mesenchymal stem cells: comparison of chemokine and growth factor chemotactic activities. Stem Cells. 2007;25:1737–45. doi: 10.1634/stemcells.2007-0054. [DOI] [PubMed] [Google Scholar]
- 18.Postlethwaite AE, Keski-Oja J, Moses HL, et al. Stimulation of the chemotactic migration of human fibroblasts by transforming growth factor β. J Exp Med. 1987;165:251–256. doi: 10.1084/jem.165.1.251. [DOI] [PMC free article] [PubMed] [Google Scholar]
- 19.Brown MJ, Loew LM. Electric field-directed fibroblast locomotion involves cell surface molecular reorganization and is calcium independent. J Cell Biol. 1994;127:117–28. doi: 10.1083/jcb.127.1.117. [DOI] [PMC free article] [PubMed] [Google Scholar]
- 20.Zhao M, Pu J, Forrester JV, et al. Membrane lipids, EGF receptors, and intracellular signals colocalize and are polarized in epithelial cells moving directionally in a physiological electric field. FASEB J. 2002;16:857–9. doi: 10.1096/fj.01-0811fje. [DOI] [PubMed] [Google Scholar]
- 21.Huang C, Jacobson K, Schaller MD. MAP kinases and cell migration. J Cell Sci. 2004;117:4619–4628. doi: 10.1242/jcs.01481. [DOI] [PubMed] [Google Scholar]
- 22.Klemke RL, Cai S, Giannini AL, et al. Regulation of cell motility by mitogen-activated protein kinase. J Cell Biol. 1997;137:481–492. doi: 10.1083/jcb.137.2.481. [DOI] [PMC free article] [PubMed] [Google Scholar]
- 23.Sanchez T, Thangada S, Wu MT, et al. PTEN as an effector in the signaling of antimigratory G protein-coupled receptor. Proc Natl Acad Sci USA. 2005;102:4312–4317. doi: 10.1073/pnas.0409784102. [DOI] [PMC free article] [PubMed] [Google Scholar]
Associated Data
This section collects any data citations, data availability statements, or supplementary materials included in this article.
Supplementary Materials
Figure S1 Comparison of different types of cells’ morphologies in response to a 10 V/cm DC electric field for a duration of six hours.
Movie S1 Osteoblast galvanotaxis morphology
Movie S2 Fibroblast galvanotaxis morphology
Movie S3 Adipose-derived stromal cell galvanotaxis morphology.
Movie S4 Calcium transients in ASCs in response to a 6 V/cm electric field.