Abstract
It is well established that major retinal diseases involve distortions of the retinal neural physiology and blood vascular structures. However, the details of distortions in retinal neurovascular coupling associated with major eye diseases are not well understood. In this study, a multi-modal optical coherence tomography (OCT) imaging system was developed to enable concurrent imaging of retinal neural activity and vascular hemodynamics. Flicker light stimulation was applied to mouse retinas to evoke retinal neural responses and hemodynamic changes. The OCT images were acquired continuously during the pre-stimulation, light-stimulation, and post-stimulation phases. Stimulus-evoked intrinsic optical signals (IOSs) and hemodynamic changes were observed over time in blood-free and blood regions, respectively. Rapid IOSs change occurred almost immediately after stimulation. Both positive and negative signals were observed in adjacent retinal areas. The hemodynamic changes showed time delays after stimulation. The signal magnitudes induced by light stimulation were observed in blood regions and did not show significant changes in blood-free regions. These differences may arise from different mechanisms in blood vessels and neural tissues in response to light stimulation. These characteristics agreed well with our previous observations in mouse retinas. Further development of the multi-modal OCT may provide a new imaging method for studying how retinal structures and metabolic and neural functions are affected by age-related macular degeneration (AMD), glaucoma, diabetic retinopathy (DR), and other diseases, which promises novel noninvasive biomarkers for early disease detection and reliable treatment evaluations of eye diseases.
Keywords: Optical coherence tomography, Retina, Light stimulation, Intrinsic optical signal, Hemodynamic change
1. Introduction
The retina is a component of the neuronal network that conducts preliminary visual information processing before transmission to the brain [1]. The retina is a complex of layered structures, such as the nerve fiber layer, ganglion cell layer, inner plexiform layer, inner nuclear layer, outer plexiform layer, outer nuclear layer, inner segment, outer segment, retinal pigment epithelium and choroid. The major retinal diseases, or endothelial dysfunctions secondary to systemic diseases, can cause retinal dysfunctions that lead to severe vision loss if appropriate treatment is not promptly provided [2]. It is well known that early stages of eye diseases often affect specific retinal layers. Different morphological abnormalities, impaired physiological responses and blood vascular distortions can occur with different eye diseases [3]. Advanced and objective evaluations of retinal physiological functions are important for a better understanding of vision, which will allow better prevention of vision losses, early disease detection and improved treatment evaluation. Evaluation requires continuous monitoring of retinal neural dynamics with high spatial resolution in individual functional layers.
Optical coherence tomography (OCT) provides a noninvasive method for depth-resolved observation of biological structure images with high spatiotemporal resolution. OCT has been extensively used in retinal morphology and physiology studies for the past decade [4-9]. It has been reported that abnormal functional responses in retinal physiology can be detected prior to morphological changes, such as detectable cell loss and corresponding layer thickness changes in the retina [1]. Therefore, functional evaluation of retinal physiology is important for early detection and reliable treatment assessment of eye diseases. Detection of stimulus-evoked intrinsic optical signals (IOSs) change in the retina can be a high resolution method for objective assessment of retinal neural dysfunction due to eye diseases.
IOSs change generally include all types of stimulus-evoked optical property changes, such as transient light scattering, polarization, and absorption fluctuations in excitable tissues and cells. Dynamic optical changes can be produced by stimulus-evoked neural activity as well as subsequent hemodynamic and metabolic changes. Several groups have reported OCT recording of stimulus-evoked IOSs and hemodynamic changes [8, 10-15]. Robust IOSs change at photoreceptor outer segments were consistently observed using OCT [12]. Comparative OCT imaging of normal and mutant mouse retinas revealed IOSs distortion in diseased retinas [16]. One injured frog eye model was used to demonstrate IOSs mapping of localized retinal dysfunction[17]. Both in vitro and in vivo studies have shown that fast IOSs have different polarities and mainly originate from the photoreceptor outer segments in the retina. Light stimulus-evoked hemodynamic changes have also been demonstrated in the retina using time-lapse OCT angiography, which is a functional extension of OCT [3]. Parafoveal retinal blood flow changes have been reported by visual stimulation with a reversing checkerboard pattern using the split-spectrum amplitude-decorrelation angiography (SSADA) algorithm [13]. Doppler Fourier-domain OCT has been used to investigate total retinal blood flow changes. Total retinal blood flow was measured by summing flows in veins imaged in double-circular scans around the optic disc [15]. Doppler OCT and OCT angiography of stimulus-evoked hyperemia were demonstrated in the rat inner retina [18]. The retinal blood flow, diameter and velocity changes were measured using Doppler OCT and fundus imaging with variations in light stimulation and oxygen levels. This study also reported that neural activity increases when the retina is subjected to flickering light stimulation [14]. All of these studies used flickering light stimulation to evoke hemodynamic changes. It is known that flickering light stimulation evoked blood flow response changes in vascular diseased eyes, and thus the measurement of flicker-induced blood flow responses suggests noninvasive detection of functional microvascular alterations [19].
To the best of our knowledge, there is no study that has observed IOSs and hemodynamic changes simultaneously. In this study, a multi-modal OCT imaging system was developed to enable concurrent imaging of retinal neural activity and vascular hemodynamics. Flicker light stimulation was applied to mouse retinas to investigate subsequent retinal neural responses and hemodynamic changes in individual retinal layers and different retinal areas such as large vessel, capillary and blood-free regions.
2. Materials and Methods
Figure 1 shows a schematic diagram of the custom-designed spectral domain OCT. A wide bandwidth (Δλ = 100 nm) near infrared superluminescent diode (SLD) with a central wavelength λ of 850 nm was used as a light source to achieve high axial resolution (∼ 3 μm). The light splitting ratio between sample and reference arms was 75/25. A glass plate was placed in the reference arm for dispersion compensation. Two scanning mirrors, conjugated to the eye pupil, were used to produce two-dimensional OCT imaging. A custom-designed spectrometer was used to acquire OCT interferograms. The line CCD camera provided a line rate up to 70,000 Hz corresponding to a B-scan frame speed of 35 frames/s and 112 frames/s, as shown in Figure 2 and Figure 3∼4, respectively.
Figure 1.
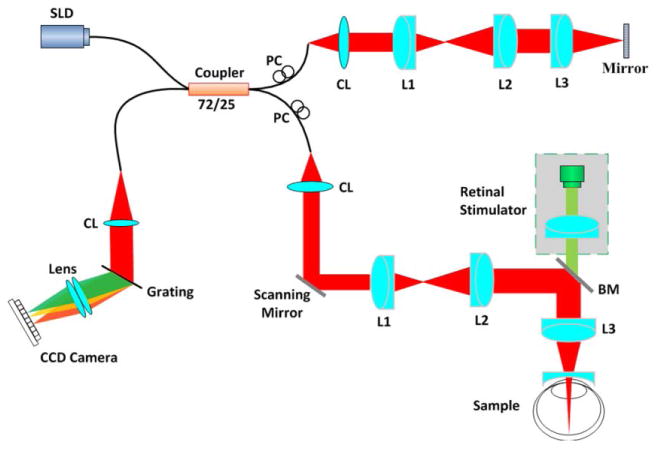
A schematic diagram of spectral domain OCT. BM: beam splitter; CL: collimation lens; L1, L2, L3: lens; PC: polarization controller; SLD: super luminescent diode. The retinal stimulator consists of a green light (λ = 505 nm) LED.
Figure 2.
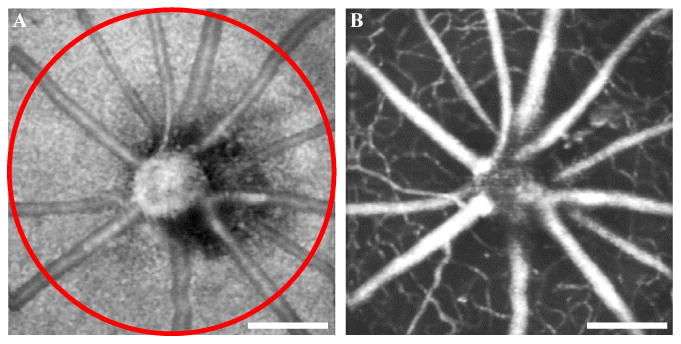
Enface OCT (A) and OCT angiography (B) image of a mouse retina across the optic nerve head (ONH). The red circle shows the scanning area (radius = 1 mm) for the experiment shown in Figure 3. Scale bars indicate 500 μm.
Figure 3.
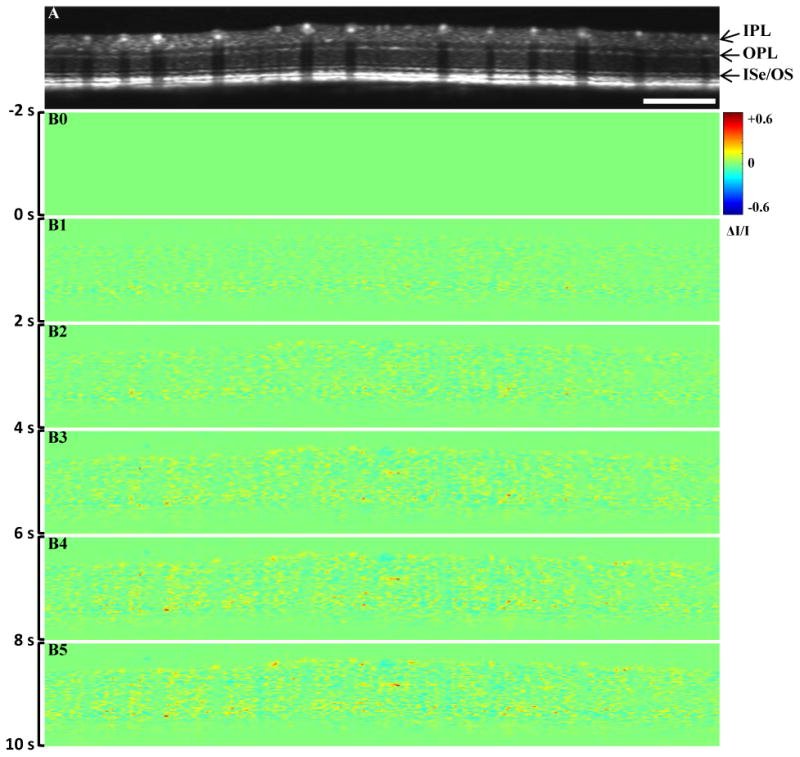
Representative in vivo IOSs imaging. (A) B-scan OCT image; (B) IOSs images at different time periods. Scale bar indicates 1 mm. IPL: inner plexiform layer, OPL: outer plexiform layer, ISe: inner segment ellipsoid, OS: outer segment
Figure 4.
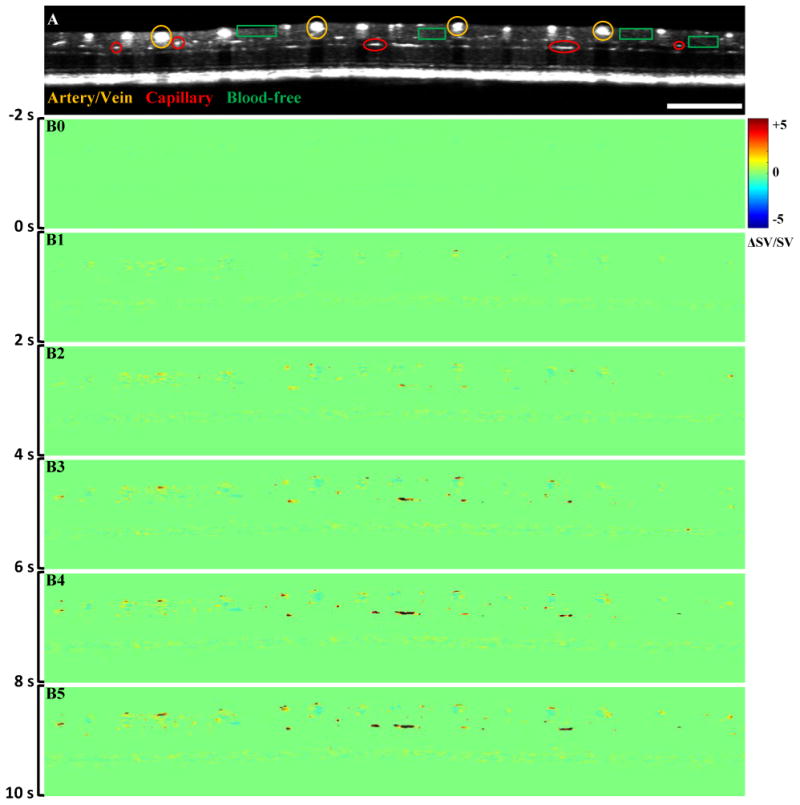
Representative in vivo OCT recording of stimulus evoked hemodynamics. (A) B-scan OCT image; (B) Hemodynamic images at different times. Scale bar indicates 1 mm.
The oversampling factor (OF) of the tomograms was calculated to minimize in-frame image blur and between-frame displacement, and thus minimized the effect of eye movements, which enabled robust observation of transient blood flow responses correlated with retinal light stimulation [14]. The OF was defined as OF = w · N/d, where w is the spot size, N is the number of sampling points, and d is the geometric width of the tomogram. In this study, we used N = 2,000 sampling points for an OCT B-scan image, and a scan width of ∼9.42 mm, leading to an OF of ∼2.55. The OCT illumination power on the mouse cornea was measured to be approximately 0.9 mW. A green LED was coupled into the imaging system with a beam splitter as a retinal light stimulator.
The study followed the Association for Research in Vision and Ophthalmology statement for the use of animals in ophthalmic and vision research. All experiments were performed following the protocols approved by the Animal Care Committee (ACC) at the University of Illinois at Chicago. Wild type mice (strain C57BL/6J, acquired from the Jackson Laboratory) that were 8 ∼ 10 weeks old were used in this study. Anesthesia was induced by a mixture of ketamine and xylazine, injected intraperitoneally. A custom designed animal holder with an ear bar and a bite bar were used to minimize movement during imaging. Ophthalmic mydriatics were applied to the eye and a cover glass along with gel was placed on the eyeball to work as a contact lens to improve image resolution and image quality by reducing optical aberrations of the mouse eye.
The experiment was conducted in a dark room with the ambient light blocked. The mice were dark adapted for 1-2 hours prior to the experiment. A 10 Hz light stimulation was applied to the retina (mean illuminance of ∼460 lux at the cornea, 100% contrast). The OCT measurements were carried out centered at the optic nerve head to extract both large vessel (artery and vein) and capillary areas simultaneously using a circular scanning method and the selected area was carefully maintained by a micro-translation stage in the animal holder in each experiment. The total OCT measurement time was 30 s in each session, including a 3 s pre-stimulation phase, a 5 s light stimulation phase and a 22 s post-stimulation phase. The OCT recording was performed continuously during the entire session.
The acquired data were processed to obtain both IOSs and hemodynamic changes with custom-designed software written in Matlab. OCT images were reconstructed from spectrum data and bulk motion was compensated with an image registration algorithm. The OCT images were used to calculate IOSs change with units of ΔI/I, where I is the averaged intensity of pre-stimulation images, pixel by pixel, and ΔI is intensity difference between post-stimulation and pre-stimulation intensity of each pixel. The image sequence of ΔI/I was reconstructed to show the stimulus evoked transient IOSs change in the retina. The OCT angiography images were computed using the speckle variance (SV) calculation method. The hemodynamic changes were generated as ΔSV/SV, where SV was the averaged SV determined from the pre-stimulation depth scans and ΔSV was the difference between the SV intensity of each frame and the averaged SV determined from the pre-stimulation depth scans. The hemodynamic image sequence indicated the SV changes relative to baseline (pre-stimulation recording). A detailed data processing procedure has been reported previously [3, 12]. Doppler OCT, which is not shown in the results, was calculated to differentiate large blood (artery and vein) vessels from capillaries.
3. Results
The enface OCT image revealed large blood vessels (Fig. 2A) and the red line shows the circular scanning area around the optic nerve head for the experimental measurements shown in Figure 3. The radius of the red circle line was ∼ 1 mm. The enface OCT angiography image revealed dense vascular information on both large vessels (artery and vein) and capillaries (Fig. 2B).
Figure 3A shows a OCT B-scan image with a circular scanning pattern, as explained in Figure 2, which illustrates the structural information of the retina without blood flow information in individual functional layers. The IOSs images (Fig. 3B) demonstrated dynamic IOSs change in individual layers over time. IOSs were observed in different retinal layers and onset times were slightly different in inner and outer segments after stimulation delivery. IOSs from photoreceptor outer segments and the inner retina were observed within 2 seconds (Fig. 3B1) and 4 seconds (Fig. 3B2) after stimulation delivery, respectively. In Figure 5A, robust rapid IOSs were observed from ISe/OS segments immediately after stimulation delivery and unambiguous IOSs change, with a delayed time course, were also observed from the inner plexiform layer (IPL) and outer plexiform layer (OPL) in the retina.
Figure 5.
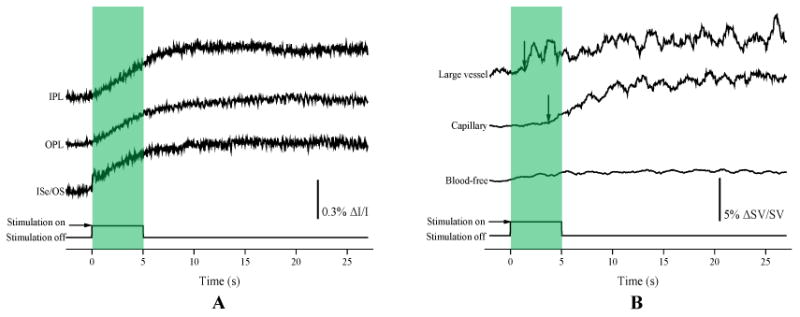
(A) IOSs change curves from different retinal layers calculated from experimental trials corresponding to Fig. 3B. (B) Hemodynamic change curves from large vessel, capillary and blood-free regions from experimental trials corresponding to Figs 4B. Arrowheads indicate the onset and time-to-peak.
The blood information, including blood flow, vessel size and location, was clearly observed in OCT angiography images at individual functional layers, such as the IPL and OPL (Fig. 4A). Dynamic OCT angiography images (Fig. 4B) demonstrated hemodynamic angiographic changes in large vessel and capillary regions over time. The hemodynamic angiographic changes observed within 2 s (Fig. 4B1) and 4 s (Fig. 4B2) reached their maximum within 10 s (Fig. 4B5) after the stimulus onset in the large vessel and capillary regions, respectively. The blood-free region did not show significant changes over time. In Figure 5B, the dynamic angiographic changes occurred at 1.4 s and 3.7 s and reached their maximum at 2.3 s and 10.4 s after the stimulus onset in the large vessel and capillary regions, respectively. The hemodynamic changes in blood-free regions showed slight changes compared to the vessel regions.
4. Discussion
In this study, a custom-designed functional OCT was developed and validated to demonstrate the feasibility of concurrent imaging of IOSs and hemodynamic changes evoked by flickering light stimulation. The robust IOSs were observed as early as 28 ms at outer segments after the stimulation onset [Figs. 3 and 5A]. These IOSs change exhibited an excellent correlation with our previous results [2, 12]. A custom-designed OCT with a high spatiotemporal resolution revealed robust IOSs as early as 1.1 ms after retinal stimulation in in vivo structural and functional imaging of the mouse retina. Also, it showed precise identification of the anatomic sources of IOSs. The fast IOSs were predominantly confined to the photoreceptor outer segment after the light stimulation onset. These IOSs change can be explained by cell swelling, shrinkage and membrane depolarization resulting from the ionic fluxes. Because these transitions were produced by ionic fluxes, they were associated with membrane polarization, which is supported by the voltage dependence on the amount of light scattered by Aplysia axons during action potentials [1]. However, the onset time was slightly different compared to our previous study. This might result from differences in the system sensitivity and temporal resolution. Slow IOSs were also unambiguously observed from the inner retinal layers (IPL and OPL) [Figs. 3 and 5A]. The slow IOSs may involve complications of nonlinear information processing in the retina as well as retinal adaptation to the stimulation conditions. Light-induced hemodynamic changes may also partially contribute to slow IOSs.
The hemodynamic changes in large vessel, capillary and blood-free regions showed different responses after simulation delivery [Figs. 4 and 5A]. Most significant responses were observed from the large vessel and capillary regions. These differential hemodynamic responses may be due to the differences in neuronal metabolic demands. Major blood vessels on the retinal surface, such as arteries and veins, could be dilated by flickering light stimulation to produce increased blood flow to meet increased oxygen and glucose needs of active neurons in the inner and middle retinal layers [20]. The oxygen and nutrients were supplied to synapses in the inner plexiform retina and OPL by blood vessels in the intermediate layer and deep layer, respectively. Also, synapses in both layers can be activated by stimulation conditions [20, 21]. We speculate that the IOSs change in the IPL and OPL mostly resulted from the hemodynamic changes. Further investigation of the hemodynamic changes in arteries, veins and capillaries at different retinal layers is required to understand the origination of the observed slow IOSs.
In summary, this study demonstrated the feasibility of imaging time resolved IOSs and hemodynamic responses simultaneously in response to flickering light stimulation. The fast photoreceptor IOSs may be attributed to the early stage of photo-transduction before hyperpolarization of the retinal photoreceptors [22]. The hemodynamic responses at different regions, probably due to different metabolic demands, showed significant increases in the large vessel and capillary regions but showed no significant changes in the blood-free region. Further investigation is required to achieve an in depth understanding of the IOSs sources and mechanisms in the inner retina, which may lead to a new method to advance the study and diagnosis of glaucoma and other eye diseases that may affect inner retinal functions.
Acknowledgments
This research was supported in part by NIH grants R01 EY023522, R01 EY024628, P30 EY001792; by NSF grant CBET-1055889; by Richard and Loan Hill endowment.
References
- 1.Yao X, Wang B. Intrinsic optical signal imaging of retinal physiology: a review. J Biomed Opt. 2015;20(9):090901. doi: 10.1117/1.JBO.20.9.090901. [DOI] [PMC free article] [PubMed] [Google Scholar]
- 2.Wang B, Lu Y, Yao X. In vivo optical coherence tomography of stimulus-evoked intrinsic optical signals in mouse retinas. J Biomed Opt. 2016;21(9):96010. doi: 10.1117/1.JBO.21.9.096010. [DOI] [PMC free article] [PubMed] [Google Scholar]
- 3.Son T, Wang B, Thapa D, et al. Optical coherence tomography angiography of stimulus evoked hemodynamic responses in individual retinal layers. Biomed Opt Express. 2016;7(8):3151–62. doi: 10.1364/BOE.7.003151. [DOI] [PMC free article] [PubMed] [Google Scholar]
- 4.Adhi M, Badaro E, Liu JJ, et al. Three-Dimensional Enhanced Imaging of Vitreoretinal Interface in Diabetic Retinopathy Using Swept-Source Optical Coherence Tomography. Am J Ophthalmol. 2016;162:140–149 e1. doi: 10.1016/j.ajo.2015.10.025. [DOI] [PMC free article] [PubMed] [Google Scholar]
- 5.Sugiyama S, Hong YJ, Kasaragod D, et al. Birefringence imaging of posterior eye by multi-functional Jones matrix optical coherence tomography. Biomed Opt Express. 2015;6(12):4951–74. doi: 10.1364/BOE.6.004951. [DOI] [PMC free article] [PubMed] [Google Scholar]
- 6.Costa RA, Skaf M, Melo LA, Jr, et al. Retinal assessment using optical coherence tomography. Prog Retin Eye Res. 2006;25(3):325–53. doi: 10.1016/j.preteyeres.2006.03.001. [DOI] [PubMed] [Google Scholar]
- 7.Yao XC, Yamauchi A, Perry B, et al. Rapid optical coherence tomography and recording functional scattering changes from activated frog retina. Appl Opt. 2005;44(11):2019–23. doi: 10.1364/ao.44.002019. [DOI] [PubMed] [Google Scholar]
- 8.Bizheva K, Pflug R, Hermann B, et al. Optophysiology: depth-resolved probing of retinal physiology with functional ultrahigh-resolution optical coherence tomography. Proc Natl Acad Sci U S A. 2006;103(13):5066–71. doi: 10.1073/pnas.0506997103. [DOI] [PMC free article] [PubMed] [Google Scholar]
- 9.Wang B, Zhang Q, Lu R, et al. Functional optical coherence tomography reveals transient phototropic change of photoreceptor outer segments. Opt Lett. 2014;39(24):6923–6. doi: 10.1364/OL.39.006923. [DOI] [PMC free article] [PubMed] [Google Scholar]
- 10.Srinivasan VJ, Wojtkowski M, Fujimoto JG, et al. In vivo measurement of retinal physiology with highspeed ultrahigh-resolution optical coherence tomography. Opt Lett. 2006;31(15):2308–10. doi: 10.1364/ol.31.002308. [DOI] [PubMed] [Google Scholar]
- 11.Hillmann D, Spahr H, Pfaffle C, et al. In vivo optical imaging of physiological responses to photostimulation in human photoreceptors. Proc Natl Acad Sci U S A. 2016;113(46):13138–13143. doi: 10.1073/pnas.1606428113. [DOI] [PMC free article] [PubMed] [Google Scholar]
- 12.Zhang Q, Lu R, Wang B, et al. Functional optical coherence tomography enables in vivo physiological assessment of retinal rod and cone photoreceptors. Sci Rep. 2015;5:9595. doi: 10.1038/srep09595. [DOI] [PMC free article] [PubMed] [Google Scholar]
- 13.Wei E, Jia Y, Tan O, et al. Parafoveal retinal vascular response to pattern visual stimulation assessed with OCT angiography. PLoS One. 2013;8(12):e81343. doi: 10.1371/journal.pone.0081343. [DOI] [PMC free article] [PubMed] [Google Scholar]
- 14.Werkmeister RM, Vietauer M, Knopf C, et al. Measurement of retinal blood flow in the rat by combining Doppler Fourier-domain optical coherence tomography with fundus imaging. J Biomed Opt. 2014;19(10):106008. doi: 10.1117/1.JBO.19.10.106008. [DOI] [PubMed] [Google Scholar]
- 15.Wang Y, Fawzi AA, Tan O, et al. Flicker-induced changes in retinal blood flow assessed by Doppler optical coherence tomography. Biomed Opt Express. 2011;2(7):1852–60. doi: 10.1364/BOE.001852. [DOI] [PMC free article] [PubMed] [Google Scholar]
- 16.Zhang QX, Zhang Y, Lu RW, et al. Comparative intrinsic optical signal imaging of wild-type and mutant mouse retinas. Opt Express. 2012;20(7):7646–54. doi: 10.1364/OE.20.007646. [DOI] [PMC free article] [PubMed] [Google Scholar]
- 17.Zhang QX, Lu RW, Curcio CA, et al. In vivo confocal intrinsic optical signal identification of localized retinal dysfunction. Invest Ophthalmol Vis Sci. 2012;53(13):8139–45. doi: 10.1167/iovs.12-10732. [DOI] [PMC free article] [PubMed] [Google Scholar]
- 18.Radhakrishnan H, Srinivasan VJ. Multiparametric optical coherence tomography imaging of the inner retinal hemodynamic response to visual stimulation. J Biomed Opt. 2013;18(8):86010. doi: 10.1117/1.JBO.18.8.086010. [DOI] [PMC free article] [PubMed] [Google Scholar]
- 19.Told R, Palkovits S, Boltz A, et al. Flicker-induced retinal vasodilatation is not dependent on complement factor H polymorphism in healthy young subjects. Acta Ophthalmol. 2014;92(7):e540–5. doi: 10.1111/aos.12433. [DOI] [PMC free article] [PubMed] [Google Scholar]
- 20.Kornfield TE, Newman EA. Regulation of blood flow in the retinal trilaminar vascular network. J Neurosci. 2014;34(34):11504–13. doi: 10.1523/JNEUROSCI.1971-14.2014. [DOI] [PMC free article] [PubMed] [Google Scholar]
- 21.Lau JC, Linsenmeier RA. Oxygen consumption and distribution in the Long-Evans rat retina. Exp Eye Res. 2012;102:50–8. doi: 10.1016/j.exer.2012.07.004. [DOI] [PMC free article] [PubMed] [Google Scholar]
- 22.Lu Y, Wang B, Pepperberg DR, et al. Stimulus-evoked outer segment changes occur before the hyperpolarization of retinal photoreceptors. Biomedical Optics Express. 2017;8(1):38–47. doi: 10.1364/BOE.8.000038. [DOI] [PMC free article] [PubMed] [Google Scholar]


