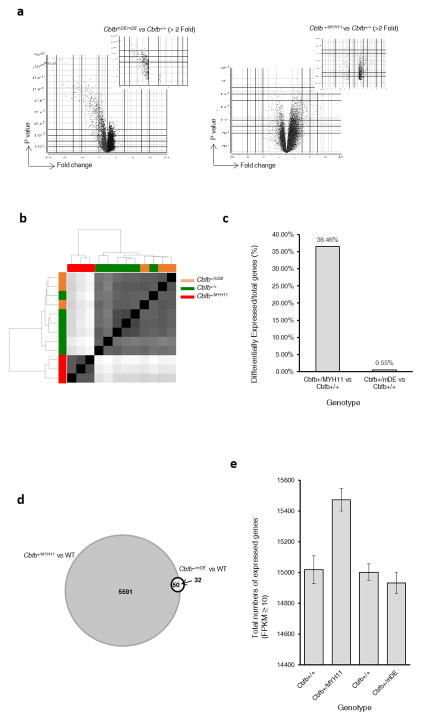
Figure 2.
Gene expression changes in Cbfb+/mDE and CbfbmDE/mDE mice. (a) Volcano plots showing gene expression profile differences in PB cells between CbfbmDE/mDE and Cbfb+/+ embryos (left panel) and between Cbfb+/MYH11 and Cbfb+/+ embryos (right panel). (b) Principal component analysis of RNA-Seq data shows that the gene expression profile of Cbfb+/mDE C-KIT+ cells is more similar to C-KIT+ cells in Cbfb+/+mice. (c) Percentages of differentially expressed genes vs. all expressed genes (average of three samples). (d) Venn diagram of differentially expressed genes in Cbfb+/MYH11 and Cbfb+/mDE C-KIT+ cells (p ≤0.05, fold change ≥1.5). (e) Total numbers of expressed genes (obtained with featureCounts11; average FPKM from three samples ≥ 10) in C-KIT+ cells from mice of the indicated genotype.

