Abstract
Objectives
Corticosteroid treatment of paediatric leukaemia patients can lead to osteonecrosis (ON). We determined whether bone marrow oedema (BME) is an early sign of progressive ON and eventual bone collapse.
Methods
In a retrospective study, two radiologists reviewed MR imaging characteristics of 47 early stage epiphyseal ON in 15 paediatric and adolescent leukaemia patients. Associations between BME on initial imaging studies and subchondral fracture, disease progression and bone collapse were assessed by Cochran-Mantel-Haenszel tests. Differences in time to progression and bone collapse between lesions with and without oedema were assessed by log rank tests.
Results
47 ON were located in weight-bearing joints, with 77% occurring in the femur. 17 lesions progressed to collapse, 2 lesions worsened without collapse and 28 remained stable or improved. BME was significantly associated with subchondral fracture (p=0.0014), disease progression (p=0.0015) and bone collapse (p<0.001), with a sensitivity and specificity of 94% and 77%, respectively, for bone collapse. Time to progression for ON with oedema was 2.7 years (95% CI: 1.7–3.4); while the majority of no-oedema ON were stable (p=0.0011).
Conclusions
BME is an early sign of progressive ON and eventual bone collapse in paediatric and adolescent leukaemia patients.
Keywords: Bone Marrow, Oedema, Osteonecrosis, Fractures, Bone, Child
Introduction
Osteonecrosis (ON) is a devastating complication of paediatric cancer therapy with high-dose corticosteroids, affecting 15–47% of leukaemia and lymphoma patients [1–4] and progressing to irreversible bone collapse in up to 22% of patients with clinical risk factors [5]. Unfortunately, joint-preserving interventions are only effective as a preventative measure, when performed prior to actual bone collapse [6; 7]. However, since 60–80% of early stage ON remain stable or even resolve [1–3; 8], patients often wait with hopes of spontaneous resolution. While this strategy is suitable for those patients whose lesions resolve, it unfortunately could miss the critical window of opportunity to prevent collapse of progressive lesions. When patients with progressive lesions finally present with major morbidities such as severe pain and limited ambulation, rescue interventions such as surgical decompression is often too late to save the affected joint [1–3; 8]. This leads to devastating outcomes for those with progressive disease, such as need for total joint replacement.
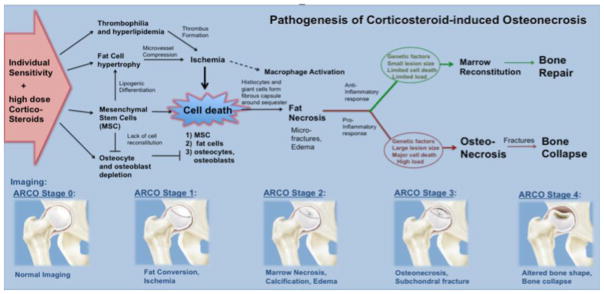
Corticosteroid-induced ON is a multifactorial process (Fig. 1), which involves corticosteroid-induced ischemia and direct induction of marrow cell death through corticosteroid receptor-mediated apoptosis induction [9; 10]. While there are known risk factors for the development of ON in paediatric leukaemia patients, such as dose, type and route of corticosteroid administration as well as older age, pain, and articular surface involvement [5], little is known about biomarkers that could predict unfavourable outcomes for a given lesion [11]. This makes it difficult to select lesions that may benefit from preventive interventions rather than a “wait and watch” approach. A recent study proposed an imaging-based classification of ON in cancer patients, but the prognostic value of specific imaging findings in this classification has not been validated so far [12]. Defining specific imaging biomarkers that can predict impeding bone collapse would substantially improve our ability to offer patients curative interventions before irreversible morbidities occur which require total joint replacement.
Fig. 1.
Pathogenesis of corticosteroid-induced osteonecrosis.
It was described in adult patients with symptomatic avascular necrosis of the femoral head that the presence of bone marrow oedema (BME) on magnetic resonance imaging (MRI) correlated with the presence of microfractures or early subchondral fractures on histopathology [13]. Based on these reports, the purpose of our study was to determine, whether a BME would be an early sign of progressive ON and eventual bone collapse in paediatric and adolescent leukaemia patients. If confirmed, this new imaging biomarker could be used to stratify high-risk patients to joint-preserving interventions.
Materials and Methods
Patient population
This retrospective study was approved by the institutional review board (IRB) at our institution. Informed consent was waived because of the non-invasive and retrospective nature of our analyses and the inability or difficulty to locate most of the patients who had completed their treatment. We identified MRI studies in our hospital from July 2003 until February 2016 of paediatric and adolescent patients with leukaemia who fulfilled the following inclusion criteria: (1) age less than 21 years, (2) diagnosis of leukaemia, (3) treatment with high dose corticosteroids (> 6000 mg prednisolone equivalent/m2) and (4) initial MRI with findings consistent with osteonecrosis (in any epiphysis). ON was defined as a focal lesion in the proximal/distal epiphysis of the femur or tibia, surrounded by a characteristic serpentine low signal line. Optional MRI findings that confirmed the diagnosis of ON were a characteristic double line on T2-weighted images (inner hyperintense granulation tissue and outer hypointense fibrosis/sclerosis) and fatty centre. Patients were excluded if: (1) there were metaphyseal or diaphyseal ON only (no epiphyseal involvement), (2) lesions were located in non-weight bearing joints (3) initial MRI already showed advanced ON with bone collapse or (4) lack of follow up imaging. We included 9 female (mean age: 13.5 +/− 3.0 years; range: 10–18) and 6 male (mean age: 16.8 +/− 2.5 years; range: 14–21) patients. Patients received their baseline MRI due to clinical symptoms such as joint pain.
Osteonecrosis assessment
Baseline MRIs were performed on a 3 Tesla (T) MRI scanner (Discovery 750, GE Healthcare, Milwaukee, Wisconsin, USA) (n=11 patients) or a 1.5 T MRI scanner (Optima 450w or Signa Excite, GE Healthcare) (n=4 patients). A personalized approach was used to ensure minimal scan time and to image the specific joint regions. Repetition times (TRs) and echo times (TEs) were adjusted to ensure an adequate signal-to-noise ratio for all patients. At least two anatomical orientations were acquired, using the following sequences: T1-weighted sequences (TR = 366 – 1323 ms, TE = 8 – 35 ms, flip angle (α) = 90°–142°, slice thickness (SL) = 2.5 – 5 mm); T2 fat saturated (fs) Fast Spin Echo (FSE) sequences (TR/TE/α = 3000 – 7500/49 – 105/90 – 142, SL = 2.5 – 6 mm, Echo Train Length = 6 – 8); proton density (PD) fs sequences (TR/TE/α = 2952 – 4906/15 – 35/15 – 142, SL = 2.5 – 4 mm) and short tau inversion recovery (STIR) sequences (TR/TE/α = 3400 – 5400/27 – 51/90, SL = 2.5 – 5 mm, Inversion Time = 149 – 168 ms).
Follow up imaging to monitor outcome included MRI (n=16 in 10 patients) and x-rays (n=22 in 15 patients) after the baseline study (mean 19 +/− 15 months).
Two paediatric radiologists (Heike E. Daldrup-Link, Shanshan Bao) with 13 and 6 years of experience evaluated baseline MRIs and follow up imaging studies in consensus, according to the following criteria: (i) presence or absence of BME, defined as ill defined T1 hypointense and T2 hyperintense signal in or around the ON lesion. (ii) presence or absence of a subchondral fracture, (iii) size of ON (<15%, 15–30% or >30% joint surface involved) [14], and (iv) severity of the ON lesion from Stage 1 to 4, based on a modified version of the Association Research Circulation Osseous (ARCO) guidelines [14]. Follow up MR imaging studies and radiographs were staged as described above and evaluated for presence or absence of disease progression, defined as higher ARCO stage compared to the baseline scan, and presence or absence of bone collapse.
Statistical Analyses
The presence or absence of BME was displayed in contingency tables against presence or absence of a subchondral fracture and against outcomes of presence or absence of bone collapse. Associations between presence of BME on initial imaging studies and subchondral fracture, disease progression (vs. stability/improvement) and eventual bone collapse were assessed by Cochran-Mantel-Haenszel tests stratified on patient, with calculation of (unadjusted) sensitivity and specificity. Differences in time to progression and time to bone collapse (both from treatment initiation for leukaemia) between lesions with and without oedema were assessed by log rank tests, stratified by patient. All statistical analyses were done with Stata Release 14.1 (StataCorp LP, College Station, TX). A p-value <0.05 was considered to indicate significant differences for all analyses.
Results
According to the inclusion criteria, we identified 73 ON lesions in 23 paediatric and adolescent leukaemia patients who underwent high dose corticosteroid therapy. Of these, 26 lesions were excluded from the analysis because they were not located in the epiphysis (n=18), or already demonstrated joint surface impression or collapse at the time of diagnosis (n=4), or were located in non-weight bearing joints (n=4). We focused more detailed statistical analyses on 47 lesions in 15 patients that demonstrated early stage, pre-collapse epiphyseal ON in weight bearing joints, which would be considered at risk for collapse and could be referred to joint-preserving interventions, such as decompression surgery. These patients ranged in age from 10 to 20 (mean age 14.8 years +/− 3.1 years).
Time from initiation of treatment for leukaemia to initial imaging ranged from 0.3 to 6.6 years (median = 1.1). Lesion size at baseline encompassed less than 15% of the joint surface (n=4), 15–30% (n=11) or more than 30% of the joint surface (n=32). Not surprisingly, larger lesions showed a statistically significant higher frequency of BME than smaller lesions (p = 0.036; Table 1). 23 lesions demonstrated an associated BME at the time of diagnosis, while 24 lesions showed no signs of BME. On follow up imaging scans, 30 lesions remained stable or improved (Fig. 2, 3) and 17 lesions worsened or collapsed (Fig. 4).
Table 1.
Number and percentages with lesion size and oedema
| Lesion Size | BME | Total | |
|---|---|---|---|
| No | Yes | ||
| < 15% | 4 (100) | 0 (0) | 4 (100) |
| 15–30% | 11 (100) | 0 (0) | 11 (100) |
| > 30% | 9 (28) | 23 (72) | 32 (100) |
| Total | 24 (51) | 23 (49) | 47 (100) |
Note. Data are numbers of lesions with percentages in parentheses
BME = Bone Marrow Oedema
Cochran-Mantel-Haenszel test p = 0.036
Kendall’s tau-b = 0.64
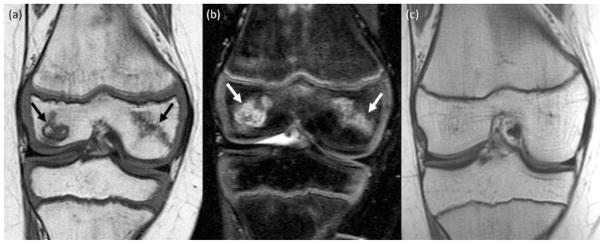
Fig. 2.
Spontaneous resolution of ON in a 10-year old girl. (a) Coronal T1-weighted image (TR/TE/Flip angle: 516/17/90) and (b) coronal T2-weighted fat saturated Fast Spin-Echo image (TR/TE/Flip angle: 3700/61/90) shows ON in the medial and lateral epiphysis of the distal femur (arrows). (c) Follow up MRI 3 years later reveals complete resolution of the osteonecrosis in the epiphysis of the distal femur.
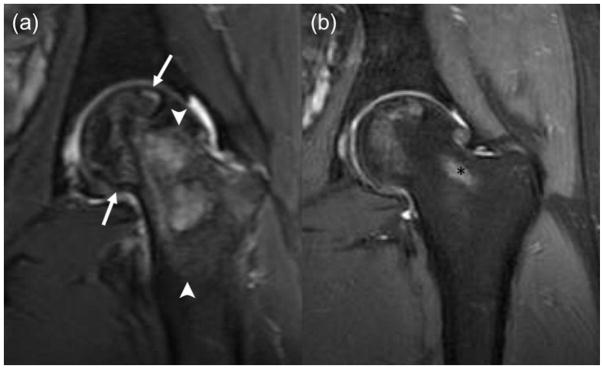
Fig. 3.
Nearly complete resolution of ON after decompression surgery in a 20-year old boy at diagnosis. (a) Coronal T2-weighted fat saturated Fast Spin-Echo image (TR/TE/Flip angle: 4356/49/111) showing large ON in the left femoral head (arrows) with extensive bone marrow oedema (arrowheads) in the adjacent head and neck and (b) coronal PD fs image (TR/TE/Flip angle: 2798/35/111) with only minimal residual ON in femoral head after decompression surgery. Of note, partially shown postprocedural tract (*).
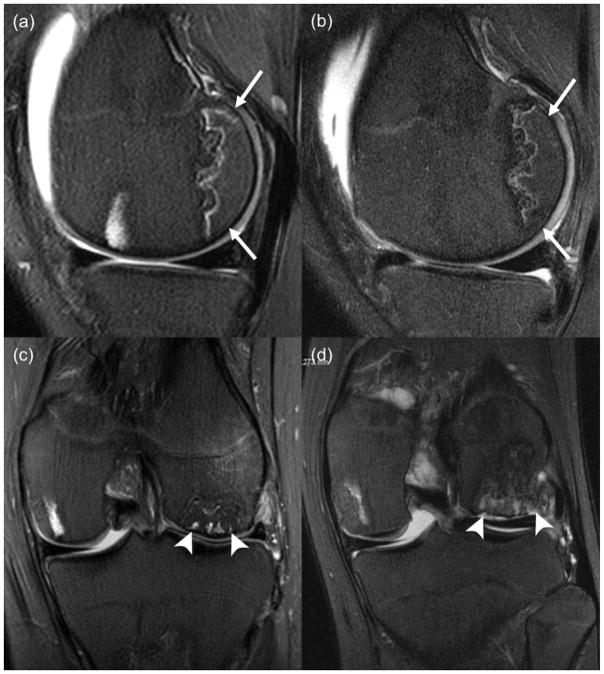
Fig. 4.
Stable and progressing ON in an 11-year old boy. (a) Sagittal T2-weighted fat saturated Fast Spin-Echo image (TR/TE/Flip angle: 3000/56/90) at end of therapy shows ON in the non-weight-bearing posterior epiphysis of the distal femur (white arrow), without marrow oedema. (b) Follow up MRI 11 months later shows stable appearance of ON; (c) Coronal T2-weighted fat saturated Fast Spin-Echo image (TR/TE/Flip angle: 3000/53/90) at end of therapy shows ON in the weight-bearing aspect of the lateral femoral condyle (white arrowhead), with associated marrow oedema; (d) Follow up MRI 11 months later shows a subchondral fracture and impression of the joint surface (arrowhead).
Three-quarters (36/47) of the epiphyseal lesions were located in the femur (Supplementary Table 1) with a marginal trend for more lesions in the femur than tibia (p = 0.034 by one-sided Fisher’s exact test). Almost all cases of bone marrow oedema (21/23), all cases of subchondral fracture (16/16) and all cases of bone collapse (17/17) were in the femur rather than the tibia. Interestingly, of 11 lesions in the proximal tibia analysed in this study, none progressed to collapse, even though 2 had BME on initial imaging.
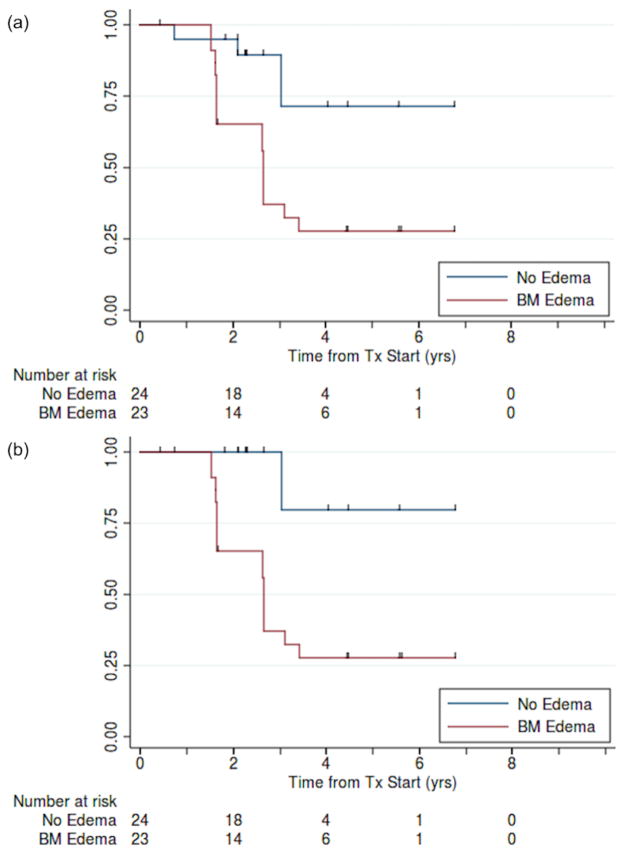
There was a significant association between presence of BME and subchondral fracture (p = 0.0014; Table 2a). Time to progression and time to bone collapse for patients with oedema was 2.7 years (95% CI: 1.7–3.4); when fewer than half of the no-oedema patients had progressed (p = 0.0011; Fig. 5a/b). There was a significant association between presence of oedema on imaging and eventual disease progression (unadjusted for time at risk; p = 0.0015; Table 2b) and bone collapse (p < 0.001; Table 3a). Overall, the presence of BME had a sensitivity and specificity of 94% and 77%, respectively, for eventual bone collapse.
Table 2a.
Number and percentages with oedema and subchondral fracture
| BME | Subchondral Fracture | Total | |
|---|---|---|---|
| No | Yes | ||
| No | 24 (100) | 0 (0) | 24 (100) |
| Yes | 7 (30) | 16 (70) | 23 (100) |
| Total | 31 (66) | 16 (34) | 47 (100) |
Note. Data are numbers of lesions with percentages in parentheses
BME = Bone Marrow Oedema
Cochran-Mantel-Haenszel test p = 0.0014
Kendall’s tau-b = 0.73
Fig. 5.
Kaplan-Meier estimates of (a) progression-free and (b) bone collapse-free survival for patients with and without bone-marrow oedema (N = 47).
Table 2b.
Number and percentages with oedema and eventual disease progression
| BME | Outcome | Total | |
|---|---|---|---|
| Stable/Improved | Worsened | ||
| No | 21 (88) | 3 (12) | 24 (100) |
| Yes | 7 (30) | 16 (70) | 23 (100) |
| Total | 28 (60) | 19 (40) | 47 (100) |
Note. Data are numbers of lesions with percentages in parentheses
BME = Bone Marrow Oedema
Cochran-Mantel-Haenszel test p = 0.0015
Kendall’s tau-b = 0.58
Sensitivity = 84% (60–97%)
Specificity = 75% (55–89%)
Table 3a.
Number and percentages with oedema and eventual bone collapse
| BME | Collapse | Total | |
|---|---|---|---|
| No | Yes | ||
| No | 23 (96) | 1 (4) | 24 (100) |
| Yes | 7 (30) | 16 (70) | 23 (100) |
| Total | 30 (64) | 17 (36) | 47 (100) |
Note. Data are numbers of lesions with percentages in parentheses
BME = Bone Marrow Oedema
Cochran-Mantel-Haenszel test p < 0.001
Kendall’s tau-b = 0.68
Sensitivity = 94% (71–99%)
Specificity = 77% (58–90%)
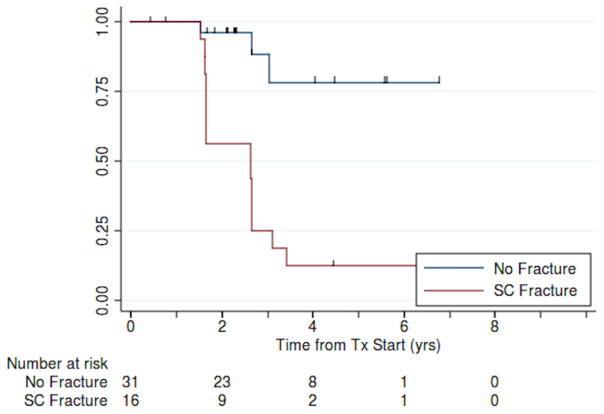
There was also a significant association between presence of a subchondral fracture on imaging and eventual bone collapse (unadjusted for time at risk, Table 3b). Time to progression for patients with subchondral fracture was 2.6 years (95% CI: 1.7–2.7) years; fewer than half the no-fracture patients had progressed (p<0.001; Fig. 6).
Table 3b.
Number and percentages with subchondral fracture and eventual bone collapse
| Subchondral Fracture | Collapse | Total | |
|---|---|---|---|
| No | Yes | ||
| No | 28 (90) | 3 (10) | 31 (100) |
| Yes | 2 (13) | 14 (87) | 16 (100) |
| Total | 30 (64) | 17 (36) | 47 (100) |
Note. Data are numbers of lesions with percentages in parentheses
Cochran-Mantel-Haenszel test p < 0.001
Kendall’s tau-b = 0.77
Sensitivity = 82% (57–96%)
Specificity = 93% (78–99%)
Fig. 6.
Kaplan-Meier estimates of bone collapse-free survival for patients with and without subchondral fracture (N = 47).
Discussion
Our results demonstrate that the presence of BME indicates progressive ON and eventual bone collapse in paediatric and adolescent leukaemia patients who received high dose corticosteroid therapy. In addition, the lack of BME on initial imaging is strongly correlated with stability or improvement of ON. Therefore, the presence or absence of BME on MRI could be used to stratify patients with ON to either joint-preserving interventions or a wait and watch approach.
There are numerous preclinical and clinical imaging investigations that demonstrate the effects of corticosteroids on bone marrow [9; 15–17]. In addition to indirect effects from induction of ischemia, corticosteroids have direct effects on marrow cells through corticosteroid receptor-mediated apoptosis induction [9]. Death of mesenchymal stromal cells (MSCs), osteoblasts, and osteoclasts leads to decreased bone turnover and decreased trabecular thickness. Furthermore, corticosteroids enhance MSC differentiation into adipocytes and inhibit MSC differentiation into osteocytes and osteoblasts. This process is accentuated by corticosteroid-induced activation of osteoclasts, prolonged lifespan of osteoclasts, and immune-modulating effects. The resulting disruption of osteocyte network and inhibition of repair processes in bone leads to a vicious cycle of ischemia, cell death, trabecular disruption, fractures, and lack of repair, which ultimately results in bone collapse [9].
Various magnetic resonance imaging (MRI)-based staging systems have been proposed to identify different stages of ON, but all are limited in their ability to discriminate between reversible and progressive ON [1–3; 8]. Although marrow ischemia is an early sign of ON [2; 18; 19], it cannot be used to distinguish between bones that remain intact versus those that eventually progress to collapse. Other imaging studies describe direct and indirect imaging signs of fractures as sequela of advanced ON [5; 8; 18]. Unfortunately, by the time macroscopic epiphyseal fractures are already present, bone pain and impaired joint motion become clinically apparent [5; 8; 18], and decompression procedures to save the joint are not possible any more. As early interventions are required to prevent joint destruction and long-term disabilities, we must identify patients with ON and risk for bone collapse before clinical symptoms are apparent [19]. BME is a common response to trauma [20]. It would therefore be rational to assume that BME might be the earliest sign of microfractures in ON, which poses a risk of bone collapse. Our finding is in accordance with a recent study performed in adult patients that showed a correlation of ON-related BME with the presence of subchondral fractures and microfractures on histology [13].
The location of ON within a bone is important, with epiphyseal lesions posing a risk for collapse while diaphyseal or metaphyseal osteonecrosis usually do not lead to biomechanical or clinical problems [11]. We therefore focused our investigations on epiphyseal ON. We also found in accordance with the literature that the femoral head and femoral condyles were the most common sites of steroid-induced osteonecrosis and that larger lesion size was associated with worse outcomes [11]. Accordingly, larger lesion size was correlated with the presence of BME.
Surprisingly, we noticed that all ON of the proximal tibia in our study remained stable or improved on follow up imaging with none progressing to collapse (0%), even though 7 of these lesions were quite large, encompassing over 30% of the articular surface. While there have been several analyses of medial tibial plateau ON specifically, the natural evolution of these lesions has not been clearly defined [21]. Of 11 tibial ON in our study, 9 did not demonstrate BME on baseline imaging (82%), in keeping with our hypothesis that BME and eventual collapse are correlated. The lack of collapse of proximal tibial ON can be explained by differences in trabecular structure between the proximal and distal femur and the proximal tibia: The proximal tibia has a reported denser spongiosa and higher biomechanical strength [22].
This study was limited due to its retrospective nature and lack of histopathological correlations of imaging findings. However, to our knowledge, this is the first description of a predictive imaging biomarker of progressive ON in paediatric and adolescent leukaemia patients. Previous findings in adults [13; 23; 24] cannot be directly extrapolated to children because children have a higher regeneration potential. For example, while ON in adults usually do not resolve, ON in children can resolve completely [11]. Our study only included patients with epiphyseal osteonecrosis, because these are more prone to collapse. Future studies must evaluate if imaging-based classifications of epiphyseal and non-epiphyseal ON in multiple locations are more accurate for the clinical outcome [12].
In summary, the presence of bone marrow oedema in the epiphysis of the proximal and distal femur on MRI studies predicts progression of osteonecrosis and results in bone collapse in paediatric and adolescent leukaemia patients. Bone marrow oedema may be the earliest sign of microfractures, even before subchondral fractures become apparent on imaging studies. Therefore, the finding of a BME could be used to stratify patients to joint preserving interventions and thereby, potentially prevent the need for total joint replacement. We evaluate this biomarker further in a prospective clinical trial.
Supplementary Material
Distribution of epiphyseal osteonecrosis lesions
Key Points.
Bone marrow oedema in corticosteroid-induced osteonecrosis predicts progression to bone collapse.
Bone marrow oedema is associated with subchondral fractures in corticosteroid-induced osteonecrosis.
Bone marrow oedema can be used to stratify patients to joint-preserving interventions.
Absence of bone marrow oedema can justify a “wait and watch” approach.
Acknowledgments
We thank members of the Daldrup-Link lab for valuable input and discussions regarding this project.
Funding:
This study has received funding by the National Institute of Arthritis and Musculoskeletal and Skin Diseases, grant number 3R01AR054458-S1, and the Moskowitz Award for Radiology Resident research, Department of Radiology at Stanford.
Abbreviations and Acronyms
- ARCO
Association Research Circulation Osseous
- BME
Bone Marrow Oedema
- fs
Fat Saturation
- FSE
Fast Spin Echo
- IRB
Institutional Review Board
- MRI
Magnetic Resonance Imaging
- MSC
Mesenchymal Stromal Cell
- ON
Osteonecrosis
- PD
Proton Density
- SL
Slice Thickness
- STIR
Short Tau Inversion Recovery
- T
Tesla
- TE
Echo Time
- TR
Repetition Time
Footnotes
Compliance with ethical standards:
Guarantor:
The scientific guarantor of this publication is Heike E. Daldrup-Link, M.D., Ph.D.
Conflict of interest:
The authors of this manuscript declare no relationships with any companies, whose products or services may be related to the subject matter of the article.
Statistics and biometry:
One of the authors, Jarrett Rosenberg Ph.D., has significant statistical expertise.
Informed consent:
Written informed consent was waived because of the non invasive and retrospective nature of our analyses and the inability or difficulty to locate most of the patients who had completed their treatment.
Ethical approval:
Institutional Review Board approval was obtained.
References
- 1.Mattano LA, Jr, Sather HN, Trigg ME, Nachman JB. Osteonecrosis as a complication of treating acute lymphoblastic leukemia in children: a report from the Children’s Cancer Group. J Clin Oncol. 2000;18:3262–3272. doi: 10.1200/JCO.2000.18.18.3262. [DOI] [PubMed] [Google Scholar]
- 2.Ojala AE, Paakko E, Lanning FP, Lanning M. Osteonecrosis during the treatment of childhood acute lymphoblastic leukemia: a prospective MRI study. Med Pediatr Oncol. 1999;32:11–17. doi: 10.1002/(sici)1096-911x(199901)32:1<11::aid-mpo4>3.0.co;2-f. [DOI] [PubMed] [Google Scholar]
- 3.Ribeiro RC, Fletcher BD, Kennedy W, et al. Magnetic resonance imaging detection of avascular necrosis of the bone in children receiving intensive prednisone therapy for acute lymphoblastic leukemia or non-Hodgkin lymphoma. Leukemia. 2001;15:891–897. doi: 10.1038/sj.leu.2402139. [DOI] [PubMed] [Google Scholar]
- 4.Albano D, Patti C, La Grutta L, et al. Osteonecrosis detected by whole body magnetic resonance in patients with Hodgkin Lymphoma treated by BEACOPP. Eur Radiol. 2017;27:2129–2136. doi: 10.1007/s00330-016-4535-8. [DOI] [PubMed] [Google Scholar]
- 5.Karimova EJ, Wozniak A, Wu J, Neel MD, Kaste SC. How does osteonecrosis about the knee progress in young patients with leukemia?: a 2- to 7-year study. Clin Orthop Relat Res. 2010;468:2454–2459. doi: 10.1007/s11999-010-1358-9. [DOI] [PMC free article] [PubMed] [Google Scholar]
- 6.Moya-Angeler J, Gianakos AL, Villa JC, Ni A, Lane JM. Current concepts on osteonecrosis of the femoral head. World J Orthop. 2015;6:590–601. doi: 10.5312/wjo.v6.i8.590. [DOI] [PMC free article] [PubMed] [Google Scholar]
- 7.Pierce TP, Jauregui JJ, Elmallah RK, Lavernia CJ, Mont MA, Nace J. A current review of core decompression in the treatment of osteonecrosis of the femoral head. Curr Rev Musculoskelet Med. 2015;8:228–232. doi: 10.1007/s12178-015-9280-0. [DOI] [PMC free article] [PubMed] [Google Scholar]
- 8.Mayer SW, Mayer BK, Mack Aldridge J, Urbaniak JR, Fitch RD, Lark RK. Osteonecrosis of the femoral head in childhood malignancy. J Child Orthop. 2013;7:111–116. doi: 10.1007/s11832-012-0471-6. [DOI] [PMC free article] [PubMed] [Google Scholar]
- 9.Powell C, Chang C, Gershwin ME. Current concepts on the pathogenesis and natural history of steroid-induced osteonecrosis. Clin Rev Allergy Immunol. 2011;41:102–113. doi: 10.1007/s12016-010-8217-z. [DOI] [PubMed] [Google Scholar]
- 10.Kerachian MA, Seguin C, Harvey EJ. Glucocorticoids in osteonecrosis of the femoral head: a new understanding of the mechanisms of action. J Steroid Biochem Mol Biol. 2009;114:121–128. doi: 10.1016/j.jsbmb.2009.02.007. [DOI] [PMC free article] [PubMed] [Google Scholar]
- 11.Kaste SC, Karimova EJ, Neel MD. Osteonecrosis in children after therapy for malignancy. AJR Am J Roentgenol. 2011;196:1011–1018. doi: 10.2214/AJR.10.6073. [DOI] [PMC free article] [PubMed] [Google Scholar]
- 12.Niinimaki T, Niinimaki J, Halonen J, Hanninen P, Harila-Saari A, Niinimaki R. The classification of osteonecrosis in patients with cancer: validation of a new radiological classification system. Clin Radiol. 2015;70:1439–1444. doi: 10.1016/j.crad.2015.08.011. [DOI] [PubMed] [Google Scholar]
- 13.Meier R, Kraus TM, Schaeffeler C, et al. Bone marrow oedema on MR imaging indicates ARCO stage 3 disease in patients with AVN of the femoral head. Eur Radiol. 2014;24:2271–2278. doi: 10.1007/s00330-014-3216-8. [DOI] [PubMed] [Google Scholar]
- 14.Gardeniers JWM. Report of the Committee of staging and nomenclature. ARCO newsletter. 1993;5:79–82. [Google Scholar]
- 15.Yang L, Boyd K, Kaste SC, Kamdem Kamdem L, Rahija RJ, Relling MV. A mouse model for glucocorticoid-induced osteonecrosis: effect of a steroid holiday. J Orthop Res. 2009;27:169–175. doi: 10.1002/jor.20733. [DOI] [PMC free article] [PubMed] [Google Scholar]
- 16.Weinstein RS. Glucocorticoid-induced osteonecrosis. Endocrine. 2012;41:183–190. doi: 10.1007/s12020-011-9580-0. [DOI] [PMC free article] [PubMed] [Google Scholar]
- 17.Weinstein RS, Jilka RL, Parfitt AM, Manolagas SC. Inhibition of osteoblastogenesis and promotion of apoptosis of osteoblasts and osteocytes by glucocorticoids. Potential mechanisms of their deleterious effects on bone. J Clin Invest. 1998;102:274–282. doi: 10.1172/JCI2799. [DOI] [PMC free article] [PubMed] [Google Scholar]
- 18.Chollet CT, Britton L, Neel MD, Hudson MM, Kaste SC. Childhood cancer survivors: an at-risk cohort for ankle osteonecrosis. Clin Orthop Relat Res. 2005:149–155. [PubMed] [Google Scholar]
- 19.Miettunen PM, Lafay-Cousin L, Guilcher GM, Nettel-Aguirre A, Moorjani V. Widespread osteonecrosis in children with leukemia revealed by whole-body MRI. Clin Orthop Relat Res. 2012;470:3587–3595. doi: 10.1007/s11999-012-2579-x. [DOI] [PMC free article] [PubMed] [Google Scholar]
- 20.Patel S. Primary bone marrow oedema syndromes. Rheumatology (Oxford) 2014;53:785–792. doi: 10.1093/rheumatology/ket324. [DOI] [PubMed] [Google Scholar]
- 21.Satku K, Kumar VP, Chong SM, Thambyah A. The natural history of spontaneous osteonecrosis of the medial tibial plateau. J Bone Joint Surg Br. 2003;85:983–988. doi: 10.1302/0301-620x.85b7.14580. [DOI] [PubMed] [Google Scholar]
- 22.Alho A, Hoiseth A. Bone mass distribution in the lower leg. A quantitative computed tomographic study of 36 individuals. Acta Orthop Scand. 1991;62:468–470. doi: 10.3109/17453679108996647. [DOI] [PubMed] [Google Scholar]
- 23.Iida S, Harada Y, Shimizu K, et al. Correlation between bone marrow edema and collapse of the femoral head in steroid-induced osteonecrosis. AJR Am J Roentgenol. 2000;174:735–743. doi: 10.2214/ajr.174.3.1740735. [DOI] [PubMed] [Google Scholar]
- 24.Ito H, Matsuno T, Minami A. Relationship between bone marrow edema and development of symptoms in patients with osteonecrosis of the femoral head. AJR Am J Roentgenol. 2006;186:1761–1770. doi: 10.2214/AJR.05.0086. [DOI] [PubMed] [Google Scholar]
Associated Data
This section collects any data citations, data availability statements, or supplementary materials included in this article.
Supplementary Materials
Distribution of epiphyseal osteonecrosis lesions


