Abstract
Aims
To evaluate the accuracy of contrast-enhanced ultrasound (CEUS) for monitoring tumor necrosis following WST-11 vascular targeted photodynamic therapy (VTP) using imaging-pathology correlation.
Methods
Renal adenocarcinoma cells were injected into the hindlimb of 13 BalB/c mice resulting in tumors ranging from 9.8 to 194.3 mm3. US guidance was used to place a laser fiber into the tumor, and VTP was performed. CEUS was performed prior to animal sacrifice, 24 hours post-VTP. Whole tumors were extracted for histopathologic analysis using H&E and TUNEL staining. Pathology samples corresponding to the CEUS imaging plane were prepared in order to compare the size and extents of tumor necrosis.
Results
Tumor necrosis following VTP appeared as a central region of non-enhancement on CEUS, while viable tumor appeared as patchy regions of enhancement in the tumor periphery. The region of tumor necrosis measured in mean 66% and 64.8% of total tumor area on CEUS and pathology respectively (p=0.2). The size and location of the necrosis on CEUS images and pathology samples were found correlative with no inter-observer difference (weighted kappa of 0.771 and 0.823, respectively).
Conclusion
CEUS allows accurate monitoring of VTP induced tumor necrosis in a small animal model.
Keywords: vascular targeted photodynamic therapy, contrast-enhanced ultrasound, tumor
BACKGROUND
In preclinical mouse studies, laser fiber placement and WST-11 Vascular Targeted Photodynamic Therapy (VTP) treatment monitoring are usually performed under direct visual guidance [1–3]. The lack of suitable imaging techniques that can be used to plan and perform VTP undermines the ability to study the biological effects of this technique.
We hypothesized that contrast-enhanced ultrasound (CEUS) may be used to guide laser fiber placement, monitor VTP mediated changes to tumor vasculature, and predict outcomes [3,4]. The high compressibility and resonance properties of gas-filled microbubbles makes them useful intravascular ultrasound contrast agents [5].
AIMS
The purpose of this study was to examine the accuracy of CEUS in predicting tumor necrosis after VTP in a murine tumor model through radiologic-pathologic comparison.
METHODS
Animal model and treatment
Thirteen BalB/c mice (Charles River Laboratory) underwent CEUS-guided VTP on subcutaneous flank tumors. A total of 5 × 10⁶ Renca cells were injected into the left hind limb of 7–8 week old male mice. The mice were intravenously infused with WST-11 (Steba Biotech. France) at 9mg/kg for 5 min followed by laser illumination for 10 min. A 10 mm cylindrical fiber (MedLight S.A., Switzerland) was placed into the tumor through a small incision on the skin, and was used to deliver 753nm laser light at 150 mW/cm2 generated with a diode laser (V-Gen. Israel). All animals were sacrificed 24 hours after VTP.
Imaging
Lyophilized microbubbles (Vevo MicroMarker Contrast agents) were prepared by using techniques recommended by the manufacturer (Fujifilm Visualsonics, Toronto, Canada). A Vevo® 2100 high-resolution imaging system were used for placement of the laser fiber into the center of the tumor and for post-treatment CEUS imaging 24 hours following VTP. For CEUS, a 50μL bolus of 1.0 ×10⁸ microbubbles was delivered into the tail vein of the animal using a 27 G needle. The tumor was scanned with two-dimensional US and images from the largest cross section of the tumor in the transverse plane was recorded. Figure 1 shows the relative sequence of treatment and imaging in the experimental protocol.
Figure 1.

Schematic detailing timeline and experimental workflow for VTP and CEUS.
Imaging and Histological correlation of treatment response
Whole tumors were removed 24 hours after VTP and fixed in 10% neutral buffered formalin paraffin embedded and then stained with hematoxylin-eosin (H&E) and TUNEL (Terminal deoxynucleotidyl transferase dUTP nick end labeling; DNA fragmentation and necrosis marker) for histopathological analysis. Non-enhancing regions on contrast-enhanced US images and regions staining positive for tumor necrosis on histopathology images were matched by reviewing the images on a reading software (Osirix, Switzerland) and compared. Size and extent (peripheral, central or patchy) of necrosis in the entire image was evaluated. A visual correlation between the area of the unenhanced zone on the CEUS images and the nonviable zone on gross images after ablation was analyzed by two independent observers. P<0.05 was considered a statistically significant difference.
RESULTS
Findings on CEUS of tumors post-VTP
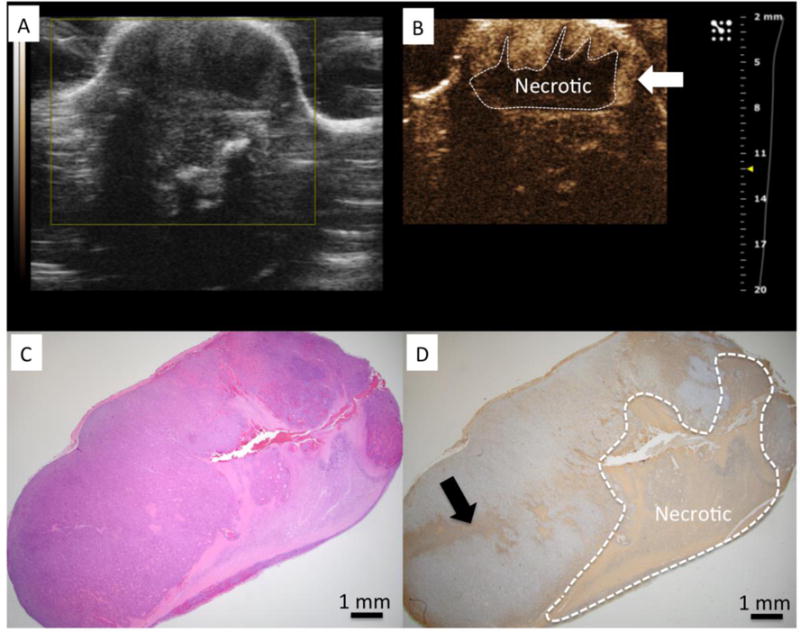
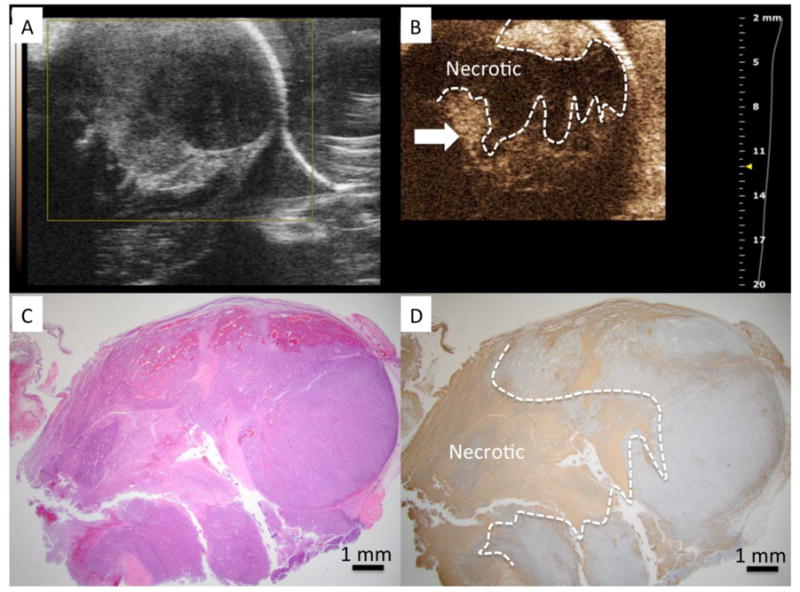
Tumor volumes in the study ranged from 9.8 to 194.3 mm3 (median: 24.6 mm3). CEUS images demonstrated non-enhancing zones 24 hours after VTP (n=13). Such findings were not perceptible in the pre-treatment non CEUS images. CEUS showed non-enhancing zones in the center of the tumor for all animals (Figures 2B and 3B). In 8 cases, residual enhancement was observed in peripheral aspects of the tumor.
Figure 2.

A) US imaging shows tumor to have heterogeneous echo properties. B) CEUS identified a central necrotic area within the tumor after VTP (dashed line) C) H&E stained slide of the tumor corresponding to US imaging plane. D) TUNEL demonstrates a region of positive (brown) staining clearly demarcating a region of necrosis similar in size and shape to region of non-enhancing region observed on CEUS. Regions of enhancement on CEUS correspond to regions without positive staining for TUNEL and was interpreted to be viable tissue on H&E.
Figure 3.

A) US imaging shows tumor to have heterogeneous echo properties. B) CEUS identified a central necrotic area within the tumor after VTP (dashed line) C) H&E stained slide of the tumor corresponding to US imaging plane. D) TUNEL demonstrates a region of positive (brown) staining clearly demarcating a region of necrosis similar in size and shape to region of non-enhancing region observed on CEUS. The linear tract formed after removal of the laser fiber can be clearly observed (marked by arrow) through the cross section of the tumor.
CEUS findings correlated with Pathology after VTP
Regions of tumor necrosis demonstrating positive TUNEL staining, were centrally located in most tumors and matched the location of laser fiber placement. Patchy necrotic areas were observed in the peripheral regions of some tumors, confirmed on interpretation of H&E stained slides (Figures 2D and 3D). The mean area of necrosis for all animals was measured to be 66% and 64.8% of the total tumor area on CEUS and pathology images respectively (p=0.2). The size and shape of the necrotic tumor on CEUS images and pathology samples correlated with little inter-observer difference (weighted kappa of 0.771 and 0.823, respectively). CEUS under-estimated the necrotic area on pathology by an average of 5% (mean ratio of 70.3% +/−20.6 vs 65.2% +/− 18.6), a difference that was not statistically significant.
DISCUSSION
Our results provide evidence that CEUS can be used to predict the pathology-correlated volume of tumor ablation with VTP at an early timepoint. While the 24-hour timepoint was chosen in our experiments to allow time for definitive tumor necrosis, CEUS can also be used in the immediate post-ablation evaluation of treatment effects. In principle, other techniques such as MRI, optical imaging techniques or micro CT imaging could also be used for monitoring and estimating ablation effects. However, such techniques are constrained by resource and cost requirements.
All ablation techniques indirectly impact the microvasculature in the treated tissue. In most cases, energy delivery results in occlusion of microvasculature from thrombus formation. In the case of thermal ablation, complete destruction of blood vessels can occur. These effects are comparable to the vascular effects of VTP, therefore we posit that CEUS could be used to monitor other types of ablation techniques in small animal tumor models.
Our study has some limitations that must be taken into consideration when using CEUS to monitor VTP in small animals. The timepoint for imaging-pathology correlation was chosen such that VTP induced tumor necrosis could be completely measured with immunohistochemical staining. Additional studies at earlier time points and correlation with outcomes at 24 hours will be necessary if CEUS is to be used for immediate post-VTP ablation assessment. Our findings are based on a single murine tumor model that is hypervascular, and therefore amenable to imaging CEUS. Xenograft tumors and some murine tumors can be hypovascular, and the impact of such tumor biology on CEUS assessment is not clear. Finally, our study does not demonstrate tumor growth kinetics or survival benefit based on CEUS estimate of VTP of tumors. Survival and treatment efficacy were not assessed as part of our study as several factors can confound accurate correlation of imaging based outcomes.
In conclusion, further refinement of the technique can support CEUS for the monitoring of ablation in small animal tumor models and estimating treatment outcomes.
Table 1.
summary of the results
| Animal Number | Type | % non enhanced after VTP | % of necrotic zone after VTP | Difference |
|---|---|---|---|---|
| 1 | VTP | 49.3 | 42.2 | −7.1 |
| 2 | VTP | 83.8 | 65.4 | −18.4 |
| 3 | VTP | 100 | 67 | −33 |
| 4 | VTP | 71.3 | 49.5 | −21.8 |
| 5 | VTP | 8.2 | 17.5 | 9.3 |
| 6 | VTP | 76.5 | 75 | −1.5 |
| 7 | VTP | 67.9 | 61.9 | −6 |
| 8 | VTP | 81.3 | 82.6 | 1.3 |
| 9 | VTP | 74.3 | 64.9 | −9.4 |
| 10 | VTP | 66.5 | 51.2 | −15.3 |
| 11 | VTP | 80.8 | 83.7 | 2.9 |
| 12 | VTP | 82.3 | 88.9 | 6.6 |
| 13 | VTP | 93 | 95.2 | 2.2 |
| MEAN (+/− SD) | – | 70.3 (20.6) | 65.2 (18.6) | −5 (12.8) |
Highlights.
CEUS images demonstrated non-enhancing zones 24 hours after VTP.
CEUS findings correlated with Pathology after VTP.
CEUS allows accurate monitoring of VTP induced tumor necrosis in a small animal model.
Acknowledgments
The project was supported by a philanthropic grant from the Thompson Family Foundation. The authors acknowledge the support of NIH Cancer Center Support Grant (P30 CA008748) for core laboratory services that were used for the presented work.
Footnotes
Publisher's Disclaimer: This is a PDF file of an unedited manuscript that has been accepted for publication. As a service to our customers we are providing this early version of the manuscript. The manuscript will undergo copyediting, typesetting, and review of the resulting proof before it is published in its final citable form. Please note that during the production process errors may be discovered which could affect the content, and all legal disclaimers that apply to the journal pertain.
Conflicts of interest: none
References
- 1.Madar-Balakirski N, Tempel-Brami C, Kalchenko V, Brenner O, Varon D, Scherz A, Salomon Y. Permanent occlusion of feeding arteries and draining veins in solid mouse tumors by vascular targeted photodynamic therapy (VTP) with Tookad. PLoS One. 2010;5:e10282. doi: 10.1371/journal.pone.0010282. [DOI] [PMC free article] [PubMed] [Google Scholar]
- 2.Kimm SY, Tarin TV, Monette S, Srimathveeravalli G, Gerber D, Durack JC, Solomon SB, Scardino PT, Scherz A, Coleman J. Nonthermal Ablation by Using Intravascular Oxygen Radical Generation with WST11: Dynamic Tissue Effects and Implications for Focal Therapy. Radiology. 2016;281:109–118. doi: 10.1148/radiol.2016141571. [DOI] [PMC free article] [PubMed] [Google Scholar]
- 3.Bex A, Fournier L, Lassau N, Mulders P, Nathan P, Oyen WJG, Powles T. Assessing the Response to Targeted Therapies in Renal Cell Carcinoma: Technical Insights and Practical Considerations. Eur Urol. 2014;65:766–777. doi: 10.1016/j.eururo.2013.11.031. [DOI] [PubMed] [Google Scholar]
- 4.Medinger Antitumor effect of the vascular-disrupting agent ZD6126 in a murine renal cell carcinoma model. Int J Oncol. 2011;38 doi: 10.3892/ijo.2010.867. [DOI] [PubMed] [Google Scholar]
- 5.Sirsi SR, Flexman ML, Vlachos F, Huang J, Hernandez SL, Kim HK, Johung TB, Gander JW, Reichstein AR, Lampl BS, Wang A, Hielscher AH, Kandel JJ, Yamashiro DJ, Borden MA. Contrast ultrasound imaging for identification of early responder tumor models to anti-angiogenic therapy. Ultrasound Med Biol. 2012;38:1019–29. doi: 10.1016/j.ultrasmedbio.2012.01.014. [DOI] [PMC free article] [PubMed] [Google Scholar]


