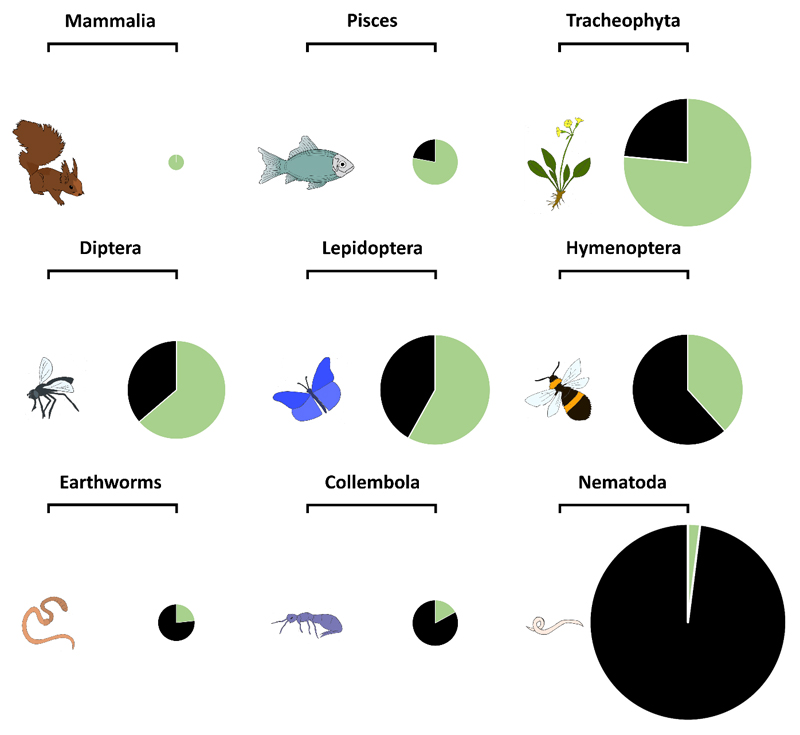
It has recently been announced that for the first time the regional Red List for Germany has included three groups of soil invertebrates: earthworms, millipedes, and centipedes1. Although these taxa already appear in very small numbers on other regional Red Lists and the global IUCN Red List (http://www.nationalredlist.org/; http://www.iucnredlist.org/), this addition provides an opportunity to shine a spotlight on this often forgotten "poor man's tropical rainforest". The Red List’s taxonomic bias towards more charismatic species means that these understudied soil invertebrates are under-represented2 (Figure 1). However, more worrying is the lack of information regarding the threats faced by these species; ‘Least Concern’ is the most common status among the earthworm species recently added to the German Red List (46%; although 14 of the 47 species were assessed as ‘Extremely Rare’) based on occurrence data, but there are virtually no data on long- or short-term population trends or risks faced1. For example, very little is known about the effects of human impacts, such as land use change and climate change, on below-ground communities3, especially compared to above-ground organisms, highlighting the urgent need for more information.
Figure 1.
Proportion of described species (green) and estimated undescribed species (black) for six above-ground taxa (top two rows; estimates from Chapman (2009) Numbers of living species in Australia and the world) and three below-ground taxa (bottom row; estimates from Orgiazzi et al. (2016) Global Soil Biodiversity Atlas). Size of the individual pie charts is proportional to the total number of estimated species.
The lack of available soil biodiversity data results in underrepresentation in many biodiversity databases and synthesis analyses4,5. Existing databases often have little data on soil organisms (e.g. the PREDICTS database contains just under 1% of all described annelids6, whereas BioTIME4 contained no soil invertebrate time-series data); are not global7; or concentrate on a small subset of soil taxa8. We strongly advocate for data-mobilisation initiatives focused on soil biodiversity, in order to address large-scale questions9. Such synthetic analyses can be useful in answering key questions as to how soil biodiversity might respond to anthropogenic impacts2,3, and if the response differs from those seen in above-ground biodiversity10. Given the importance of local biodiversity for ecosystem services and function, determining whether local biodiversity is declining (a hotly debated topic11), both above- and below-ground2, is crucial in sustaining human well-being12.
Mobilising the necessary information and data on the “black box” of soil biodiversity will require large collaborative initiatives. In addition increasing the representation of the hidden biota on national and global Red Lists will help raise the awareness of policymakers as well as the general public, ideally resulting in increased funding for assessments and research in order to better understand changes in this underexplored biodiversity that is so critical for human well-being.
Acknowledgements
We thank Tilo Arnhold for initiating the discussion on soil invertebrates in Red Lists and acknowledge support by the German Centre for Integrative Biodiversity Research (iDiv) Halle-Jena-Leipzig, funded by the German Research Foundation (FZT 118), and the Academy of Finland (285882).
References
- 1.Gruttke H, et al. Rote Liste gefährdeter Tiere, Pflanzen und Pilze Deutschlands. Band 4: Wirbellose Tiere (Teil 2); 2016. [Google Scholar]
- 2.Bardgett RD, Van Der Putten WH. Nature. 2014;505:505–511. doi: 10.1038/nature13855. [DOI] [PubMed] [Google Scholar]
- 3.Veresoglou SD, et al. Nat Commun. 2015;6:8862. doi: 10.1038/ncomms9862. [DOI] [PMC free article] [PubMed] [Google Scholar]
- 4.Dornelas M, et al. Science. 2014;344:296–299. doi: 10.1126/science.1248484. [DOI] [PubMed] [Google Scholar]
- 5.Moran D, Kanemoto K. Nat Ecol Evol. 2017;1:0023. doi: 10.1038/s41559-016-0023. [DOI] [PubMed] [Google Scholar]
- 6.Hudson LN, et al. Ecol Evol. 2016;7:145–188. doi: 10.1002/ece3.2579. [DOI] [PMC free article] [PubMed] [Google Scholar]
- 7.Burkhardt U, et al. Appl Soil Ecol. 2014;83:3–12. [Google Scholar]
- 8.Cameron EK, et al. Appl Soil Ecol. 2016;104:85–90. [Google Scholar]
- 9.Ramirez KS, et al. Front Ecol Evol. 2015;3:91. [Google Scholar]
- 10.Gossner MM, et al. Nature. 2016;540:266–269. doi: 10.1038/nature20575. [DOI] [PubMed] [Google Scholar]
- 11.Gonzalez A, et al. Ecology. 2016;97:1949–1960. doi: 10.1890/15-1759.1. [DOI] [PubMed] [Google Scholar]
- 12.Wall DH, et al. Nature. 2015;528:69–76. doi: 10.1038/nature15744. [DOI] [PubMed] [Google Scholar]
- 13.Chapman AD. Numbers of Living Species in Australia and the World. 2nd edn. Australian Biodiversity Information Services; 2009. [Google Scholar]
- 14.Orgiazzi A, et al. Global Soil Biodiversity Atlas. European Commission, Publications Office of the European Union; 2016. [Google Scholar]


