

Abstract
Although prosody clearly affects the interpretation of utterances, the mapping between prosodic representations and acoustic features is highly variable. Listeners may in part cope with this variability by adapting to distributions of acoustic features in the input. We examined whether listeners adapt to distributional changes using the construction It looks like an X. When pronounced with an H* pitch accent on the final noun and a low boundary tone, the construction supports an affirmative interpretation (e.g., It looks like a ZEBRA [and I think it is one]). Conversely, when pronounced with a L+H* pitch accent and a rising boundary tone, it suggests a negative interpretation (e.g., It LOOKS like a zebra…. [but it is not]). Experiment 1 elicited pragmatic interpretations of resynthesized 12-step continua with these two contours as the end points. In Experiment 2, one group of listeners heard items sampled from the most ambiguous region along the continua followed by affirmative continuations (e.g., It looks like a zebra because it has stripes all over its body) and items near the contrastive endpoint followed by negative continuations (e.g., It looks like a zebra but it is actually something else). Another group heard the reverse (i.e., ambiguous items with negative continuations and non-contrastive items with affirmative continuations). The two groups of participants subsequently derived diverging interpretations for novel ambiguous items, suggesting that prosodic processing involves flexible mappings between acoustic features and prosodic representations that are meaningful in interpretation of speech.
Introduction
Successfully conveying an idea depends not only on what a speaker says, but how she chooses to say it. Prosody, the melodic and rhythmic aspects of speech, undoubtedly plays an important role in conveying information about a speaker’s beliefs and intentions that are not explicitly encoded in the content of an utterance (e.g., Büring, 2003; Cutler, 2015; Dahan, 2015; Gussenhoven, 2004; Jackendoff, 1972; Ladd, 2008; Pierrehumbert & Hirschberg, 1990; Sag & Liberman, 1975). However, how listeners map information from prosody onto pragmatic interpretations is not well understood.
In perhaps the most influential approach to mapping prosody onto speaker intentions, Pierrehumbert and Hirschberg (1990) proposed that listeners identify atomic units, such as pitch accents and boundary tones (Beckman & Pierrehumbert, 1986; Liberman & Pierrehumbert, 1984), which have unique functional meanings that combine to give rise to an overall intonational meaning. For instance, a high pitch accent aligned with a word stress (conventionally annotated as H*; Silverman et al., 1992) generally introduces new information into a discourse (e.g., I like APPLES_H*) whereas an accent with low pitch followed by a steep pitch rise (i.e., L(ow)+H(igh)*) highlights contextual contrast (e.g., I like APPLES_L+H*, but not pears).
While highly influential, this approach leaves open questions about how listeners recognize and process pragmatically meaningful intonational categories. The acoustic realization of intonational categories interacts with factors, such as the stress pattern of an associated word, where in a sentence it appears, and more speaker- and/or situation-specific factors, such as overall pitch range, speech rate, and dialectal features (e.g., Arvaniti & Garding, 2007; Ladd, 2008; Liberman & Pierrehumbert, 1984). Therefore, mappings from acoustic cues to intonational categories are inherently non-deterministic, with values of acoustic cues overlapping across categories (Taylor, 2000). Even trained annotators often disagree on classification of intonational categories, which raises questions about how naïve listeners navigate variability in the input to arrive at coherent interpretations (e.g., Breen, Dilley, et al., 2012; Ladd & Morton, 1997, Syrdal & McGory, 2000).
The lack of invariance between the acoustic signal and more abstract linguistic categories is not specific to prosody. It has long been a central topic in spoken language processing, especially phonetic categorization (Liberman, Cooper, Shankweiler, & Studdert-Kennedy, 1967). One way in which listeners cope with variability in mappings between acoustic features and phonemes is to expect variation and adapt to it by shifting expectations (e.g., Clayards, Tanenhaus, Aslin, & Jacobs, 2008; Kleinschmidt & Jaeger, 2015; Kraljic & Samuel, 2007; Maye, Aslin, & Tanenhaus, 2008; Norris, McQueen, & Cutler, 2015). A powerful approach for examining adaptation in phonetic categorization is to use a continuum where the endpoints are clear tokens of phonemes that vary along a single dimension (e.g., VOT), determine a categorization function, and test whether this function is affected by exposure to different distributions of tokens. Extending this approach to adaptation with intonational contours presents challenges. First, unlike phonemes, pragmatically meaningful intonational categories are not easily accessible to naïve speakers (Dilley, 2010; Ladd & Morton, 1997; Ladd, 2008). Second, different intonational categories can have overlapping interpretations (Watson, Tanenhaus, & Gunlogson, 2008). Third, holistic impressions of pitch contours or emphases are based on multiple acoustic features (e.g., F0, duration, amplitude, intensity) that co-vary with one another and can span multiple phonemes, syllables and words. Finally, interpretations of contours are heavily context-dependent (e.g., Pierrehumbert & Hirschberg, 1990).
Our solution uses a construction, It looks like an X, which can be associated with opposing interpretations depending on intonational contours. When used with a pitch accent on the final noun followed by a falling boundary tone (i.e., the H* L-L% contour, or tune, which we refer to as the noun-focus contour, Figure 1, left), this construction tends to evoke the affirmative interpretation [it looks like a zebra and it is one]. When instead used with a nuclear L+H* accent on the verb followed by a L-H% boundary tone (“It LOOKS like a zebra…”, which we refer to as the verb-focus contour, Figure 1, right), it tends to trigger the negative interpretation [it looks like a zebra but it is not one] (Kurumada, Brown, et al., 2014). In the verb-focus contour, the prosodically highlighted predicate looks like evokes the inference that the speaker intentionally chose looks like over the more frequent, and hence probable, predicate is to convey [It resembles a zebra but it is not] (see also Dennison & Schafer, 2010).
Figure 1.

Waveforms (top) and pitch contours (bottom) for the utterance It looks like a zebra, elicited from a native speaker of American English. The affirmative meaning [It is a zebra] is typically conveyed by the contour on the left (the noun-focus contour), while the negative meaning [It is not a zebra] is conveyed by the contour on the right (the verb-focus contour).
To arrive at a particular pragmatic interpretation, listeners need to map the acoustic input onto increasingly abstract intonational and semantic representations (Figure 2, for more discussion see Kurumada et al., under review)1. The current investigation postulates that intonational contours form partially overlapping distributions of intonational cues (e.g., pitch, duration and intensity) that combine to guide listeners’ interpretations. Due to the noise and variability associated with intonational contours, there are multiple intonational representations that can be induced from a given acoustic signal, as indicated with the dotted Gaussian distributions in Figure 2. We assume, however, that listeners in our experiment have pragmatic expectations about the intended interpretation of It looks like an X (i.e. [it’s an X] or [it’s not an X]) and would thus consider at least two contours corresponding to these interpretations (i.e. the noun- and verb-focus contours; Figure 3).
Figure 2.
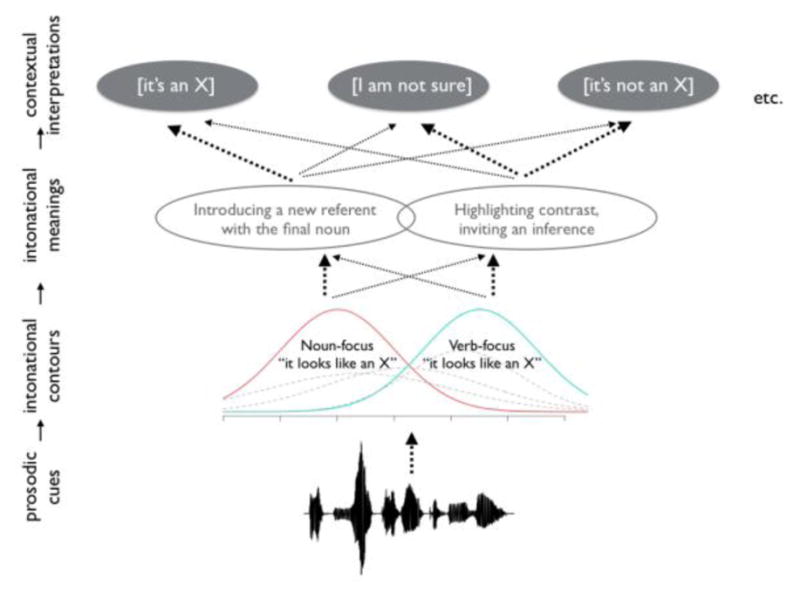
Schematic illustration of multiple levels of mappings between the acoustic signal and higher level representations modified from Kurumada et al. (under review). Width of the arrows likelihoods of the mappings.
Figure 3.

Schematic illustration of distributional representations for the noun-focus and the verb-focus contours and categorization function curves for the distributions.
We test the hypothesis that listeners adapt their assumptions about these distributions (e.g., means and variances) to accommodate variability in the input. In Experiment 1, we infer underlying distributional features of the intonational contours by eliciting categorization judgments for items sampled along a continuum interpolating f0 and duration between prototypical noun-focus and verb-focus contours. A steep categorization function would suggest that underlying distributions have smaller variances whereas a shallower function would indicate that at least one of the categories has relatively large variance (reflecting greater categorization uncertainty). In Experiment 2, we test the prediction that exposure to different distributions of items sampled from the continuum will result in adaptation of listeners’ intonational categorization functions.
Experiment 1: Determining the categorization function
Methods
Participants
60 participants used the online survey platform Amazon Mechanical Turk (https://www.mturk.com/). Participants were self-reported native speakers of American English, residing in the United States. They were advised to wear a headset or earphones. Mean task duration was 8 minutes; participants received $0.80. We excluded four participants who completed the task in less than 100 seconds or more than 15 minutes or who made the same response to each item.
Stimuli
A female speaker of American English (MB) recorded three tokens of It looks like an X for 24 target items in each of the two target intonation contours. For the final noun, we chose 24 commonly known animal and object names, each disyllabic with initial stress (e.g., baseball, zebra). Six regions were identified and annotated within each recorded token, corresponding to the four initial words (i.e., it | looks | like | a) and the portions of the final word associated with each of the two tonal targets: H* and L-L% in the noun-focus contour; L- and H% in the verb-focus contour (Figure 2). The peak or trough of the f0 contour within the final word (usually aligned with the first syllable) was used to delineate the final two regions. The f0 across each region was sampled at 20 equally-spaced time points. Measures from each time point were aggregated across items to derive mean f0 contours for noun-focus and verb-focus instructions, respectively, following Isaacs and Watson (2010). Mean durations for each region were similarly computed for both contours. We used the pitch-synchronous overlap-and-add algorithm implemented in Praat (Boersma & Weenink, 2008; Moulines & Charpentier, 1990) to create a 12-step continuum for each item (Figure 4). Acoustic cue values for each step were determined by interpolating ten equidistant steps between the mean f0 and duration values for the noun-focus and the verb-focus contours within each of the six regions. One recording of the verb-focus was then used as a base-form whose f0 and duration values were replaced with the interpolated values. Sample sound files are provided in Supplementary materials.
Figure 4.

Illustration of the resynthesized 12-step continuum. The bottom and top lines at time=0 are Step 1 (noun-focus) and Step 12 (verb-focus), respectively. The ten lines in between correspond to Steps 2–11.
The endpoints of the continuum differ on multiple dimensions (e.g., nuclear accent location, segment duration, and combinatory patterns of pitch accent and boundary tone). We manipulated both pitch and duration to ensure that these co-varying dimensions shift together to maximize naturalness of the resynthesized stimuli. While this approach does not allow us to identify specific acoustic cues to which listeners adapt, demonstrating adaptation of intonation interpretations with these stimuli can serve as a springboard for more targeted questions about the nature of prosodic representations.
Procedure
Participants were told that they would hear a mother’s responses to her child’s question, “What’s on the next page?” Participants heard 24 tokens of It looks like an X: two tokens per continuum step. Upon listening to each stimulus, participants were prompted to click on one of two candidate referents (Figure 5): one prototypical target picture (e.g., a zebra) and one non-prototypical target picture (e.g., an okapi, a member of the giraffe family with zebra-like markings). Six lists were created by varying the nouns at each continuum step to mitigate possible spurious effects of item-specific factors. For example, one list used zebra and table as Step 1 stimuli while another list used rabbit and candy as Step 1 stimuli. Order of presentation was randomized across participants. Participants did not receive feedback about which of the two referents was the intended target.
Figure 5.

Sample pictures presented in Experiment 1 for the target word zebra: (a) the prototypical target picture (a zebra), and (b) the non-prototypical target picture (an okapi). We expected (a) and (b) to be selected most frequently at Step 1 (noun-focus) and Step 12 (verb-focus), respectively.
Results
Results are presented in Figure 6. As expected, listeners were most likely to provide an affirmative (i.e., [It is an X]) interpretation for stimuli close to the prototypical noun-focus contour (i.e., Step 1). Judgments shifted toward [It is not an X] as stimuli became more similar to the prototypical verb-focus contour (i.e., Step 12). There was an overall bias toward the affirmative interpretation. Canonical noun-focus tokens at Step 1 elicited the affirmative interpretation on 84% of the trials compared to 37% for canonical verb-focus tokens at Step 12. The items for Step 10 were the most ambiguous (48% affirmative responses).
Figure 6.

Proportions of the affirmative [It is an X] interpretation by continuum step (1=noun-focus, 12=verb-focus). Dotted line represents loess smoothing, and shading indicates the 95% confidence interval.
The results are consistent with the hypothesis that listeners show gradient categorization judgments along the continuum (see Supplementary materials for additional analyses testing assumptions about the number of underlying distributions). The overall bias towards the affirmative response may reflect listeners’ a priori bias towards recognizing a more generally frequent intonation contour (i.e., H* H-L%) and/or their tendency to derive a canonical, as opposed to pragmatically more complex, interpretation (see Supplementary materials for supporting information from past corpus studies). Consistent with previous observations in the literature, listeners’ interpretation of prosody is thus systematic and yet exhibits considerable uncertainty. In Experiment 2, we examine whether listeners might navigate this uncertainty by adapting expectations for intonational contours.
Experiment 2: Adaptation in interpretation of prosody
Methods
Participants
360 participants completed the experiment using Amazon Mechanical Turk. We used the same exclusion criteria as Experiment 1 but extended the maximum task time to 25 minutes because of the increased number of trials. We obtained complete responses from 324 individuals.
Stimuli
The 24 items from Experiment 1 were supplemented with five items recorded by the same speaker. Two items were used as example trials. Of the 27 remaining items, 15 items were used for the exposure phase, and 12 for the test phase. For each exposure item, two continuation phrases were recorded by the same speaker. One continuation supported the affirmative interpretation (e.g., [It looks like a zebra] “because it has black and white stripes all over its body”). The other supported the negative interpretation (e.g., [It LOOKS like a zebra] “but it’s not. It has stripes only on its legs”).
Procedure
The experiment consisted of an exposure and a test phase. In the exposure phase, participants heard each exposure item twice: once with the affirmative continuation and once with the negative continuation (30 total trials). On each trial, they selected the prototypical or non-prototypical target picture as the more likely referent after hearing It looks like an X. After responding, they heard the continuation phrase accompanied by the corresponding prototypical or non-prototypical picture. Item order was randomized.
We created two exposure conditions (Figure 7). In the no-shift condition, exposure items with affirmative continuations were sampled from Steps 4–9, and those with negative continuations from Steps 11–12 (Figure 7a). In the negative-shift condition, exposure items with affirmative continuations were sampled from Steps 1–2, and those with negative continuations from Steps 7–12 (Figure 7b). Consequently, items selected from Steps 7–9, which were judged to be relatively ambiguous in Experiment 1, differed in continuation phrase across conditions. In the no-shift condition, items from Steps 7–9 were disambiguated with affirmative continuations, thus approximating the distribution of mappings between acoustic features and meanings observed in Experiment 1. In the negative-shift condition, items from Steps 7–9 were instead disambiguated with negative continuations.
Figure 7.

Token counts of input sentences sampled from each step of the continuum (ranging from 1 = noun-focus to 12 = verb-focus) in the exposure phase of the (a) no-shift and (b) negative-shift conditions in Experiment 2. White bars indicate tokens followed by affirmative continuations, and shaded bars those followed by negative continuations.
Each item in the exposure phase was preceded by one of two types of utterances from a second speaker (interlocutor utterances): “What’s that?” or “It’s an X!” (e.g., “It’s a zebra!”). These interlocutor utterances were included to provide a plausible conversational context and thus make the end-point judgments more symmetrical compared to Experiment 1. In particular, including “It’s an X” interlocutor utterances makes the negative meaning of the verb-focus contour more readily available (e.g., Child: “It’s a zebra!”; Mother: “It LOOKS like a zebra… [but it is not]”). Interlocutor utterances were recorded by a male native speaker of American English and manipulated with Praat’s change gender command to make them sound like a child’s voice. 80% of the utterances with affirmative continuations were immediately preceded by a token of “What’s that?” and 20% were preceded by “It’s an X!” to discourage listeners from relying solely on the preceding interlocutor utterances to guide their judgments. These proportions were reversed for utterances with negative continuations.
The test phase was identical across conditions. Participants made 2AFC judgments for 12 tokens of It looks like an X (with no interlocutor utterance or continuation phrase) sampled from each of the 12 steps along the continuum. There was no overlap in target words between exposure and test phases. If categorization of intonation contours is modulated according to the distributional information in the input, exposure to the input in the negative-shift condition should result in recalibration of the categorization function, with more negative judgments compared to the no-shift condition.
Results
Responses are plotted in Figure 8. As predicted, in the no-shift condition, participants’ judgments were similar to those in Experiment 1, whereas in the negative-shift condition, a wider range of items elicited negative interpretations. Specifically, the proportion of affirmative interpretations dropped below 50% at Steps 7–9, which were associated with negative continuations during exposure. Likewise, items from Step 10, which were judged to be more or less ambiguous in Experiment 1 and in the no-shift condition, were more consistently assigned the negative interpretation.
Figure 8.

Proportions of the affirmative [it is an X] interpretation in the test phase, by continuum step (1=noun-focus, 12=verb-focus). Gray, blue, and red lines represent responses from Experiment 1 (baseline) and the no-shift and negative-shift conditions from Experiment 2, respectively. Shaded areas indicate 95% confidence intervals.
We modeled judgments with multilevel logistic regression models implemented using the glmer function within the lme4 package in R (Bates, Mächler, Bolker, & Walker, 2015; R, 2010). We included exposure condition (no-shift vs. negative-shift, contrast-coded), continuum steps (Steps 1–12, mean-centered, coded as a continuous variable), and their interaction as fixed effects. We used the maximum random effect structure justified by the data (Barr, Levy, et al., 2013). When a model did not converge, we removed random slopes with the highest-order interaction terms accounting for the least variance. The final model contained random by-item intercepts and by-item slopes for exposure conditions.
We found main effects of condition (β = .32, p <.001) and step (β = −.18, p <.001). As predicted, participants in the negative-shift condition provided more negative responses. The interaction term was significant (β = .05, p <.03). Participants in the negative-shift condition were more likely to provide negative responses for items closer to the higher end of the continuum than participants in the no-shift condition (i.e., Step 12). This suggests that listeners recalibrated their interpretations of It looks like an X to better reflect the statistics of the recent input from exposure items.
The current results cannot be solely attributable to low-level perceptual shifts due to pitch range normalization. If the exposure items were sampled from a narrower range in the negative-shift than in the no-shift condition, corresponding pitch-range narrowing could lead listeners in the negative-shift condition to interpret subtle pitch excursion on LOOKS in the mid-range items as meaningful, boosting the negative interpretation for these otherwise ambiguous items. However, as illustrated in Figure 7, the negative-shift condition included a wider range of intonation contours including extremes from the continuum (Steps 1–2 + Steps 10–12 in addition to the ambiguous middle range) than the no-shift condition (Steps 11–12 but not the other end of the continuum). We assume that the distinct response patterns between the conditions reflect a perceptual shift, which is optimized to map the variable acoustic input onto the two classes of pragmatically meaningful intonational contours. Without further investigations, however, we cannot rule out the possibility that the results represent a post-perceptual shift in listeners’ categorization judgments.
General Discussion
We presented novel evidence that listeners’ categorization of intonation contours can adapt in response to recent exposure. Past studies have reported variable mappings between the intonational input and its interpretations, but most focused on how different discourse contexts altered predictability of intonational contours and their likely interpretations (e.g., Büring, 2003; Calhoun, 2006; Gussenhoven, 2004; Jackendoff, 1972; Pierrehumbert & Hirschberg, 1990). The current study demonstrated that distributional properties of the exposure items subsequently shifted interpretations of identical test items. After listening to only 30 exposure sentences, participants derived largely opposing responses to ambiguous intonational contours.
Crucially, categorization shifts in the negative-shift condition were induced by exposure to contours from only a subset of continuum steps. This shift would not be predicted if listeners were simply learning specific mappings between particular acoustic cue values and interpretations. Rather, the results suggest that listeners are extracting underlying distributional properties of phonological representations from which the observed examples were sampled. In future research it will be important to examine how listeners can dissociate co-related prosodic cue dimensions, such as those manipulated simultaneously in the current experiment, during adaptation (e.g., for a relevant discussion in phoneme perception see Liu & Holt, 2015). It will also be important to examine to what extent speaker-specific information is stored as exemplars (Schweitzer, 2012) and whether adaptation generalizes across constructions and speakers.
Most generally the adaptation effects reported here provide a foundation for future work exploring how listeners store and represent prosodic information in order to efficiently and reliably process speech prosody despite variability across speakers and contexts.
Supplementary Material
Figure 1. Predictions based on a quadratic model of categorization data in the (a) probability space and (b) log-odds space. The dots in (a) are the mean proportions of the 2AFC judgments obtained in Experiment 1. The error bars indicate bootstrapped confidence intervals of the means. The red line in each panel shows the prediction of the quadratic model without any additional assumptions. The blue line shows the prediction of the quadratic model adjusted with lapse rate.
Figure 2: Schematic illustrations of likelihood estimates and posterior probability distributions of two categories with unequal variance. The categorization function curve was generated based on ideal categorizer available at https://hlplab.shinyapps.io/IdealCategorizerOverGaussianCategories/.
Footnotes
For convenience we assume that we are measuring adaptation between acoustic cues and contours (tunes), which are composed of lower-level categories, such as pitch accents and boundary tones. We cannot rule out the possibility that the mapping also involves adaptation from acoustic cues to these phonological representations. This remains a question for future research.
References
- Arvaniti A, Garding G. Dialectal variation in the rising accents of American English. Papers in Laboratory Phonology. 2007;9:547–576. [Google Scholar]
- Bates D, Mächler M, Bolker B, Walker S. Fitting linear Mixed-Effects Models using lme4. Journal of Statistical Software. 2015;1(1) [Google Scholar]
- Barr DJ, Levy R, Scheepers C, Tily HJ. Random effects structure for confirmatory hypothesis testing: Keep it maximal. Journal of Memory and Language. 2013;68(3):255–278. doi: 10.1016/j.jml.2012.11.001. [DOI] [PMC free article] [PubMed] [Google Scholar]
- Beckman ME, Pierrehumbert JB. Intonation structure in Japanese and English. Phonology Yearbook 1986 [Google Scholar]
- Boersma P, Weenink D. Praat: Doing phonetics by computer (Version 5.0.26) [Computer program] 2008. [Google Scholar]
- Breen M, Dilley LC, Kraemer J, Gibson E. Inter-transcriber reliability for two systems of prosodic annotation: ToBI (Tones and Break Indices) and RaP (Rhythm and Pitch) Corpus Linguistics and Linguistic Theory. 2012;8(2) [Google Scholar]
- Büring D. On D-Trees, Beans, and B-Accents. Linguistics & Philosophy. 2003;26(5):511–545. [Google Scholar]
- Calhoun S. PhD Thesis. University of Edinburgh; 2006. Information structure and the prosodic structure of English: A probabilistic relationship. [Google Scholar]
- Clayards M, Tanenhaus MK, Aslin RN, Jacobs RA. Perception of speech reflects optimal use of probabilistic speech cues. Cognition. 2008;108(3):804–809. doi: 10.1016/j.cognition.2008.04.004. [DOI] [PMC free article] [PubMed] [Google Scholar]
- Cutler A. Native listening. MIT Press; 2015. [Google Scholar]
- Dahan D. Prosody and language comprehension. Wiley Interdisciplinary Reviews: Cognitive Science. 2015;6(5):441–452. doi: 10.1002/wcs.1355. [DOI] [PubMed] [Google Scholar]
- Dennison HY, Schafer AJ. Online construction of implicature through contrastive prosody. Speech prosody 2010 conference.2010. [Google Scholar]
- Dilley LC. Pitch range variation in English tonal contrasts: Continuous or categorical? Phonetica. 2010;67(1–2):63–81. doi: 10.1159/000319379. [DOI] [PubMed] [Google Scholar]
- Gussenhoven C. The Phonology of Tone and Intonation. Cambridge University Press; 2004. [Google Scholar]
- Isaacs A, Watson D. Accent detection is a slippery slope: Direction and rate of F0 change drives listeners’ comprehension. Language and Cognitive Processes. 2010;25(7):1178–1200. doi: 10.1080/01690961003783699. [DOI] [PMC free article] [PubMed] [Google Scholar]
- Jackendoff R. Semantic interpretation in generative grammar. MIT Press; 1972. [Google Scholar]
- Kleinschmidt DF, Jaeger TF. Robust speech perception: recognize the familiar, generalize to the similar, and adapt to the novel. Psychological Review. 2015;122(2):148–203. doi: 10.1037/a0038695. [DOI] [PMC free article] [PubMed] [Google Scholar]
- Kraljic T, Samuel AG. Perceptual adjustments to multiple speakers. Journal of Memory and Language. 2007;56(1):1–15. [Google Scholar]
- Kurumada C, Brown M, Bibyk S, Pontillo DF, Tanenhaus MK. Is it or isn’t it: Listeners make rapid use of prosody to infer speaker meanings. Cognition. 2014;133(2):335–342. doi: 10.1016/j.cognition.2014.05.017. [DOI] [PMC free article] [PubMed] [Google Scholar]
- Ladd DR. Intonational phonology. 2. Cambridge University Press; 2008. [Google Scholar]
- Ladd DR, Morton R. The perception of intonational emphasis: continuous or categorical? Journal of Phonetics. 1997;25(3):313–342. [Google Scholar]
- Liberman AM, Cooper FS, Shankweiler DP, Studdert-Kennedy M. Perception of the speech code. Psychological Review. 1967;74(6):431–461. doi: 10.1037/h0020279. [DOI] [PubMed] [Google Scholar]
- Liberman M, Pierrehumbert J. Intonational invariance under changes in pitch range and length. In: Aronoff M, Oehrle R, editors. Language Sound Structure. Cambridge MA: MIT Press; 1984. pp. 157–233. [Google Scholar]
- Liu R, Holt LL. Dimension-based statistical learning of vowels. Journal of Experimental Psychology: Human Perception and Performance. 2015;41(6):1783–1798. doi: 10.1037/xhp0000092. [DOI] [PMC free article] [PubMed] [Google Scholar]
- Maye J, Aslin RN, Tanenhaus MK. The weckud wetch of the wast: Lexical adaptation to a novel accent. Cognitive Science. 2008;32(3):543–562. doi: 10.1080/03640210802035357. [DOI] [PubMed] [Google Scholar]
- Moulines E, Charpentier F. Pitch-synchronous waveform processing techniques for text-to-speech synthesis using diphones. Speech Communication. 1990;9(5–6):453–467. [Google Scholar]
- Norris D, McQueen JM, Cutler A. Prediction, Bayesian inference and feedback in speech recognition. Language, Cognition and Neuroscience. 2015;3798:1–15. doi: 10.1080/23273798.2015.1081703. [DOI] [PMC free article] [PubMed] [Google Scholar]
- Pierrehumbert J, Hirschberg J. The meaning of intonational contours in the interpretation of discourse. In: Cohen PR, Morgan J, Pollack ME, editors. Intentions in communication. 1990. pp. 271–311. [Google Scholar]
- R. Development Core Team, R: A language and environment for statistical computing. R Foundation for Statistical Computing; Vienna, Austria: 2010. [Google Scholar]
- Sag IA, Liberman M. The intonational disambiguation of indirect speech acts. Chicago Linguistic Society. 1975;(11):487–497. [Google Scholar]
- Schweitzer K. PhD dissertation. Universität Stuttgart; 2012. Frequency effects on pitch accents: Towards an exemplar-theoretic approach to intonation. [Google Scholar]
- Silverman K, Beckman M, Pitrelli J, Ostendorf M, Wightman C, Price P, Hirschberg J. ToBI: A standard for labeling English prosody. International Conference on Spoken Language Processing; Banff. 1992. pp. 867–870. [Google Scholar]
- Syrdal AK, McGory J. Inter-transcriber reliability of ToBI prosodic labeling. Proceedings of the ICSLP-20003. 2000;3:235–238. [Google Scholar]
- Taylor P. Analysis and synthesis of intonation using the Tilt model. The Journal of the Acoustical Society of America. 2000;107(3):1697–1714. doi: 10.1121/1.428453. [DOI] [PubMed] [Google Scholar]
- Watson DG, Tanenhaus MK, Gunlogson CA. Interpreting pitch accents in online comprehension: H* vs. L+H*. Cognitive Science. 2008;32(7):1232–1244. doi: 10.1080/03640210802138755. [DOI] [PubMed] [Google Scholar]
Associated Data
This section collects any data citations, data availability statements, or supplementary materials included in this article.
Supplementary Materials
Figure 1. Predictions based on a quadratic model of categorization data in the (a) probability space and (b) log-odds space. The dots in (a) are the mean proportions of the 2AFC judgments obtained in Experiment 1. The error bars indicate bootstrapped confidence intervals of the means. The red line in each panel shows the prediction of the quadratic model without any additional assumptions. The blue line shows the prediction of the quadratic model adjusted with lapse rate.
Figure 2: Schematic illustrations of likelihood estimates and posterior probability distributions of two categories with unequal variance. The categorization function curve was generated based on ideal categorizer available at https://hlplab.shinyapps.io/IdealCategorizerOverGaussianCategories/.