

Abstract
Family and twin studies suggest that genes play a role in male sexual orientation. We conducted a genome-wide association study (GWAS) of male sexual orientation on a primarily European ancestry sample of 1,077 homosexual men and 1,231 heterosexual men using Affymetrix single nucleotide polymorphism (SNP) arrays. We identified several SNPs with p < 10−5, including regions of multiple supporting SNPs on chromosomes 13 (minimum p = 7.5 × 10⁻⁷) and 14 (p = 4.7 × 10⁻⁷). The genes nearest to these peaks have functions plausibly relevant to the development of sexual orientation. On chromosome 13, SLITRK6 is a neurodevelopmental gene mostly expressed in the diencephalon, which contains a region previously reported as differing in size in men by sexual orientation. On chromosome 14, TSHR genetic variants in intron 1 could conceivably help explain past findings relating familial atypical thyroid function and male homosexuality. Furthermore, skewed X chromosome inactivation has been found in the thyroid condition, Graves’ disease, as well as in mothers of homosexual men. On pericentromeric chromosome 8 within our previously reported linkage peak, we found support (p = 4.1 × 10⁻³) for a SNP association previously reported (rs77013977, p = 7.1 × 10⁻⁸), with the combined analysis yielding p = 6.7 × 10⁻⁹, i.e., a genome-wide significant association.
Introduction
While the usual combination of sex chromosomes (XX or XY) predicts sexual orientation and behavior for the vast majority of humans (as heterosexual), variation exists: a stable minority of men (3~4%) are homosexual1 and male sexual orientation appears to be bimodally distributed with most men rating themselves as predominantly heterosexual (Kinsey scale 0–1) or homosexual (Kinsey scale 5–6)1–5. Male sexual orientation is moderately heritable (30~40%), but is multifactorial, with evidence of multiple genetic and environmental contributions, via family studies6–11, twin studies4,12–16, and segregation analyses8,10,11,17. Although focused (i.e., chromosome X) and genome-wide linkage studies (GWLS) of affected (i.e., concordant) sibling pairs have been applied to the trait8,18–22, these have been in relatively small samples prior to our own GWLS23, which showed genome-wide significant linkage to the pericentromeric region of chromosome 8 and strong support for linkage to the previously reported Xq28 region. Although genetic variant(s) contributing to development of male sexual orientation have been mapped to pericentromeric chromosome 8 and chromosome Xq28, the linkage peaks are large and specific trait genes have not been identified.
Genetic association studies for male sexual orientation have been sparse, small, and used either a convenience sample with proxy markers (e.g., blood type) or usually a candidate gene approach, and have yielded negative findings (strongest finding being a nominal p = 0.03)24–27. No genome-wide association studies (GWAS) for male sexual orientation have been heretofore published in the peer-reviewed literature. One meeting report (2012 ASHG) from the company 23andMe analyzed male sexual orientation (N = 13,733 European ancestry men) as a continuous variable28 and identified its strongest association (p = 7.1 × 10⁻⁸, direction unstated) in rs7701397729, an intronic SNP in NKAIN3 (Na+/K+ transporting ATPase interacting 3), which lies in a multipoint linkage peak on the pericentromeric region of chromosome 8 identified by our lab23. To extend our gene mapping efforts for the trait, we report here the results from analyzing 1,109 homosexual and 1,231 heterosexual primarily European ancestry men in the first published GWAS on the trait.
Results/Discussion
We detected several promising regions of multiple SNPs in the 10−5–10−7 p-value range, as seen in the Manhattan plot (Fig. 1), though no SNP reached genome-wide significance (5 × 10⁻⁸). The most prominent of these regions were on chromosomes 13 (minimum p = 7.5 × 10⁻⁷, rs9547443) and 14 (p = 4.7 × 10⁻⁷, rs1035144), where some SNPs had 10−7 < p < 10−6 (each region with 9 to 10 SNPs with p < 10−5, Table S1). There are a number of genes of relevance to the trait in and around these regions, which we describe below. We further note that the most significant SNP (rs77013977, p = 7.1 × 10⁻⁸) in the 23andMe male GWAS29 was nominally associated (p = 4.1 × 10⁻³) in our own GWAS. We used a meta-analytic statistic that did not need direction of effect, Fisher’s combined probability test30, which yielded p = 6.7 × 10⁻⁹ for this SNP, which is the first reported genome-wide significant association for the trait. As previously noted29, rs77013977 is an intronic SNP in NKAIN3, which is one of a family of four proteins (NKAIN1–4) suggested to be critical for neuronal function31.
Figure 1.
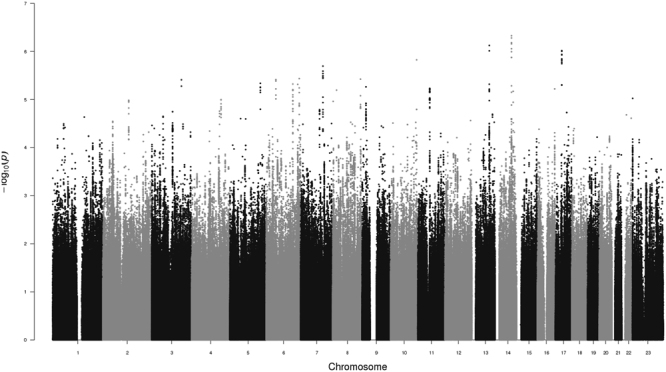
Manhattan Plot of GWAS for Male Sexual Orientation. Plot of negative log10 of the p-values for the single SNP association analysis of 1,077 homosexual and 1,231 heterosexual men, ordered along the x-axis for each chromosome by chromosomal position.
The strongest associated region on chromosome 13 (rs9547443, p = 7.5 × 10⁻⁷) was located between SLITRK6 (SLIT and NTRK like family member 6, ~60 kb centromeric to region) and SLITRK5 (~1.8 Mb telomeric), with SLITRK1 located ~2.0 Mb centromeric. Members of the SLITRK protein family are brain-expressed neuronal transmembrane proteins that regulate neuronal outgrowth, survival, and synapse formation; SLITRKs have significant homology to the secreted axonal growth-controlling SLIT family of proteins and also homology to the neurotrophic tyrosine kinase receptor (NTRK) family32–34. SLITRK6 is expressed especially in the diencephalon (which contains a region previously reported as differing in size in men by sexual orientation35), and SLITRK1 and SLITRK5 have their highest expression in the cerebral cortex32–34. Gene families, such as the SLITRK family that are important for neurodevelopment and are implicated as candidate genes for various neuropsychiatric phenotypes34, are also of potential relevance to behavioral phenotypes such as sexual orientation.
On chromosome 14, TSHR (thyroid stimulating hormone receptor) spans the region around our most significant SNP (rs1035144, p = 4.7 × 10⁻⁷), and includes a cluster of SNPs with association p < 10−5 in intron 1. TSHR encodes a G protein-coupled transmembrane receptor for thyrothropin (thyroid stimulating hormone) and thyrostimulin, manifests some constitutive activity (i.e., ligand independent), and is a major controller of thyroid cell metabolism36–38. While the main tissue of interest and expression for TSHR is the thyroid gland, TSHR is expressed in other tissues including brain especially in neuron-rich areas (e.g., hippocampus)39. TSHR codes for the major autoantigen in the autoimmune hyperthyroidism of Graves’ disease, which is associated (p < 10−20 with OR’s 1.4~1.5) with intron 1 polymorphisms40–48. A recent population-based study found that 5,351 same-sex married men among the assayed population of 2,252,751 Danish men had an elevated rate ratio of Graves’ disease (RR = 1.88; 95% CI = 1.08–3.01), a finding which held when excluding men with HIV/AIDS49. The authors49 speculate on the possibility that a genetic (or other prenatal) factor might tie together this increased risk for a type of hyperthyroidism (Graves’ disease) with separate observations of lower body weight for homosexual versus heterosexual men (independent of diet or exercise)50–52. Females with Graves’ disease have been reported to manifest biased X chromosome inactivation53–55, and skewed X chromosome inactivation has also been reported in mothers of homosexual men compared to age-matched mothers of heterosexual men56. Furthermore, a recent retrospective chart review of 790 adolescents (8 to 17 years) previously admitted to a child psychiatry service found 15 mothers with a history of thyroid dysfunction during pregnancy, 16 adolescents with a history of same-sex attraction and/or gender nonconformity, and 12 overlapping mother-offspring pairs with both (p < 0.0001), suggestive of a possible relationship57. Thus converging findings, including suggestive evidence from the current study, point to a possible connection between thyroid function and sexual orientation in men.
The main limitations of the current study include an exclusive focus on males, sampling primarily from one ancestral group (European), combination of two datasets, and most notably the modest sample size for a GWAS on a trait with complex genetics. Additional and larger sample sizes would be required to assess which loci might breach genome-wide significance for association in a single study, and to increase the number of such loci (as typically is the case with phenotypes with manifesting complex genetics58,59). Nevertheless, our study provides support for the top finding from a previous meeting report of a GWAS on the trait29, reaching genome-wide significance for the combined analysis of rs77013977 (p = 6.7 × 10⁻⁹) on pericentromeric chromosome 8. In addition, the current study’s top two association peaks (p < 10−5; Fig. 1) provide interesting and perhaps trait-relevant examples of their closest genes on chromosomes 13 (SLITRK6) and 14 (TSHR), though these potential connections are best characterized as speculative. The continued genetic study of male sexual orientation should help open a gateway to other studies focusing on genetic and environmental mechanisms of sexual orientation and development. Detectable genetic variants predisposing to homosexuality would have alternative alleles, which would necessarily predispose to heterosexuality, thus contributing to understanding of both typical heterosexual and minority homosexual orientations.
Methods
Study Sample
We obtained institutional review board approval from NorthShore University HealthSystem, and after a study description all enrolled subjects gave informed consent. All methods were performed in accordance with the relevant guidelines and regulations. Our GWAS analyzed sample of primarily European ancestry men included a total of 1,077 homosexual and 1,231 heterosexual men, comprised as follows. In our GWLS on 409 pairs of homosexual brothers in 384 multiplex families23, we classified men as homosexual based on both their self-reported sexual identity and sexual feelings (Kinsey 5–6). Isolated DNA samples were genotyped (Affymetrix 5.0 SNP array) at Vanderbilt Microarray Shared Resource. For this GWAS, after removing 12 families (two homosexual brothers each) for being ancestry outliers via principal components analysis (PCA), we included all remaining homosexual males (N = 769) and all heterosexual males (N = 33) from the GWLS dataset (372 families, each with two or more homosexual brothers, Supplementary Table S2). In addition, we genotyped (same Affymetrix 5.0 platform) additional males (same phenotypic definitions), with the following subjects being retained after quality control (QC, below): 221 homosexual males and 13 heterosexual males (from 227 partially completed linkage families, i.e., reported to contain two or more homosexual brothers, Supplementary Table S2), and 51 sporadic homosexual males (i.e., without homosexual brothers). The aforementioned subjects were collected as previously described23, largely from community festival venues. We also incorporated our Molecular Genetics of Schizophrenia (MGS) collaboration controls dataset (the male, European ancestry portion retained after QC: 36 homosexual and 1,185 heterosexual) that was genotyped with Affymetrix 6.0 at the Broad Institute, and was queried regarding sexual orientation (identity)60,61.
Statistical analysis
As part of the QC design to help minimize errors due to platform-specific genotype calling differences, we genotyped 34 duplicate subjects on both platforms (Affymetrix 5.0 and 6.0), removing SNPs discrepant for any of the 34 inter-platform duplicates (Supplementary Table S3). Our further standard GWAS QC62,63 filters included removal of SNPs (minor allele frequency, MAF < 0.05; missingness ≥1%; Hardy-Weinberg equilibrium [HWE] deviation p < 10−6; Supplementary Table S4) and removal of samples (missingness > 5%; failing checks for duplications and relatedness; ancestry outliers via PCA; Supplementary Table S3, and also see Supplementary Figure S1 for plotting of PC1 and PC2), resulting in λ1000 = 1.029 (i.e., a low genomic inflation factor). For the X chromosome, we followed the same QC protocol, but estimated HWE only in females (mothers in multiplex families). The pseudoautosomal regions (PAR) were removed prior to analysis. We imputed to 1,000 Genomes64 using the IMPUTE2 software65 (removing SNPs with an information score < 0.6, MAF < 0.05) prior to performing GWAS analyses. The final QC’d SNP dataset contained a total of 5,642,880 retained SNPs (200,367 typed and 5,442,513 imputed). Association analysis was conducted using logistic regression with typed and imputed data in the R package, Genome-Wide Association analyses with Family (GWAF)66, with PC1 and PC2 as covariates. Regional association plots for the two regions highlighted in Supplementary Table S1 are displayed in Supplementary Figure S2.
Data Availability
The MGS collaboration controls dataset has been previously deposited into the database of Genotypes and Phenotypes (dbGaP, dbgap.ncbi.nlm.nih.gov, phs000021 and phs000167). The GWLS dataset generation was previously described23. For all studied subjects, additional information is included within the accompanying supporting information (Supplementary Tables S1–S4 and Supplementary Figures S1-S2). The results from all data analyzed during this study are included or displayed in this published article (and its Supplementary Information files, such as the Manhattan plot and PCA plot), though only top individual SNP results for the two strongest regions are tabulated (Table S1) and regionally displayed (Figure S2). However, other individual SNP results may be made available from the corresponding author on reasonable request.
Electronic supplementary material
Acknowledgements
This work was supported by NICHD: the Eunice Kennedy Shriver National Institute of Child Health and Human Development (A.R.S., grant no. R01HD041563 for the Affymetrix 5.0 genotyped sample and A.R.S. and E.R.M., grant no. R21HD080410 for various analyses), and by the Molecular Genetics of Schizophrenia (MGS) Collaboration for the Affymetrix 6.0 genotyped sample. The MGS Collaboration includes P.V.G., A.R.S., and J.D., in addition to the individuals in the MGS Collaboration group author list. MGS was mainly supported by R01MH059571, R01MH081800, and U01MH079469 (to P.V.G.), and other NIH grants for other MGS sites (R01MH067257 to N.G.B., R01MH059588 to B.J.M., R01MH059565 to R.F., R01MH059587 to F.A., R01MH060870 to W.F.B., R01MH059566 to D.W.B., R01MH059586 to J.M.S., R01MH061675 to D.F.L., R01MH060879 to C.R.C., U01MH046276 to C.R.C., and U01MH079470 to D.F.L). We thank the men for their participation, Timothy F. Murphy for his work on the community advisory board and study website, and Besiana Liti for technical assistance.
Author Contributions
A.R.S. conceived the experiment. A.R.S., K.D., G.R., R.S.K., A.B.K. and J.M.B. collected the sample. A.R.S., K.D., G.R. and J.M.B. advised and contributed to the phenotypic characterization. A.R.S., J.A.B., E.S.G., J.D. and P.V.G. advised and contributed to the genotypic characterization. G.W.B., S.G. and E.R.M. conducted the statistical analyses. A.R.S., G.W.B., S.G., G.R., J.M.B., and E.R.M. wrote the main manuscript text. A.R.S., G.W.B., S.G. and E.R.M. prepared figures and tables. MGS Collaboration (J.S., D.F.L., J.D., A.R.S., B.J.M., A.O., F.A., C.R.C., D.M.S., J.M.S., N.G.B., W.F.B., D.W.B., R.F. & P.V.G.) provided the Affymetrix 6.0 genotyped sample. All authors reviewed the manuscript.
Competing Interests
The authors declare that they have no competing interests.
Footnotes
A comprehensive list of consortium members appears at the end of the paper
Electronic supplementary material
Supplementary information accompanies this paper at 10.1038/s41598-017-15736-4.
Publisher's note: Springer Nature remains neutral with regard to jurisdictional claims in published maps and institutional affiliations.
Contributor Information
Alan R. Sanders, Email: alan.sanders.md@gmail.com
MGS Collaboration:
Jianxin Shi, Douglas F. Levinson, Bryan J. Mowry, Ann Olincy, Farooq Amin, C. Robert Cloninger, Dragan M. Svrakic, Jeremy M. Silverman, Nancy G. Buccola, William F. Byerley, Donald W. Black, and Robert Freedman
References
- 1.Laumann, E. O., Gagnon, J. H., Michael, R. T. & Michaels, S. The Social Organization of Sexuality: Sexual Practices in the United States (University of Chicago Press, 1994).
- 2.Kinsey, A. C., Pomeroy, W. B. & Martin, C. E. Sexual Behavior in the Human Male (W. B. Saunders Company, 1948). [DOI] [PMC free article] [PubMed]
- 3.Pillard RC, Bailey JM. Human sexual orientation has a heritable component. Hum. Biol. 1998;70:347–365. [PubMed] [Google Scholar]
- 4.Bailey JM, Dunne MP, Martin NG. Genetic and environmental influences on sexual orientation and its correlates in an Australian twin sample. J. Pers. Soc. Psychol. 2000;78:524–536. doi: 10.1037/0022-3514.78.3.524. [DOI] [PubMed] [Google Scholar]
- 5.Bailey JM, et al. Sexual Orientation, Controversy, and Science. Psychol. Sci. Public Interest. 2016;17:45–101. doi: 10.1177/1529100616637616. [DOI] [PubMed] [Google Scholar]
- 6.Pillard RC, Weinrich JD. Evidence of familial nature of male homosexuality. Arch. Gen. Psychiatry. 1986;43:808–812. doi: 10.1001/archpsyc.1986.01800080094012. [DOI] [PubMed] [Google Scholar]
- 7.Bailey JM, Pillard RC. A genetic study of male sexual orientation. Arch. Gen. Psychiatry. 1991;48:1089–1096. doi: 10.1001/archpsyc.1991.01810360053008. [DOI] [PubMed] [Google Scholar]
- 8.Hamer DH, Hu S, Magnuson VL, Hu N, Pattatucci AM. A linkage between DNA markers on the X chromosome and male sexual orientation. Science. 1993;261:321–327. doi: 10.1126/science.8332896. [DOI] [PubMed] [Google Scholar]
- 9.Bailey JM, Bell AP. Familiality of female and male homosexuality. Behav. Genet. 1993;23:313–322. doi: 10.1007/BF01067431. [DOI] [PubMed] [Google Scholar]
- 10.Bailey JM, et al. A family history study of male sexual orientation using three independent samples. Behav. Genet. 1999;29:79–86. doi: 10.1023/A:1021652204405. [DOI] [PubMed] [Google Scholar]
- 11.Schwartz G, Kim RM, Kolundzija AB, Rieger G, Sanders AR. Biodemographic and physical correlates of sexual orientation in men. Arch. Sex. Behav. 2010;39:93–109. doi: 10.1007/s10508-009-9499-1. [DOI] [PubMed] [Google Scholar]
- 12.Kirk KM, Bailey JM, Dunne MP, Martin NG. Measurement models for sexual orientation in a community twin sample. Behav. Genet. 2000;30:345–356. doi: 10.1023/A:1026557719181. [DOI] [PubMed] [Google Scholar]
- 13.Kendler KS, Thornton LM, Gilman SE, Kessler RC. Sexual orientation in a U.S. national sample of twin and nontwin sibling pairs. Am. J. Psychiatry. 2000;157:1843–1846. doi: 10.1176/appi.ajp.157.11.1843. [DOI] [PubMed] [Google Scholar]
- 14.Santtila P, et al. Potential for homosexual response is prevalent and genetic. Biol. Psychol. 2008;77:102–105. doi: 10.1016/j.biopsycho.2007.08.006. [DOI] [PubMed] [Google Scholar]
- 15.Langstrom N, Rahman Q, Carlstrom E, Lichtenstein P. Genetic and environmental effects on same-sex sexual behavior: a population study of twins in Sweden. Arch. Sex. Behav. 2010;39:75–80. doi: 10.1007/s10508-008-9386-1. [DOI] [PubMed] [Google Scholar]
- 16.Alanko K, et al. Common genetic effects of gender atypical behavior in childhood and sexual orientation in adulthood: a study of Finnish twins. Arch. Sex. Behav. 2010;39:81–92. doi: 10.1007/s10508-008-9457-3. [DOI] [PubMed] [Google Scholar]
- 17.Rice G, Risch N, Ebers G. Genetics and male sexual orientation. Science. 1999;285:803. doi: 10.1126/science.285.5429.803a. [DOI] [Google Scholar]
- 18.Hu S, et al. Linkage between sexual orientation and chromosome Xq28 in males but not in females. Nat. Genet. 1995;11:248–256. doi: 10.1038/ng1195-248. [DOI] [PubMed] [Google Scholar]
- 19.Sanders, A. R. et al. Genetic linkage study of male homosexual orientation. 151st Annual Meeting (American Psychiatric Association, New Research Abstracts NR149, Toronto, Ontario, Canada, 1998).
- 20.Rice G, Anderson C, Risch N, Ebers G. Male homosexuality: absence of linkage to microsatellite markers at Xq28. Science. 1999;284:665–667. doi: 10.1126/science.284.5414.665. [DOI] [PubMed] [Google Scholar]
- 21.Mustanski BS, et al. A genomewide scan of male sexual orientation. Hum. Genet. 2005;116:272–278. doi: 10.1007/s00439-004-1241-4. [DOI] [PubMed] [Google Scholar]
- 22.Ramagopalan SV, Dyment DA, Handunnetthi L, Rice GP, Ebers GC. A genome-wide scan of male sexual orientation. J. Hum. Genet. 2010;55:131–132. doi: 10.1038/jhg.2009.135. [DOI] [PubMed] [Google Scholar]
- 23.Sanders AR, et al. Genome-wide scan demonstrates significant linkage for male sexual orientation. Psychol. Med. 2015;45:1379–1388. doi: 10.1017/S0033291714002451. [DOI] [PubMed] [Google Scholar]
- 24.DuPree MG, Mustanski BS, Bocklandt S, Nievergelt C, Hamer DH. A candidate gene study of CYP19 (aromatase) and male sexual orientation. Behav. Genet. 2004;34:243–250. doi: 10.1023/B:BEGE.0000017870.77610.52. [DOI] [PubMed] [Google Scholar]
- 25.Wang B, et al. Association analysis between the tag SNP for sonic hedgehog rs9333613 polymorphism and male sexual orientation. J. Androl. 2012;33:951–954. doi: 10.2164/jandrol.110.012849. [DOI] [PubMed] [Google Scholar]
- 26.Macke JP, et al. Sequence variation in the androgen receptor gene is not a common determinant of male sexual orientation. Am. J. Hum. Genet. 1993;53:844–852. [PMC free article] [PubMed] [Google Scholar]
- 27.Ellis L, Ficek C, Burke D, Das S. Eye color, hair color, blood type, and the rhesus factor: Exploring possible genetic links to sexual orientation. Arch. Sex. Behav. 2008;37:145–149. doi: 10.1007/s10508-007-9274-0. [DOI] [PubMed] [Google Scholar]
- 28.Klein, F. The Bisexual Option (The Haworth Press, 1993).
- 29.Drabant, E. M. et al. Genome Wide Association Study of Sexual Orientation in a Large, Web-based Cohort (https://blog.23andme.com/wp-content/uploads/2012/11/Drabant-Poster-v7.pdf). 62nd Annual Meeting (American Society of Human Genetics, Poster 2100W, San Francisco, California, 2012).
- 30.Fisher, R. A. Statistical Methods for Research Workers (Oliver and Boyd, 1925).
- 31.Gorokhova S, Bibert S, Geering K, Heintz N. A novel family of transmembrane proteins interacting with beta subunits of the Na,K-ATPase. Hum. Mol. Genet. 2007;16:2394–2410. doi: 10.1093/hmg/ddm167. [DOI] [PubMed] [Google Scholar]
- 32.Aruga J, Mikoshiba K. Identification and characterization of Slitrk, a novel neuronal transmembrane protein family controlling neurite outgrowth. Mol. Cell. Neurosci. 2003;24:117–129. doi: 10.1016/S1044-7431(03)00129-5. [DOI] [PubMed] [Google Scholar]
- 33.Aruga J, Yokota N, Mikoshiba K. Human SLITRK family genes: genomic organization and expression profiling in normal brain and brain tumor tissue. Gene. 2003;315:87–94. doi: 10.1016/S0378-1119(03)00715-7. [DOI] [PubMed] [Google Scholar]
- 34.Proenca CC, Gao KP, Shmelkov SV, Rafii S, Lee FS. Slitrks as emerging candidate genes involved in neuropsychiatric disorders. Trends Neurosci. 2011;34:143–153. doi: 10.1016/j.tins.2011.01.001. [DOI] [PMC free article] [PubMed] [Google Scholar]
- 35.LeVay S. A difference in hypothalamic structure between heterosexual and homosexual men. Science. 1991;253:1034–1037. doi: 10.1126/science.1887219. [DOI] [PubMed] [Google Scholar]
- 36.Kleinau G, Biebermann H. Constitutive activities in the thyrotropin receptor: regulation and significance. Adv. Pharmacol. 2014;70:81–119. doi: 10.1016/B978-0-12-417197-8.00003-1. [DOI] [PubMed] [Google Scholar]
- 37.Huth S, Jaeschke H, Schaarschmidt J, Paschke R. Controversial constitutive TSHR activity: patients, physiology, and in vitro characterization. Horm. Metab. Res. 2014;46:453–461. doi: 10.1055/s-0034-1375651. [DOI] [PubMed] [Google Scholar]
- 38.Kleinau G, Neumann S, Gruters A, Krude H, Biebermann H. Novel insights on thyroid-stimulating hormone receptor signal transduction. Endocr. Rev. 2013;34:691–724. doi: 10.1210/er.2012-1072. [DOI] [PMC free article] [PubMed] [Google Scholar]
- 39.Crisanti P, et al. The expression of thyrotropin receptor in the brain. Endocrinology. 2001;142:812–822. doi: 10.1210/endo.142.2.7943. [DOI] [PubMed] [Google Scholar]
- 40.Davies TF, Yin X, Latif R. The genetics of the thyroid stimulating hormone receptor: history and relevance. Thyroid. 2010;20:727–736. doi: 10.1089/thy.2010.1638. [DOI] [PMC free article] [PubMed] [Google Scholar]
- 41.Ho SC, Goh SS, Khoo DH. Association of Graves’ disease with intragenic polymorphism of the thyrotropin receptor gene in a cohort of Singapore patients of multi-ethnic origins. Thyroid. 2003;13:523–528. doi: 10.1089/105072503322238773. [DOI] [PubMed] [Google Scholar]
- 42.Dechairo BM, et al. Association of the TSHR gene with Graves’ disease: the first disease specific locus. Eur. J. Hum. Genet. 2005;13:1223–1230. doi: 10.1038/sj.ejhg.5201485. [DOI] [PubMed] [Google Scholar]
- 43.Yin X, Latif R, Bahn R, Tomer Y, Davies TF. Influence of the TSH receptor gene on susceptibility to Graves’ disease and Graves’ ophthalmopathy. Thyroid. 2008;18:1201–1206. doi: 10.1089/thy.2008.0098. [DOI] [PMC free article] [PubMed] [Google Scholar]
- 44.Brand OJ, et al. Association of the thyroid stimulating hormone receptor gene (TSHR) with Graves’ disease. Hum. Mol. Genet. 2009;18:1704–113. doi: 10.1093/hmg/ddp087. [DOI] [PubMed] [Google Scholar]
- 45.Ploski R, et al. Thyroid stimulating hormone receptor (TSHR) intron 1 variants are major risk factors for Graves’ disease in three European Caucasian cohorts. PLoS One. 2010;5:e15512. doi: 10.1371/journal.pone.0015512. [DOI] [PMC free article] [PubMed] [Google Scholar]
- 46.Pujol-Borrell R, Gimenez-Barcons M, Marin-Sanchez A, Colobran R. Genetics of Graves’ Disease: Special Focus on the Role of TSHR Gene. Horm. Metab. Res. 2015;47:753–766. doi: 10.1055/s-0035-1559646. [DOI] [PubMed] [Google Scholar]
- 47.Chu X, et al. A genome-wide association study identifies two new risk loci for Graves’ disease. Nat. Genet. 2011;43:897–901. doi: 10.1038/ng.898. [DOI] [PubMed] [Google Scholar]
- 48.Liu BL, et al. Refined association of TSH receptor susceptibility locus to Graves’ disease in the Chinese Han population. Eur. J. Endocrinol. 2014;170:109–119. doi: 10.1530/EJE-13-0517. [DOI] [PubMed] [Google Scholar]
- 49.Frisch M, Nielsen NM, Pedersen BV. Same-sex marriage, autoimmune thyroid gland dysfunction and other autoimmune diseases in Denmark 1989–2008. Eur. J. Epidemiol. 2014;29:63–71. doi: 10.1007/s10654-013-9869-9. [DOI] [PubMed] [Google Scholar]
- 50.Blanchard R, Bogaert AF. Biodemographic comparisons of homosexual and heterosexual men in the Kinsey interview data. Arch. Sex. Behav. 1996;25:551–579. doi: 10.1007/BF02437839. [DOI] [PubMed] [Google Scholar]
- 51.Frisch M, Zdravkovic S. Body size at birth and same-sex marriage in young adulthood. Arch. Sex. Behav. 2010;39:117–123. doi: 10.1007/s10508-008-9408-z. [DOI] [PubMed] [Google Scholar]
- 52.Deputy NP, Boehmer U. Determinants of body weight among men of different sexual orientation. Prev. Med. 2010;51:129–131. doi: 10.1016/j.ypmed.2010.05.010. [DOI] [PubMed] [Google Scholar]
- 53.Brix TH, et al. High frequency of skewed X-chromosome inactivation in females with autoimmune thyroid disease: a possible explanation for the female predisposition to thyroid autoimmunity. J. Clin. Endocrinol. Metab. 2005;90:5949–5653. doi: 10.1210/jc.2005-1366. [DOI] [PubMed] [Google Scholar]
- 54.Ozcelik T, et al. Evidence from autoimmune thyroiditis of skewed X-chromosome inactivation in female predisposition to autoimmunity. Eur. J. Hum. Genet. 2006;14:791–797. doi: 10.1038/sj.ejhg.5201614. [DOI] [PubMed] [Google Scholar]
- 55.Yin X, Latif R, Tomer Y, Davies TF. Thyroid epigenetics: X chromosome inactivation in patients with autoimmune thyroid disease. Ann. N. Y. Acad. Sci. 2007;1110:193–200. doi: 10.1196/annals.1423.021. [DOI] [PubMed] [Google Scholar]
- 56.Bocklandt S, Horvath S, Vilain E, Hamer DH. Extreme skewing of X chromosome inactivation in mothers of homosexual men. Hum. Genet. 2006;118:691–694. doi: 10.1007/s00439-005-0119-4. [DOI] [PubMed] [Google Scholar]
- 57.Sabuncuoglu O. High rates of same-sex attraction/gender nonconformity in the offspring of mothers with thyroid dysfunction during pregnancy: Proposal of prenatal thyroid model. Ment. Illn. 2015;7:5810. doi: 10.4081/mi.2015.5810. [DOI] [PMC free article] [PubMed] [Google Scholar]
- 58.Robinson MR, Wray NR, Visscher PM. Explaining additional genetic variation in complex traits. Trends Genet. 2014;30:124–132. doi: 10.1016/j.tig.2014.02.003. [DOI] [PMC free article] [PubMed] [Google Scholar]
- 59.Levinson DF, et al. Genetic studies of major depressive disorder: why are there no genome-wide association study findings and what can we do about it? Biol. Psychiatry. 2014;76:510–512. doi: 10.1016/j.biopsych.2014.07.029. [DOI] [PMC free article] [PubMed] [Google Scholar]
- 60.Sanders AR, et al. The internet-based MGS2 control sample: Self report of mental illness. Am. J. Psychiatry. 2010;167:854–865. doi: 10.1176/appi.ajp.2010.09071050. [DOI] [PMC free article] [PubMed] [Google Scholar]
- 61.Shi J, et al. Common variants on chromosome 6p22.1 are associated with schizophrenia. Nature. 2009;460:753–757. doi: 10.1038/nature08192. [DOI] [PMC free article] [PubMed] [Google Scholar]
- 62.Laurie CC, et al. Quality control and quality assurance in genotypic data for genome-wide association studies. Genet. Epidemiol. 2010;34:591–602. doi: 10.1002/gepi.20516. [DOI] [PMC free article] [PubMed] [Google Scholar]
- 63.Turner, S. et al. Quality control procedures for genome-wide association studies. Curr. Protoc. Hum. Genet. Chapter 1, Unit119 (2011). [DOI] [PMC free article] [PubMed]
- 64.Abecasis GR, et al. A map of human genome variation from population-scale sequencing. Nature. 2010;467:1061–1073. doi: 10.1038/nature09534. [DOI] [PMC free article] [PubMed] [Google Scholar]
- 65.Howie BN, Donnelly P, Marchini J. A flexible and accurate genotype imputation method for the next generation of genome-wide association studies. PLoS Genet. 2009;5:e1000529. doi: 10.1371/journal.pgen.1000529. [DOI] [PMC free article] [PubMed] [Google Scholar]
- 66.Chen MH, Yang Q. GWAF: an R package for genome-wide association analyses with family data. Bioinformatics. 2010;26:580–581. doi: 10.1093/bioinformatics/btp710. [DOI] [PMC free article] [PubMed] [Google Scholar]
Associated Data
This section collects any data citations, data availability statements, or supplementary materials included in this article.
Supplementary Materials
Data Availability Statement
The MGS collaboration controls dataset has been previously deposited into the database of Genotypes and Phenotypes (dbGaP, dbgap.ncbi.nlm.nih.gov, phs000021 and phs000167). The GWLS dataset generation was previously described23. For all studied subjects, additional information is included within the accompanying supporting information (Supplementary Tables S1–S4 and Supplementary Figures S1-S2). The results from all data analyzed during this study are included or displayed in this published article (and its Supplementary Information files, such as the Manhattan plot and PCA plot), though only top individual SNP results for the two strongest regions are tabulated (Table S1) and regionally displayed (Figure S2). However, other individual SNP results may be made available from the corresponding author on reasonable request.