Abstract
Purpose
Children with acute myeloid leukemia (AML) whose disease is refractory to standard induction chemotherapy therapy or who experience relapse after initial response have dismal outcomes. We sought to comprehensively profile pediatric AML microRNA (miRNA) samples to identify dysregulated genes and assess the utility of miRNAs for improved outcome prediction.
Patients and Methods
To identify miRNA biomarkers that are associated with treatment failure, we performed a comprehensive sequence-based characterization of the pediatric AML miRNA landscape. miRNA sequencing was performed on 1,362 samples—1,303 primary, 22 refractory, and 37 relapse samples. One hundred sixty-four matched samples—127 primary and 37 relapse samples—were analyzed by using RNA sequencing.
Results
By using penalized lasso Cox proportional hazards regression, we identified 36 miRNAs the expression levels at diagnosis of which were highly associated with event-free survival. Combined expression of the 36 miRNAs was used to create a novel miRNA-based risk classification scheme (AMLmiR36). This new miRNA-based risk classifier identifies those patients who are at high risk (hazard ratio, 2.830; P ≤ .001) or low risk (hazard ratio, 0.323; P ≤ .001) of experiencing treatment failure, independent of conventional karyotype or mutation status. The performance of AMLmiR36 was independently assessed by using 878 patients from two different clinical trials (AAML0531 and AAML1031). Our analysis also revealed that miR-106a-363 was abundantly expressed in relapse and refractory samples, and several candidate targets of miR-106a-5p were involved in oxidative phosphorylation, a process that is suppressed in treatment-resistant leukemic cells.
Conclusion
To assess the utility of miRNAs for outcome prediction in patients with pediatric AML, we designed and validated a miRNA-based risk classification scheme. We also hypothesized that the abundant expression of miR-106a could increase treatment resistance via modulation of genes that are involved in oxidative phosphorylation.
INTRODUCTION
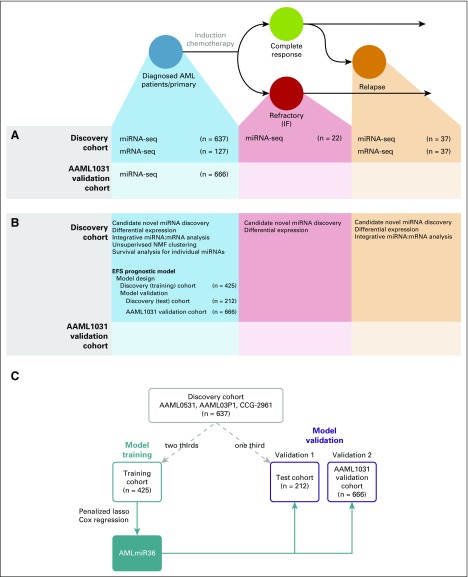
Acute myeloid leukemia (AML) comprises almost 25% of pediatric leukemias1 and is characterized by genetic alterations that lead to impaired differentiation and clonal expansion.2 Approximately 80% of patients achieve complete response after the induction chemotherapy, 40% of whom subsequently suffer from relapsed disease1,3 (Fig 1).
Fig 1.
Transcriptome analysis of pediatric acute myeloid leukemia (AML). Schematic diagram of our experimental design and possible outcome trajectories of pediatric patients with AML. Data set consists of primary samples that are obtained at the time of diagnosis (blue), relapse samples (orange), and induction failure (IF)/refractory samples (red). (A) Sequence data (miRNA sequencing [miRNA-seq] and mRNA sequencing [mRNA-seq]) generated in our study. Samples were obtained in two batches: the discovery cohort consisted primarily of diagnostic samples from the AAML0531 trial (n = 528), but also included a few samples from the AAML03P1 (n = 71) and CCG-2961 (n = 38) trials; the AAML1031 validation cohort consisted of patients from the more recent AAML1031 trial (n = 666). (B) Analyses were performed for each sample and sequence data type. The bulk of the analyses were performed on primary (diagnostic) samples from the discovery cohort. (C) Study design for the training and validation of AMLmiR36. The discovery cohort (gray box) was randomly divided into a training cohort (two thirds; n = 425) and test cohort (one third; n = 212). AMLmiR36 (filled blue box) was trained on data from the training cohort (blue box) and validated on independent data from the test cohort and AAML1031 validation cohort (gold boxes). EFS, event-free survival; NMF, non-negative matrix factorization.
Pediatric AML patients separate into distinct risk categories on the basis of specific chromosomal alterations.1,2 Somatic mutations in genes—such as FLT3, NPM1, and CEBPA—have been associated with outcome and are used as prognostic markers1; however, approximately 60% of children with AML who lack clinically informative mutation profiles are not amenable to risk-based therapy allocation solely on the basis of cytogenetic/molecular subgroups. In these patients, risk of relapse (RR) cannot be determined at diagnosis, as risk is assessed by using measurements of minimal residual disease obtained after the first round of induction chemotherapy1; therefore, the identification of additional biomarkers and therapeutic targets may enhance existing risk-based therapy schemas whereby either those with high RR or those with appropriate targets for directed therapy can be allocated to an alternative therapy to optimize outcome and minimize toxicity.1
Efforts to identify patients who are destined to experience treatment failure are ongoing,4,5 and evaluations of microRNA (miRNA) dysregulation to support this endeavor have been reported. For example, probe-based methods have been used to profile miRNA expression in pediatric AML6-11 and have identified expression patterns that are characteristic of AML subtypes6,7 or inferior outcomes8-12; however, the full complement of miRNA expression has not been comprehensively assessed to produce a meaningful signature with which to predict patient outcomes.
miRNA sequencing provides unbiased digital read counts of miRNA expression and the opportunity to discover novel miRNA transcripts.13 By using this technology, The Cancer Genome Atlas has generated sequence profiles of 200 adult AML patients14; however, some genetic events observed in adults seem to be rare or absent in pediatric AML,15 which limits the applicability of data from adults to children and indicates a need to directly profile pediatric AML samples.
Here, we provide a detailed analysis of miRNA dysregulation in pediatric patients with AML, including expression patterns of previously annotated and novel miRNAs and identification of candidate miRNA:mRNA interactions. We designed AMLmiR36, a miRNA-based predictor of post–standard induction chemotherapy outcome in childhood AML. AMLmiR36 is the first mutation and translocation-independent schema to identify event-free survival (EFS) in children with AML and offers the potential for improved patient stratification and management.
PATIENTS AND METHODS
Patient Samples and Treatment Protocol
Our Discovery Cohort data set consisted of diagnostic, refractory, and relapse samples from 654 patients who were enrolled in one of the following pediatric AML studies: AAML0531 (n = 528),16 AAML03P1 (n = 71),17 or CCG-2961 (n = 38).18 The Medical Research Council–based therapy backbone16 was identical in AAML0531 and AAML03P1 trials. We also obtained 666 cases from the AAML1031 trial to validate our findings.
Patients who were enrolled in the AAML0531 trial who were deemed to be at high risk received hematopoietic stem cell transplantation (HSCT). Eighty-two patients received HSCT in the first round of induction chemotherapy compared with 401 patients who received chemotherapy consolidation. In AAML1031, a criterion for exclusion from analysis was high allelic ratio FLT3-ITD. Such patients were deemed to be high risk and received a different treatment regimen.
Analytic Platforms
We generated miRNA sequencing data from 1,303 primary, 22 refractory, and 37 relapse samples, as well as mRNA sequencing data from 127 primary and 37 relapse samples (Fig 1A and Data Supplement). Sequencing for all samples was performed by using the Illumina Hi-SEquation 2500 (Illumina, San Diego, CA). miRNA sequencing data were aligned to hg19 and annotated on the basis of miRBase (version 21).19 All data sets and sequences are available online (dbGaP accession no.: phs000465; SRA accession no.: SRP012000).20,21
Statistical Methods
Patient baseline characteristics were compared between groups by using χ2 tests. The miRNA expression threshold—10 or more reads per million mapped reads (RPM) in 10 or more miRNA sequencing libraries—was based on miRBase criteria for high-confidence miRNAs.19 Differentially expressed (DE) miRNAs were identified by using two-tailed Wilcoxon tests, where significantly DE miRNAs were those with Benjamini-Hochberg22 multiple-test corrected P values of < .05. Unsupervised clustering was performed by using non-negative matrix factorization (NMF).23
Univariable analyses were performed by using Cox proportional hazards (PH) regression models24 to assess the association between expression levels of individual miRNAs and EFS or overall survival (OS). Expression level analyses were performed by using low/high expression groups or continuous expression values (log2 RPM). Low/high expression designations were assigned by using X-tile cohort separation25 on EFS data. By using the sample function in R (version 3.3.2), we divided the discovery cohort into training and test cohorts, which consisted of two thirds and one third, respectively, of patients in the discovery cohort. The miRNA-based EFS predictive model that was established in the discovery (training) cohort was tested in the discovery (test) cohort and AAML1031 validation cohort. The model was estimated in the discovery (training) cohort by using penalized lasso Cox PH regression (GLMnet R Package),26 where coefficients that were estimated for each miRNA feature in the training cohort were carried over to the discovery (test) cohort and AAML1031 validation cohort. Coefficients were not re-estimated in either validation cohort. Integrative miRNA:mRNA expression analysis was performed as previously described.13
RESULTS
miRNA Expression in Childhood AML
Filtering the miRNA sequencing data from the discovery cohort (n = 696) against annotated miRNAs revealed 61 candidate novel miRNA species (122 miRNAs; Data Supplement). miRNA expression profiling revealed that 529 miRNAs, including 22 candidate novel miRNAs, were expressed at 10 or more RPM in 10 or more miRNA sequencing libraries (Data Supplement). These miRNAs were included in subsequent analyses.
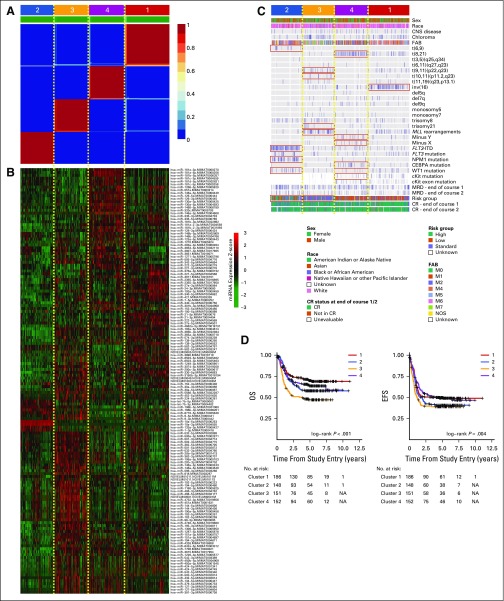
To determine the extent of heterogeneity in miRNA expression across our discovery cohort, we performed NMF clustering by using the miRNA expression profiles of 637 primary samples. This analysis identified four subgroups (Fig 2A and Data Supplement) that were characterized by distinct miRNA expression patterns (Fig 2B and Data Supplement), enriched for cytogenetic and molecular alterations (Fig 2C), and correlated with outcome (Fig 2D). This result was consistent with reports that associated genomic variants with miRNA expression.27
Fig 2.
Unsupervised non-negative matrix factorization (NMF) clustering of miRNA expression profiles of primary samples. (A) NMF consensus map for k = 4 subgroups. Deep red blocks numbered 1 to 4 indicate four subgroups that were identified by using NMF. (B) Heat map displaying the expression of miRNAs that are significantly differentially expressed between subgroups (P < .05, Wilcoxon test proportional hazards regression adjusted; log2 fold change > 1). (C) Covariate tracks displaying the clinical attributes of each patient. Red boxes indicate clinical attributes that enrich one cluster over the others (P < .01, Fisher’s exact test). (D) Kaplan-Meier plots illustrating overall survival (OS) and event-free survival (EFS) status of patients in each subgroup. CR, completed response; FAB, French-American-British; ITD, internal tandem duplication; MRD, minimal residual disease; NA, not applicable.
Our analysis revealed 20 alterations that were associated with miRNA expression (q < 0.05, Wilcoxon test; Data Supplement). Specifically, we confirmed reported associations that included that of t(8;21) with abundant miR-181b, miR-146b, miR-181a, miR-146a, and miR-126, as well as with reduced miR-133; that of NPM1 mutation with abundant miR-10a/b and miR-196b and reduced miR-128, miR126, miR-130a, and miR-451; that of FLT3-ITD with abundant miR-155; that of CEBPA mutation with abundant miR-181a and miR-335; and that of MLL rearrangements with reduced expression of miR-126, miR-125b, miR-146a, miR-181a, miR-146b, and let-7c.27 A full list of associations of miRNA expression with genomic variants is provided in the Data Supplement.
miRNAs Associated With Patient Survival
To identify miRNAs whose expression correlated with outcome, we performed Cox PH regression analyses on low/high expression groups of each expressed miRNA. In the discovery cohort, this analysis revealed that there were 380 miRNAs whose expression was associated with EFS (q < 0.05, univariable Cox PH regression; hazard ratio (HR), 0.509 to 0.795/1.26 to 2.05) and 185 miRNAs that were associated with OS (HR, 0.482 to 0.736/1.36 to 2.32). Two hundred sixteen and 80 miRNAs were associated with EFS (HR, 0.509 to 0.795/1.27 to 2.04) and OS (HR, 0.482 to 0.730/1.36 to 2.32), respectively, independent of conventional risk factors (cytogenetic risk group and WBC cell count; P < .05, multivariable Cox PH regression; Data Supplement). We repeated survival analyses by using data from the AAML1031 validation cohort, which confirmed that 48 and 36 miRNAs were associated with EFS (P < .05, univariable Cox PH regression; HR, 0.003 to 0.798/1.28 to 3.30) and OS (HR, 0.003 to 0.766/1.45 to 2.52), respectively, and that 12 and 5 miRNAs were associated with EFS (HR, 0.003 to 0.789/1.46 to 3.30) and OS (HR, 1.58 to 2.52), respectively, independent of conventional risk factors (P < .05, multivariable Cox PH regression; Data Supplement).
We then performed Cox PH regression analysis on continuous expression values—measured in RPM—of each miRNA. This demonstrated that 66 and 55 miRNAs had linear associations with EFS (q < 0.05, Cox PH regression; HR, 0.730 to 0.946/1.05 to 1.38) and OS (q < 0.05, Cox PH regression; HR, 0.646 to 0.904/1.07 to 1.36), respectively. The same analysis using data from the AAML1031 validation cohort confirmed that 39 and 46 miRNAs had linear associations with EFS (q < 0.05, Cox PH regression; HR, 0.829 to 0.943/1.08 to 1.30) and OS (q < 0.05, Cox PH regression; HR, 0.748 to 0.904/1.07 to 1.42; Data Supplement), respectively. The 31 miRNAs that had linear associations with both OS and EFS in both cohorts are presented in the Data Supplement.
miRNA Expression–Based EFS Predictive Model (AMLmiR36)
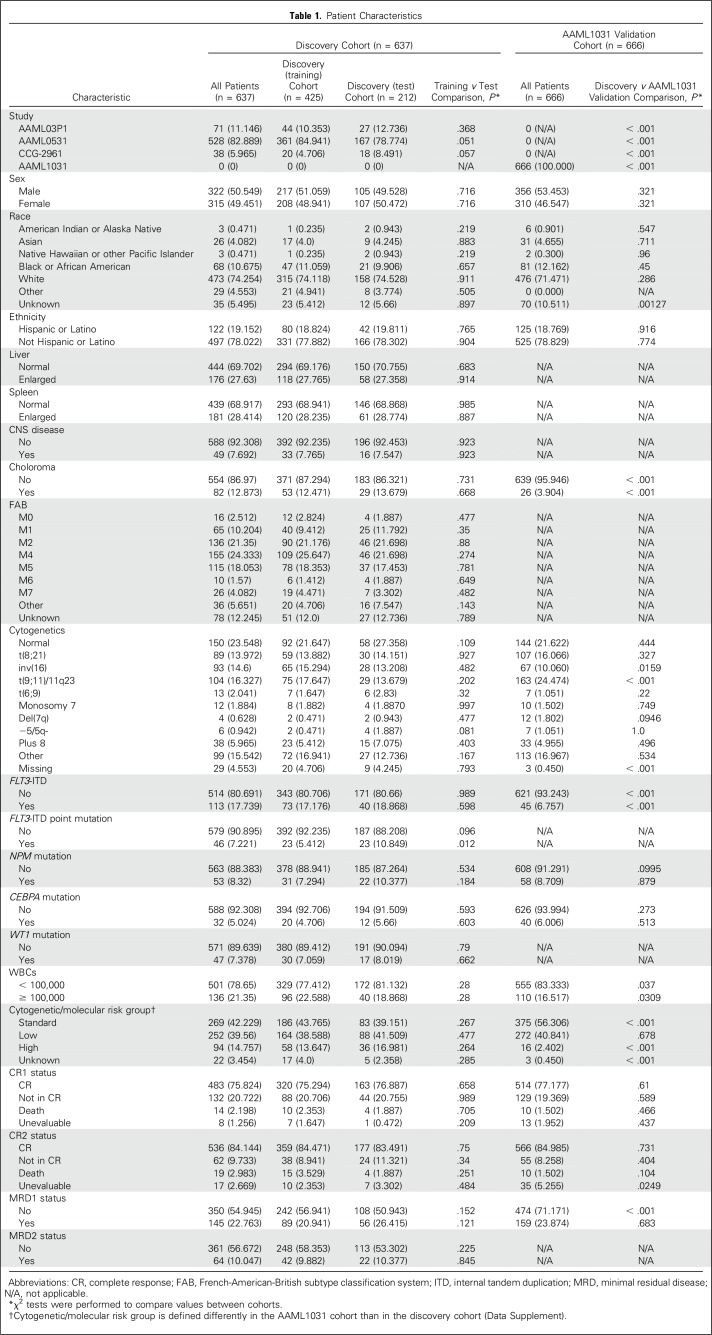
Having observed many individual miRNAs with significant associations with outcome, we next developed a miRNA expression–based predictor of EFS by combining multiple miRNAs. We divided our discovery cohort (n = 637; Table 1) into a discovery (training) cohort (two thirds; n = 425) to generate the model, then tested its performance twice, first in the discovery (test) cohort (one third; n = 212), then subsequently in the AAML1031 validation cohort (Fig 1C). The discovery (training) and discovery (test) cohorts were derived by random selection, and there were no significant differences between cohorts with respect to patient characteristics (P > .01, χ2 test; Table 1). Only previously annotated miRNAs were considered for this analysis.
Table 1.
Patient Characteristics
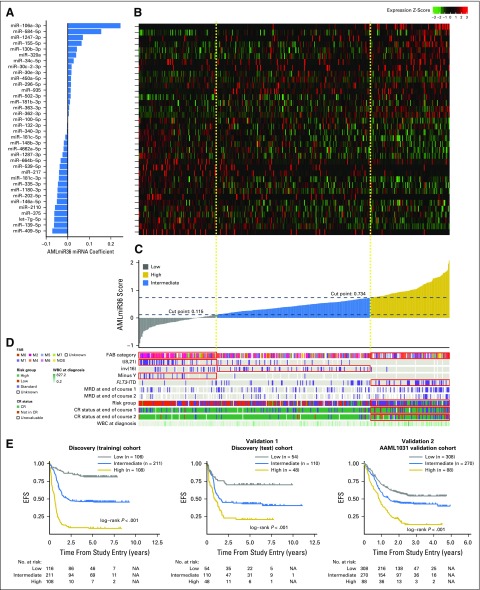
The model was estimated in the discovery (training) cohort by using the penalized lasso Cox PH regression (GLMnet R Package).26 The resulting model was composed of 36 miRNAs (Fig 3A and Data Supplement), of which 16 were overexpressed and 20 were underexpressed in patients who experienced an event (Fig 3B). Only four of 36 miRNAs—miR-155,11 miR-335,10 miR-139,28 and miR-3759—had previously been associated with survival in pediatric AML. We named our model, AMLmiR36.
Fig 3.
miRNA-based event-free survival (EFS) predictive model. (A) Predictor equation coefficients of the 36 miRNA features in the EFS prognostic model. (B) Heat map of relative expression levels of miRNA features across samples in the discovery (training) cohort (n = 425). (C) Model scores of each patient in the discovery (training) cohort derived using the EFS prognostic model. (D) Covariate tracks displaying the clinical attributes of each patient. Red boxes indicate that the model score group is enriched for the indicated attribute (P < .01, Fisher’s exact test). (E) Kaplan-Meier plots displaying EFS differences between patients in various—low, intermediate, and high—model score groups within the discovery (training) cohort (n = 425), the discovery (test) cohort (n = 212), and the AAML1031 validation cohort (n = 666). Patients with high model scores had the poorest outcomes, whereas patients with low model scores had superior outcomes. Cox proportional hazards regression ratios are listed in Table 2. CR, completed response; FAB, French-American-British; ITD, internal tandem duplication; MRD, minimal residual disease; NA, not applicable.
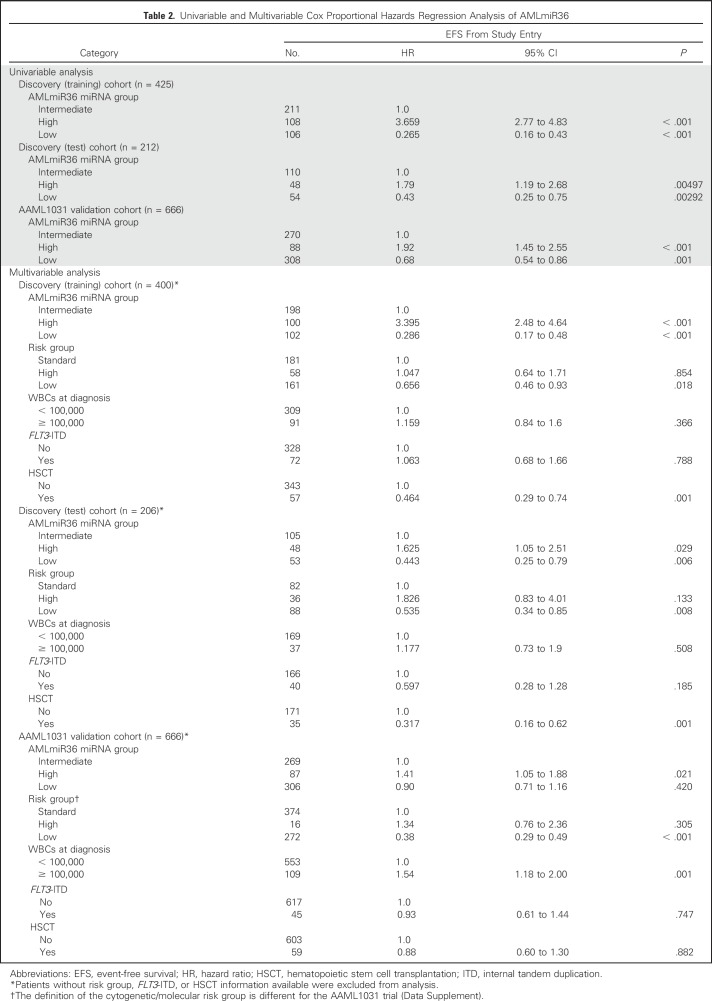
To demonstrate the potential clinical utility of AMLmiR36, we created a miRNA-based risk stratification scheme in which we determined score thresholds in the discovery (training) cohort to separate patients into low, intermediate, and high AMLmiR36 groups (Fig 3C). The AMLmiR36-based risk stratification scheme was significantly associated with EFS (Fig 3E; P < .001). Patients with high AMLmiR36 scores had inferior outcomes (HR, 3.659; 95% CI, 2.77 to 4.83; 5-year EFS, 9.26%; 5-year OS, 29.6%; P < .001), whereas cases with low AMLmiR36 scores had superior outcomes (HR, 0.265; 95% CI, 0.16 to 0.43; 5-year EFS, 84.4%; 5-year OS, 90.3%; P < .001). This observation was validated in both the discovery (test) cohort and the AAML1031 validation cohort (Table 2 and Fig 3E; P < .001).
Table 2.
Univariable and Multivariable Cox Proportional Hazards Regression Analysis of AMLmiR36
The High AMLmiR36 Group Is Independent of Established Indicators of Outcome
We observed an enrichment for patients who were characterized by poor prognostic indicators—that is, high-risk cytogenetics, FLT3-ITD positive29—in the high AMLmiR36 group (P < .05, Fisher’s exact test; Fig 3D and Data Supplement). Despite this, multivariable analyses of the discovery (training), discovery (test), and AAML1031 validation cohorts indicated that the high AMLmiR36 risk group was independent of cytogenetic risk group, WBC count, FLT3-ITD status, and HSCT status (P < .001, multivariable Cox PH regression; Table 2), which are established indicators of outcome. Multivariable analyses of AMLmiR36, along with expression values of the four miRNAs—miR-155,11 miR-335,10 miR-139,28 and miR-3759—that had previously individually associated with survival, indicated that AMLmiR36 is a more robust predictor of EFS than the individual miRNAs (P > .05; Data Supplement). Moreover, with patients for which disease-free survival information was available, we demonstrated the AMLmiR36 was independent of minimal residual disease and RR (P > .05; Data Supplement).
AMLmiR36 Improves the Identification of High-Risk Patients
Patients who were enrolled in AAML0531 and who were deemed to be at high risk received HSCT instead of consolidation chemotherapy. Despite this, AMLmiR36 defined three distinct outcome cohorts in both patients receiving consolidation chemotherapy and HSCT (P < .001, log rank; Data Supplement), which indicated that AMLmiR36 can identify high-risk patients regardless of consolidation therapy received.
The AAML1031 validation cohort was obtained from a clinical trial that was different than that from which the discovery cohort was obtained (Table 1). In AAML1031, as patients with high allelic ratio FLT3-ITD were excluded from analysis, the representation of high-risk patients and the definition of cytogenetic/molecular risk groups were different from the discovery cohort. In particular, the AAML1031 validation cohort had fewer patients with choloroma, inv(16), FLT3-ITD, high WBC, and high cytogenetic/molecular high-risk cases compared with the discovery cohort (P > .05, χ2 test; Table 1). Despite this difference, we addressed whether the AMLmiR36 signature could identify a group of AMLmiR36 high-risk patients despite having excluded the known high-risk patients from the cohort. Our analysis revealed 88 AMLmiR36 high-risk patients who had a 13.6% 3-year EFS rate compared with intermediate patients who had a 42.7% 3-year EFS rate (Table 2 and Fig 3E; P < .001). Moreover, by using the conventional cytogenetic/molecular risk group scheme, 82 (93%) of these 88 AMLmiR36 high-risk patients were classified as only low or standard conventional risk.
We then assessed the performance of AMLmiR36 within the standard conventional risk patients across three different clinical trials (Data Supplement). We noted consistent differences in 3-year EFS rates between AMLmiR36 high and AMLmiR36 intermediate patients (AAML03P1: 18% v 38%; AAML0531: 9% v 41%; 12% v 32%). These evaluations demonstrated that AMLmiR36 could identify a group of high-risk patients from within conventionally assigned risk groups.
miRNA Expression in Treatment-Resistant Samples
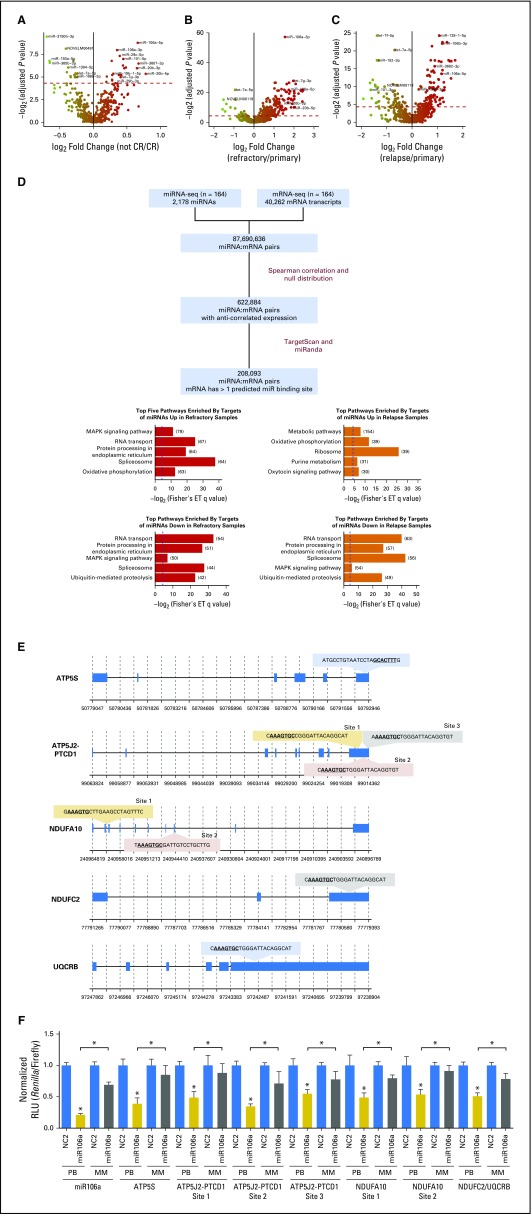
We next conducted DE analyses to identify miRNAs that were associated with induction failure (IF) or relapse. Comparing the diagnostic miRNA expression profiles of patients with and without IF, we revealed 41 miRNAs that were DE between patients who responded and those who did not (q < 0.05, Wilcoxon test; Fig 4A and Data Supplement). We repeated this analysis in the AAML1031 cohort and confirmed that five miRNAs—miR-466, miR-5683, miR-106a-3p, miR-20b-3p, and miR-106a-5p—were consistently more abundantly expressed in patients with IF, whereas three miRNAs—miR-365a-3p, miR-199b-3p, and miR-199a-3p—were consistently less abundantly expressed in patients with IF (P < .05, Wilcoxon test; Data Supplement).
Fig 4.
Integrative miRNA:mRNA analysis to identify putative targets of miRNAs. (A-C) Volcano plots displaying differentially expressed miRNAs (A) between primary samples from patients with refractory disease and primary samples from patients who achieved complete response; (B) between refractory samples and primary samples; and (C) between relapse and primary samples. Red dotted line represents the significant differential expression threshold (q < 0.05). (D) Workflow for miRNA:mRNA integrative analysis. Putative miRNA targets are those mRNA with expression patterns that are not correlated with the expression of their targeting miRNA and that harbor at least one predicted binding site for the targeting miRNA (left). Top five KEGG pathways enriched by targets of miRNAs that are significantly differentially expressed (right). The numbers of target genes that fall into each pathway are indicated in brackets. Blue dotted lines indicate the q value significance threshold, set at 0.05. (E) miR-106a-5p binding sites predicted by both TargetScan and miRanda on candidate target genes that are involved in oxidative phosphorylation: ATP5S, ATP5J2-PTCD1, NDUFA10, NDUFC2, and UQCRB. (F) miR-106a-5p activity in HEK-293 cells was assessed by using a psiCHECK2 dual luciferase reporter construct that contained each of the putative ATP5S, ATP5J2-PTCD1, NDUFA10, or NDUFC2/UQCRB binding sites. Activity is measured as Renilla luminescence normalized to Firefly luminescence to control for transfection efficiencies. Data are shown as normalized relative luciferase units (RLU) with respect to the corresponding dose of the control mimic and are representative of three independent experiments (means ± SEM). Statistically significant comparisons between the cotransfected miR-106a-5p miRNA (20 pmol) and the NC2 control for the perfect binding reporter vector are noted over the solid colored bars. Statistical significance between perfect binding and mismatch constructs are indicated above the comparisons. *P < 0.05. White bars: NC2 negative control mimics; solid gray bars: miR-106a-5p mimics on perfect binding (PB) sites; striped gray bars: mir-106a-5p mimics on mismatched (MM) sites. ET, Fisher’s exact test; MAPK, mitogen-activated protein kinase; seq, sequencing.
In patients with IF, 209 miRNAs were DE between diagnostic and refractory samples (q < 0.05, Wilcoxon test; Fig 4B and Data Supplement), and 156 miRNAs were DE between diagnostic and postinduction relapse samples (q < 0.05, Wilcoxon test; Fig 4C and Data Supplement).
Our DE analyses indicated that two miRNAs—miR-106a-3p and miR-106a-5p—were consistently more abundantly expressed in treatment-resistant contexts—that is, refractory and relapse samples and diagnostic samples of patients with IF (q < 0.05, Wilcoxon test; Figs 4A-4C and Data Supplement). This result is compatible with the notion that these miRNAs could be markers of IF and relapse, and that a study of their expression and function could reveal biology that is important to treatment resistance.
Putative miRNA:mRNA Interactions
To study candidate targets of miRNAs in pediatric AML, we performed an integrative miRNA:mRNA analysis13 by using matched miRNA sequencing and mRNA sequencing data for each patient (Fig 4D and Data Supplement). This analysis revealed 396 miRNAs with at least one putative target (mean, 526; range, 1 to 3,334). Pathways that were significantly enriched by both the putative targets of miRNAs that were abundant in refractory samples and miRNAs that were abundant in relapse samples are displayed in Figure 4D. Of these, only oxidative phosphorylation was among the top five most enriched pathways in the both analyses, which suggests that abundant expression of these miRNAs could suppress oxidative phosphorylation target genes in treatment-resistant disease. A full list of significantly enriched pathways is provided in the Data Supplement (q < 0.05, Fisher’s exact test).
Targets of miR-106a Involved in Oxidative Phosphorylation
miR-106a-3p and miR-106a-5p were consistently abundantly expressed in treatment-resistant contexts (Figs 4A-4C) and were significantly associated with inferior OS and EFS (q < 0.05, univariable Cox PH regression; Data Supplement). Because oxidative phosphorylation was predicted to be consistently dysregulated (Fig 4D), we investigated the targets of miR-106a-5p that were involved in this pathway. To test whether miR-106a-5p can act on predicted miRNA binding sites of genes, constructs that contained the predicted binding sites of oxidative phosphorylation genes—ATP5J2-PTCD1, ATP5S, NDUFA10, and NDUFC2/UQCRB—were generated (Fig 4E) and luciferase reporter assays were performed. Overexpression of miR-106a-5p inhibited the luciferase activity of these constructs in a dose-dependent manner (Fig 4F), which indicated that miR-106a-5p expression could modulate the expression of mRNA targets that harbored these predicted binding sites.
DISCUSSION
We present AMLmiR36, a novel mutation and translocation-independent miRNA-based risk stratification scheme that can identify at the time of diagnosis patients with adverse outcomes. We identified 61 candidate novel miRNAs that were expressed across our discovery cohort. Of these, six were DE between the NMF subgroups, which indicated that they may be important in defining biologic differences between pediatric AML subgroups. Moreover, we revealed nine candidate miRNAs that were DE between primary and relapse samples and three candidate miRNAs that were DE between primary and refractory samples, which indicated that they may be associated with treatment resistance.
We used miRNA expression profiles to identify four patient subgroups that were enriched for cytogenetic aberrations. Similar enrichment was observed in miRNA adult AML.27 We also identified additional associations of miRNA expression with specific cytogenetic alterations (Data Supplement), including those that involved established indicators of outcome—for example, t(8;12), CEBPA mutation, and FLT3-ITD.
Ideally, a robust prognostic biomarker of treatment outcomes would identify a group of patients who were at sufficiently high risk of relapse and treatment resistance early enough in the course of treatment to justify consideration of alternate therapies. Here, we present AMLmiR36, a miRNA expression–based predictor of outcome that is independent of known cytogenetic and molecular risk classifiers. AMLmiR36 was developed and validated on a large cohort (N = 1,303) of primary patient samples. Of importance, AMLmiR36 was able to identify groups of high-risk patients from different clinical trials, independently of established indicators of outcome.
Our integrative miRNA:mRNA analysis provides a global view of candidate miRNA:mRNA interactions and pathways that are dysregulated in pediatric AML. In particular, we show that miRNAs that are abundantly expressed in treatment-resistant contexts seem to target genes that are involved in RNA processing, cellular signaling, and energy metabolism, and their reduced expression in relapse and refractory samples may support a role for quiescence in treatment resistance.30
We show that abundant miR-106a expression was robustly associated with outcome, and its targets genes may be involved in oxidative phosphorylation, a process that is reduced in treatment-resistant cell line populations and consequently results in a quiescent cell state.30 Such quiescent cells may evade therapies that are selective for rapidly dividing and proliferating cells.31 Thus, we speculate that abundant expression of miR-106a-363 could contribute to treatment resistance by repressing oxidative phosphorylation.
Overall, to our knowledge, we provide the first comprehensive sequence-based miRNA expression profiles of primary relapse and refractory pediatric AML, thus cataloguing the full repertoire of known and novel miRNAs. We also report a miRNA-based predictive model and identify miR-106a-363 as a miRNA that may be useful in future explorations of the biology that underpins treatment-resistant pediatric AML.
ACKNOWLEDGMENT
We thank the Library Construction, Biospecimen, Sequencing, and Bioinformatics teams at Canada’s Michael Smith Genome Sciences Centre for expert technical assistance. We are grateful for expert project management assistance provided by Karen Novik, PhD, and for mentorship and guidance provided by Robert Camfield, PhD. This manuscript is a report from the Children’s Oncology Group, and we especially acknowledge the late Robert Arceci, MD, for his leadership in the design of this study. The results published here are in whole or part based on data generated under the Therapeutically Applicable Research to Generate Effective Treatments (TARGET) project managed by the National Cancer Institute. Information about TARGET can be found at https://ocg.cancer.gov/. The data generated for this analysis are available via dbGaP (https://www.ncbi.nlm.nih.gov/gap) under accession number phs000465 and also via the TARGET Data Matrix at the TARGET Data Coordinating Center (http://target.nci.nih.gov/dataMatrix/TARGET_DataMatrix.html). We thank the TARGET Data Coordination Center team, Leandro Hermida, Patee Gesuwan and Tanja Davidsen, as well as Guidry-Auvil, MD, for TARGET management. Supported in part by the Andrew McDonough B+ Foundation.
Footnotes
Funded in whole or in part by the National Institutes of Health, National Cancer Institute (Grant No. HHSN261200800001E), the Children’s Oncology Group Statistics and Data Center (Grants No. U10CA180899 and U10CA098413), the National Clinical Trials Network Operations Center (Grant No. U10CA180886), and from Kimberley Beare and Nathaniel Stoffelsma through the BC Cancer Foundation, and the St Baldrick's Foundation Consortium Grant. E.L.L. is supported by a Canadian Institutes of Health Research Doctoral Award and a University of British Columbia Four-Year Fellowship. M.A.M. holds the University of British Columbia Canada Research Chair in Genome Science and is supported by the BC Cancer Foundation, Genome Canada, Genome British Columbia, the Cancer Research Society, the Leukemia and Lymphoma Society of Canada, and the Canadian Institutes of Health Research (Grant No. FDN-143288).
The content of this publication does not necessarily reflect the views or policies of the Department of Health and Human Services, nor does mention of trade names, commercial products, or organizations imply endorsement by the US Government.
AUTHOR CONTRIBUTIONS
Conception and design: Emilia L. Lim, Richard Aplenc, Lillian Sung, E. Anders Kolb, Alan Gamis, Malcolm Smith, Daniela S. Gerhard, Soheil Meshinchi, Marco A. Marra
Collection and assembly of data: Rhonda E. Ries, Maya Hughes, Andrew J. Mungall, Richard Moore, Yongjun Zhao, Todd A. Alonzo
Data analysis and interpretation: Emilia L. Lim, Diane L. Trinh, Jim Wang, Robert B. Gerbing, Yussanne Ma, James Topham, Erin Pleasance, Todd A. Alonzo, Marco A. Marra
Manuscript writing: All authors
Final approval of manuscript: All authors
Accountable for all aspects of the work: All authors
AUTHORS' DISCLOSURES OF POTENTIAL CONFLICTS OF INTEREST
MicroRNA Expression-Based Model Indicates Event-Free Survival in Pediatric Acute Myeloid Leukemia
The following represents disclosure information provided by authors of this manuscript. All relationships are considered compensated. Relationships are self-held unless noted. I = Immediate Family Member, Inst = My Institution. Relationships may not relate to the subject matter of this manuscript. For more information about ASCO's conflict of interest policy, please refer to www.asco.org/rwc or ascopubs.org/jco/site/ifc.
Emilia L. Lim
No relationship to disclose
Diane L. Trinh
No relationship to disclose
Rhonda E. Ries
No relationship to disclose
Jim Wang
No relationship to disclose
Robert B. Gerbing
Stock or Other Ownership: Pfizer
Yussanne Ma
No relationship to disclose
James Topham
No relationship to disclose
Maya Hughes
Employment: The Everett Clinic
Erin Pleasance
No relationship to disclose
Andrew J. Mungall
No relationship to disclose
Richard Moore
No relationship to disclose
Yongjun Zhao
No relationship to disclose
Richard Aplenc
Honoraria: Sigma-Tau
Travel, Accommodations, Expenses: Sigma-Tau
Lillian Sung
No relationship to disclose
E. Anders Kolb
No relationship to disclose
Alan Gamis
Consulting or Advisory Role: Novartis
Malcolm Smith
No relationship to disclose
Daniela S. Gerhard
No relationship to disclose
Todd A. Alonzo
No relationship to disclose
Soheil Meshinchi
No relationship to disclose
Marco A. Marra
No relationship to disclose
REFERENCES
- 1.Tarlock K, Meshinchi S: Pediatric acute myeloid leukemia: Biology and therapeutic implications of genomic variants. Pediatr Clin North Am 62:75-93, 2015 [DOI] [PubMed] [Google Scholar]
- 2.Schuback HL, Arceci RJ, Meshinchi S: Somatic characterization of pediatric acute myeloid leukemia using next-generation sequencing. Semin Hematol 50:325-332, 2013 [DOI] [PubMed] [Google Scholar]
- 3.Pui C-H, Carroll WL, Meshinchi S, et al. : Biology, risk stratification, and therapy of pediatric acute leukemias: An update. J Clin Oncol 29:551-565, 2011 [DOI] [PMC free article] [PubMed] [Google Scholar]
- 4.Lacayo NJ, Alonzo TA, Gayko U, et al. : Development and validation of a single-cell network profiling assay-based classifier to predict response to induction therapy in paediatric patients with de novo acute myeloid leukaemia: A report from the Children’s Oncology Group. Br J Haematol 162:250-262, 2013 [DOI] [PMC free article] [PubMed] [Google Scholar]
- 5.Ostronoff F, Othus M, Gerbing RB, et al. : NUP98/NSD1 and FLT3/ITD coexpression is more prevalent in younger AML patients and leads to induction failure: A COG and SWOG report. Blood 124:2400-2407, 2014 [DOI] [PMC free article] [PubMed] [Google Scholar]
- 6.Daschkey S, Röttgers S, Giri A, et al. : MicroRNAs distinguish cytogenetic subgroups in pediatric AML and contribute to complex regulatory networks in AML-relevant pathways. PLoS One 8:e56334, 2013 [DOI] [PMC free article] [PubMed] [Google Scholar]
- 7.Zhang H, Luo X-Q, Zhang P, et al. : MicroRNA patterns associated with clinical prognostic parameters and CNS relapse prediction in pediatric acute leukemia. PLoS One 4:e7826, 2009 [DOI] [PMC free article] [PubMed] [Google Scholar]
- 8.Zhu C, Wang Y, Kuai W, et al. : Prognostic value of miR-29a expression in pediatric acute myeloid leukemia. Clin Biochem 46:49-53, 2013 [DOI] [PubMed] [Google Scholar]
- 9.Wang Z, Hong Z, Gao F, et al. : Upregulation of microRNA-375 is associated with poor prognosis in pediatric acute myeloid leukemia. Mol Cell Biochem 383:59-65, 2013 [DOI] [PubMed] [Google Scholar]
- 10.Lin X, Wang Z, Zhang R, et al. : High serum microRNA-335 level predicts aggressive tumor progression and unfavorable prognosis in pediatric acute myeloid leukemia. Clin Transl Oncol 17:358-364, 2015 [DOI] [PubMed] [Google Scholar]
- 11.Xu L-H, Guo Y, Cen J-N, et al. : Overexpressed miR-155 is associated with initial presentation and poor outcome in Chinese pediatric acute myeloid leukemia. Eur Rev Med Pharmacol Sci 19:4841-4850, 2015 [PubMed] [Google Scholar]
- 12.Ramamurthy R, Hughes M, Morris V, et al. : miR-155 expression and correlation with clinical outcome in pediatric AML: A report from Children’s Oncology Group. Pediatr Blood Cancer 63:2096-2103, 2016 [DOI] [PMC free article] [PubMed] [Google Scholar]
- 13.Lim EL, Trinh DL, Scott DW, et al. : Comprehensive miRNA sequence analysis reveals survival differences in diffuse large B-cell lymphoma patients. Genome Biol 16:18, 2015 [DOI] [PMC free article] [PubMed] [Google Scholar]
- 14.Cancer Genome Atlas Research Network. Ley TJ, Miller C, Ding L, et al. : Genomic and epigenomic landscapes of adult de novo acute myeloid leukemia. N Engl J Med 368:2059-2074, 2013 [DOI] [PMC free article] [PubMed] [Google Scholar]
- 15.Ho PA, Kutny MA, Alonzo TA, et al. : Leukemic mutations in the methylation-associated genes DNMT3A and IDH2 are rare events in pediatric AML: A report from the Children’s Oncology Group. Pediatr Blood Cancer 57:204-209, 2011 [DOI] [PMC free article] [PubMed] [Google Scholar]
- 16.Gamis AS, Alonzo TA, Meshinchi S, et al. : Gemtuzumab ozogamicin in children and adolescents with de novo acute myeloid leukemia improves event-free survival by reducing relapse risk: Results from the randomized phase III Children’s Oncology Group trial AAML0531. J Clin Oncol 32:3021-3032, 2014 [DOI] [PMC free article] [PubMed] [Google Scholar]
- 17.Cooper TM, Franklin J, Gerbing RB, et al. : AAML03P1, a pilot study of the safety of gemtuzumab ozogamicin in combination with chemotherapy for newly diagnosed childhood acute myeloid leukemia: A report from the Children’s Oncology Group. Cancer 118:761-769, 2012 [DOI] [PubMed] [Google Scholar]
- 18.Lange BJ, Smith FO, Feusner J, et al. : Outcomes in CCG-2961, a Children’s Oncology Group phase 3 trial for untreated pediatric acute myeloid leukemia: A report from the children’s oncology group. Blood 111:1044-1053, 2008 [DOI] [PMC free article] [PubMed] [Google Scholar]
- 19.Kozomara A, Griffiths-Jones S: miRBase: Annotating high confidence microRNAs using deep sequencing data. Nucleic Acids Res 42:D68-D73, 2014 [DOI] [PMC free article] [PubMed] [Google Scholar]
- 20. National Cancer Institute: TARGET Data Matrix. https://target.nci.nih.gov/dataMatrix/
- 21. National Cancer Institute: The Next Generation Cancer Knowledge Network. https://gdc.cancer.gov/
- 22.Benjamini Y, Hochberg Y: Controlling the false discovery rate: A practical and powerful approach to multiple testing. J R Stat Soc B (Method) 57:289-300, 1995 [Google Scholar]
- 23.Gaujoux R, Seoighe C: A flexible R package for nonnegative matrix factorization. BMC Bioinformatics 11:367, 2010 [DOI] [PMC free article] [PubMed] [Google Scholar]
- 24.Therneau TM, Grambsch PM: Modeling Survival Data: Extending the Cox Model. New York, NY, Springer, 2000. 10.1007/978-1-4757-3294-8 [DOI] [Google Scholar]
- 25.Camp RL, Dolled-Filhart M, Rimm DL: X-tile: A new bio-informatics tool for biomarker assessment and outcome-based cut-point optimization. Clin Cancer Res 10:7252-7259, 2004 [DOI] [PubMed] [Google Scholar]
- 26.Friedman J, Hastie T, Tibshirani R: Regularization paths for generalized linear models via coordinate descent. J Stat Softw 33:1-22, 2010 [PMC free article] [PubMed] [Google Scholar]
- 27.Marcucci G, Mrózek K, Radmacher MD, et al. : The prognostic and functional role of microRNAs in acute myeloid leukemia. Blood 117:1121-1129, 2011 [DOI] [PMC free article] [PubMed] [Google Scholar]
- 28.Emmrich S, Engeland F, El-Khatib M, et al. : miR-139-5p controls translation in myeloid leukemia through EIF4G2. Oncogene 35:1822-1831, 2016 [DOI] [PubMed] [Google Scholar]
- 29.Levis M, Small D: FLT3: ITDoes matter in leukemia. Leukemia 17:1738-1752, 2003 [DOI] [PubMed] [Google Scholar]
- 30.Lagadinou ED, Sach A, Callahan K, et al. : BCL-2 inhibition targets oxidative phosphorylation and selectively eradicates quiescent human leukemia stem cells. Cell Stem Cell 12:329-341, 2013 [DOI] [PMC free article] [PubMed] [Google Scholar]
- 31.Braess J, Jahns-Streubel G, Schoch C, et al. : Proliferative activity of leukaemic blasts and cytosine arabinoside pharmacodynamics are associated with cytogenetically defined prognostic subgroups in acute myeloid leukaemia. Br J Haematol 113:975-982, 2001 [DOI] [PubMed] [Google Scholar]


