

Summary
ATP binding cassette subfamily B member 5 (ABCB5) has been identified as a tumour‐initiating cell marker and is expressed in various malignancies, including melanoma. Moreover, treatment with anti‐ABCB5 monoclonal antibodies has been shown to inhibit tumour growth in xenotransplantation models. Therefore, ABCB5 represents a potential target for cancer immunotherapy. However, cellular immune responses against ABCB5 in humans have not been described so far. Here, we investigated whether ABCB5‐reactive T cells are present in human melanoma patients and tested the applicability of ABCB5‐derived peptides for experimental induction of human T cell responses. Peripheral blood mononuclear cells (PBMNC) isolated from blood samples of melanoma patients (n = 40) were stimulated with ABCB5 peptides, followed by intracellular cytokine staining (ICS) for interferon (IFN)‐γ and tumour necrosis factor (TNF)‐α. To evaluate immunogenicity of ABCB5 peptides in naive healthy donors, CD8 T cells were co‐cultured with ABCB5 antigen‐loaded autologous dendritic cells (DC). ABCB5 reactivity in expanded T cells was assessed similarly by ICS. ABCB5‐reactive CD8+ T cells were detected ex vivo in 19 of 29 patients, melanoma antigen recognised by T cells (MART‐1)‐reactive CD8+ T cells in six of 21 patients. In this small, heterogeneous cohort, reactivity against ABCB5 was significantly higher than against MART‐1. It occurred significantly more often and independently of clinical characteristics. Reactivity against ABCB5 could be induced in 14 of 16 healthy donors in vitro by repeated stimulation with peptide‐loaded autologous DC. As ABCB5‐reactive CD8 T cells can be found in the peripheral blood of melanoma patients and an ABCB5‐specific response can be induced in vitro in naive donors, ABCB5 could be a new target for immunotherapies in melanoma.
Keywords: ABCB5, immunotherapy, melanoma, tumour‐specific T cells
Introduction
During recent years, cancer immunotherapy has experienced a renaissance. First, due to improved understanding of the underlying immune mechanisms and more sophisticated production strategies, cell‐based approaches for immunotherapy were applied successfully, e.g. adoptive T cell therapy or dendritic cell (DC) vaccination strategies 1, 2. Secondly, cancer therapy has been improved greatly by the introduction of various immune check‐point inhibitors (ICI), which induce destruction of tumours by the patient's immune system – this new therapeutic approach is currently tested in various cancers 3, 4. For example, anti‐programmed death 1 (PD‐1) antibodies were efficient in the treatment of metastatic melanoma, renal cell carcinoma and lung cancer 5. However, there is a large group of patients showing no response to ICI treatments 6. In preclinical models, the combination of ICI and immunisation against tumour‐associated antigens (TAA) led to improved responses. In order to induce TAA‐specific T cells, vaccines based on DC have been explored widely 7. Strategies for preparation of autologous clinical‐scale DC have been explored extensively and operational protocols have been published 8, 9. By combining both active immunisation against tumour antigens and treatment with ICI, new treatment options might be found. In order to make such a treatment widely applicable, a TAA expressed in several malignancies would be ideal.
The ATP‐binding cassette subfamily B member 5 (ABCB5), also known as P‐glycoprotein ABCB5, is over‐expressed in melanoma 10, 11, colon carcinoma 12, hepatocellular carcinoma 13 and Merkel cell carcinoma (MCC) 14, and might also play a role in leukaemic cancers 15, 16. Hence, it would be a widely applicable target for immunotherapy. ABCB5 was first described in 2003 by Frank et al. 17 as a phospho‐glycoprotein found on the CD133‐positive progenitor cell subpopulation within human epidermal melanocytes. It has homologies to other members of the ABC protein superfamily, e.g. to ABCB1 [multiple drug resistance 1 (MDR1) protein] and ABCB4/MDR3. ABCB5‐specific antibodies were generated in mice by immunisation against the 16 amino acid (AA) sequence from the extracellular loop 3 (RFGAYLIQAGRMTPEG). The immunoglobulin (Ig)G1κ anti‐ABCB5 monoclonal antibody (mAb) clone 3C2–1D12 (referred to in the following as αABCB5‐3C2) was selected for further studies based on its favourable binding sensitivity and specificity characteristics 17. The antibody was shown to bind both human and murine ABCB5 17, 18, 19, making it an interesting tool for the evaluation of ABCB5 expression and possible effects on ABCB5‐expressing cells. The level of ABCB5 expression correlates with tumourigenicity of melanoma cells 19, is low in naevi and rises with malignant progression. In contrast to ABCB5‐negative tumour cells, ABCB5‐positive tumour cells were shown to induce the growth of primary tumours and metastases. Therefore, ablating ABCB5‐expressing tumour cells might be the key to avoiding melanoma metastasis and relapse. ABCB5 confers chemoresistance in cancer cell lines and tumours in vivo, leading to enrichment of ABCB5‐positive tumour cells after chemotherapy 11, 12. A shRNA‐mediated ABCB5 knock‐down inhibited tumourigenic xenograft growth significantly and sensitised colorectal cancer cells to fluorouracil (5‐FU)‐induced cell killing 12. The same was shown recently for ABCB5‐expressing MCC cell lines and clinical specimens 14, where chemotherapeutic regimens led to enrichment of ABCB5‐positive tumour cells in vitro and in vivo. In combination with other melanoma‐associated markers, such as melanoma chondroitin sulphate proteoglycan (MCSP) and melanoma cell adhesion molecule (MCAM) and a melanoma stem cell marker (CD271), ABCB5 can be used for the isolation and quantification of circulating tumour cells (CTC), which could be a prognostic marker for disease progression or response to treatment 20, 21.
To characterise ABCB5 further as a possible target for cancer immunotherapy, we analysed its immunogenicity in silico and in vitro: an ABCB5 peptide pool was designed and used to screen melanoma patients for an ABCB5‐specific T cell response compared to the well‐characterised melanoma antigen recognised by T cells (MART)‐1. Furthermore, to determine the feasibility of a DC‐based cancer vaccine targeting ABCB5, we explored whether ABCB5‐reactive CD8 T cells can be induced in vitro in healthy donors using autologous, ABCB5 peptide‐pulsed DC.
Materials and methods
ABCB5 peptide pool design
The ABCB5 sequence recognised by the monoclonal antibody (16‐mer peptide RFGAYLIQAGRMTPEG derived from extracellular loop 3‐associated amino acid residues 493–508) was selected for induction of a T cell response, because immunisation against this target can be considered ABCB5‐specific and safe, based on the data obtained with antibody treatment over 8 weeks in mice 19; no strong cross‐reactivity to similar ABC transporters was detectable in in‐house characterisations. The AA sequence RFGAYLIQAGRMTPEG was screened for homologies with other ABC proteins (B1, B4, B11) and modified to reduce cross‐reactivities and to include further non‐homologues AA to enlarge the number of possible epitopes. The resulting peptide pool consisted of the three 15mer peptides, GAYLIQAGRMTPEGM, IQAGRMTPEGMFIVF and MTPEGMFIVFTAIAY (ABCB5‐Loop‐3). Potential epitopes for common major histocompatibility complex (MHC)‐I molecules within these three 15mers were mapped (Supporting information, Fig. S1) 22. The selected ABCB5‐derived peptides were synthesised (JPT, Berlin, Germany) and dissolved in dimethylsulphoxide (DMSO) at 10 nmol/1 µl. An equimolar stock solution consisting of all three peptides was filter‐sterilised and stored in small aliquots at −20°C.
Patient cohort
An ethics vote was obtained before sample gathering commenced (2010‐318N‐MA). Between October 2015 and July 2016, 40 blood samples from patients treated for melanoma in the Clinic for Dermatology, Venereology and Allergy, University Medicine, Mannheim were gathered using ethylenediamine tetraacetic acid (EDTA) monovettes (Sarstedt, Nümbrecht, Germany) after receiving written informed consent. Peripheral blood mononuclear cells (PBMNCs) were isolated by Ficoll (Ficoll Paque Premium; GE Healthcare, Dornstadt, Germany) density gradient centrifugation. Cells were counted, resuspended in cryomedium [CellGro DC; Cellgenix, Freiburg, Germany/10% human serum albumin (HSA), Octalbin; Octapharma, Heidelberg, Germany/10% DMSO; Sigma, Darmstadt, Germany] and frozen in liquid nitrogen until further usage.
Generation of autologous DC and expansion of CD8 T cells
Leucocyte reduction filters for isolation of PBMNCs were purchased from the Institute of Transfusion Medicine, Hannover Medical School, Germany. PBMNCs were isolated by Ficoll density gradient centrifugation. Cells were counted, resuspended in cryomedium and frozen in liquid nitrogen until further use. For monocyte or T cell isolation, cells were thawed and washed with culture medium containing 5% HSA. DC were generated from CD14+ cells enriched using magnetic cell sorting (MACS) technology (Miltenyi Biotec, Bergisch Gladbach, Germany) and differentiated into DC using a modified protocol based on the literature 8, 23. CD14+ were seeded at a final concentration of 2 × 10⁶ cells per 1 ml medium (CellGro DC, CellGenix, Freiburg, Germany), DC differentiation was induced by 1000 IU/ml interleukin (IL)‐4 and 800 IU/ml granulocyte–macrophage colony‐stimulating factor (GM‐CSF) (Miltenyi Biotec). DC were fed on day 4 and matured on day 6 by addition of a maturation cocktail consisting of 2000 IU IL‐1β, 1000 IU IL‐6, tumour necrosis factor (TNF)‐α (Miltenyi Biotec), interferon (IFN)‐γ (Imukin, Boehringer, Germany), 1 µg prostaglandin E2 (PGE2) (Prostin, Pfizer, Austria), 2 µg R848 and 10 µg poly(I:C) (InvivoGen, Toulouse, France) per 1 ml, respectively. After 24 h on day 7, DC were harvested. Mature DC (mDC) were set to 106 cells per 1 ml in CellGro DC medium and incubated with peptides (100 µM ABCB5 peptides; JPT/20 µl per 1 mL MART‐peptide pool; Miltenyi Biotec) for 2 h at 37°C, 5% CO2. Afterwards, loaded mDC were washed. CD8+ T cells were isolated from thawed PBMNCs using CD8 MACS Micro Beads (Miltenyi Biotec), following the manufacturer's instructions. For induction of specific T cell responses, co‐cultures were set up in 24‐well plates using 2 × 10⁶ of CD8+ T cells and 40 000 peptide‐loaded mDC per well. Irradiated (100 Gy) CD8‐negative cells were added as feeder cells. For the first 4 days, cultures were supplemented with 10 IU IL‐2, 50 IU IL‐7 and 50 IU IL‐15 per 1 ml (Immunotools, Friesoythe, Germany). From day 5 onwards, cultures were fed with medium containing 100 IU IL‐2, 50 IU IL‐7 and 50 IU IL‐15 per 1 ml. Cultures were restimulated weekly by addition of loaded mDC (40 000 per well) and feeder cells.
ABCB5 surface staining
Mature monocyte‐derived DC were seeded at 106 cells per 1 ml CellGro DC medium and loaded with different concentrations (100 µM for mDC to be used in co‐cultures) of three ABCB5‐derived 15mer peptides for 2 h at 37°C 5% CO2. Afterwards, cells were washed twice. ABCB5 surface staining of peptide‐loaded DC was then performed using the mouse anti‐human αABCB5‐3C2 antibody (Maine Biotech, Portland, ME, USA) conjugated directly to fluorescein isothiocyanate (FITC) (AbD Serotech/Biorad, Kidlington, UK). Staining was performed for 30 min at room temperature in a 96‐well plate; Fc‐Block (Miltenyi Biotec) was added to lower unspecific background staining. Cells were washed twice and analysed by flow cytometry in a BD Accuri C6 cytometer. For analysis of ABCB5 loading, a gate was set in the forward‐/side‐scatter (FSc/SSc) on mDC to exclude dead cells and debris. The percentage of positive cells in the FITC channel was determined in a histogram.
Intracellular cytokine staining for detection of antigen‐specific T cells
Prior to stimulation, frozen patient samples were thawed, washed in medium and seeded at 106 cells per 1 ml in CellGro DC medium supplemented with 10 IU per 1 mL IL‐2, IL‐7 and IL‐15 and rested overnight. Next day, cells were harvested, counted, set to 5 × 10⁶/ml, seeded into 96‐well plates (Greiner, Frickenhausen, Germany), 200 µl per well, and stimulated overnight with ABCB5‐ or MART‐1 peptide pool in the presence of brefeldin A and monensin to inhibit secretion of induced cytokines. CD28/CD49d co‐stimulatory reagent [Becton Dickinson (BD), Heidelberg, Germany] was added to patient samples to improve stimulation of low‐affinity T cells. Expanded CD8+ T cells from healthy donors were harvested after 4 weeks of co‐culture, washed, counted, set to 5 × 10⁶/ml in CellGro DC medium and seeded for restimulation. An unstimulated control was set up for background correction. Wells incubated with cell activation cocktail (Biolegend, London, UK) were used as positive control. All reagents and antibodies for intracellular cytokine staining (ICS) were purchased from Biolegend. Following peptide stimulation, cells were washed and stained for CD3‐FITC and CD8‐phycoerythrin‐cyanin 7 (PE‐Cy7). For ICS, cells were treated with fixation buffer, followed by ICS permeabilisation wash buffer and stained for IFN‐γ‐PE and TNF‐α‐allophycocyanin (APC). Samples were analysed in a BD fluorescence activated cell sorter (FACS) Aria Fusion (BD, Erembodegem, Belgium); at least 20 000 CD3‐positive events were acquired. Data were exported as FCS files and analysed further (gating strategy is depicted in Supporting information, Fig. S3) using kaluza software (Beckman Coulter, Krefeld, Germany).
Calculations and statistical tests
When calculating the percentage of cytokine‐producing T cells, only populations consisting of at least 10 events and the resulting percentages were considered valid. Thus, if at least 20 000 CD3+CD8+ cells were analysed, a percentage of 0·05% equates to 10 cells. After subtraction of background cytokine levels (unstimulated control), the resulting percentage of cytokine‐producing cells was rated as follows: above 0·05% was considered a positive response and below 0·05% a negative response. All statistical analyses were performed using GraphPad Prism (GPP). A test for normality was performed on data sets; based on the results parametric or non‐parametric tests were chosen for further analyses.
Results
Patient cohort
In our study we examined a typical melanoma patient population treated at a skin tumour centre. A total of 40 samples from melanoma patients were collected, but cell yield after Ficoll‐density gradient isolation of PBMNCs was too low in some cases (n = 11), therefore these were not included in the analyses. In 29 samples, T cell reactivity against ABCB5 could be assessed by ICS; in 21 of these the cell yield allowed for parallel testing of MART‐1 reactivity. The patients’ characteristics are summarised in Table 1. Of the 29 patients, 16 were male and 13 female; five were sampled at stage IB, three patients in stage II, eight patients at stage III and the majority of samples were collected from patients at stage IV (n = 12). Fourteen patients had metastases at the time of blood sampling and 15 were free of metastases. For three patients, samples from two different time‐points were available.
Table 1.
Patient cohort
| Treatments before analysis | |||||||||
|---|---|---|---|---|---|---|---|---|---|
| No. | Stage | Sex | Initial diagnosis | Metastases | Chemotherapy/targeted therapy | Immunotherapy | Radiotherapy | ABCB5 IFN‐γ+ or TNF+ | MART‐1 IFN‐γ+ or TNF+ |
| P01 | IB | M | MM | No | No | No | No | No | No |
| P02 | IB | M | MM | No | No | No | No | Yes | Yes |
| P03 | IB | M | MM | No | No | No | No | Yes | No |
| P04 | IB | F | SSM | No | No | No | No | Yes | (n.d.) |
| P05 | IB | M | SSM | No | No | No | No | No | No |
| P06 | IB | F | MM | No | No | No | No | No | No |
| P07 | IIA | F | SSM | No | No | No | No | Yes | (n.d.) |
| P08 | IIA | M | LMM | No | No | No | No | Yes | No |
| P09 | IIB | M | NMM | No | No | No | No | Yes | Yes |
| P10 | IIIB | M | MM | No | No | No | No | No | No |
| P11 | IIIB | F | MM | No | No | Yes | No | Yes | Yes |
| P12 | IIIB | F | AMM | No | No | Yes | No | Yes | No |
| P13 | IIIB | M | NMM | No | No | No | No | Yes | No |
| P14 | IIIC | F | MM | Yes | Yes | Yes | Yes | Yes | (n.d.) |
| P15 | IIIC | F | MM | Yes | No | No | Yes | Yes | No |
| P16 | IIIC | F | MM | No | Yes | Yes | No | Yes | No |
| P17 | IIIC | F | MM | No | No | No | No | Yes | Yes |
| P18 | IV | F | MM | Yes | Yes | No | No | Yes | No |
| P19 | IV | M | MM | Yes | Yes | Yes | Yes | Yes | No |
| P20 | IV | M | MM | Yes | Yes | Yes | Yes | No | No |
| P21 | IV | M | MM | Yes | No | Yes | No | Yes | Yes |
| P22 | IV | M | NMM | Yes | Yes | Yes | Yes | No | (n.d.) |
| P23 | IV | M | MM | Yes | Yes | Yes | No | No | (n.d.) |
| P24 | IV | M | LMM | Yes | Yes | Yes | Yes | Yes | (n.d.) |
| P25 | IV | F | MM | Yes | No | No | No | Yes | No |
| P26 | IV | F | MM | Yes | Yes | No | Yes | No | No |
| P27 | IV | M | MM | Yes | Yes | Yes | Yes | Yes | Yes |
| P28 | IV | F | MM | Yes | No | No | No | No | (n.d.) |
| P29 | IV | M | MM | Yes | Yes | Yes | No | No | (n.d.) |
Information on patients’ clinical characteristics and reactivity against ATP binding cassette subfamily B member 5 (ABCB5) Loop3 or melanoma antigen recognized by T cells (MART‐1). Patients are sorted by disease stage at blood sampling. ‘Chemotherapy/targeted therapy’ includes kinase inhibitors, dacarbazine and paclitaxel treatments. ‘Stage’ and ‘metastases’ refers to the time‐point of blood sampling; ‘immunotherapy’ includes adjuvant immunotherapy, immune checkpoint blockade, interferon (IFN), RNA vaccine. MM = malignant melanoma; AMM = amelanotic melanoma; SSM = superficial spreading melanoma; LMM = lentigo‐maligna melanoma; NMM = nodular malignant melanoma; M = male; F = female; n.d. = not determined. Rating of ABCB5 or MART‐1 response based on IFN‐γ or tumour necrosis factor (TNF)‐α secretion upon in‐vitro stimulation: yes = cytokine‐secreting cells (IFN‐γ or TNF‐α) above 0·05% background after stimulation with antigen; no = cytokine‐secreting cells (IFN‐γ and TNF‐α) below or equal to 0·05% above background.
Selection of putative epitopes with minimised cross‐reactivity
Based on the epitope used for antibody generation the peptide pool ‘Pool495 (mAB)’/ABCB5‐loop‐3 was designed following bioinformatic analyses, consisting of the following 15mers: GAYLIQAGRMTPEGM, IQAGRMTPEGMFIVF and MTPEGMFIVFTAIAY. MHC‐I‐epitope mapping 22 showing the 10 highest ranked putative epitopes per MHC molecule 22 is summarised in Supporting information, Fig. S1.
ABCB5‐reactive T cells can be detected in melanoma patients
The presence of CD3+CD8+ T cells specific for ABCB5 and MART‐1 was assessed by overnight stimulation of patient PBMNCs, followed by ICS for IFN‐γ or TNF‐α. The reactivity detected against ABCB5 and MART‐1 is summarised in Fig. 1. The ABCB5‐loop‐3 peptide pool led to significantly higher IFN‐γ or TNF‐α production in the CD3+CD8+ compartment compared to stimulation with the MART‐1 peptide pool (Fig. 1b). Analysing the samples from responders (IFN‐γ or TNF‐α in CD3CD8 > 0·05%) and non‐responders (IFN‐γ and TNF‐α in CD3CD8 ≤ 0·05%), Fisher's exact test showed a significant difference between the two antigens. The relative risk was 4·7 and 4·0 and the odds ratios were 12 and 8 for IFN‐γ and TNF‐α cytokine response‐based analysis, respectively; i.e. reactivity against ABCB5‐loop‐3 is more likely than against MART‐1 in the tested patient cohort (Fig. 1c).
Figure 1.
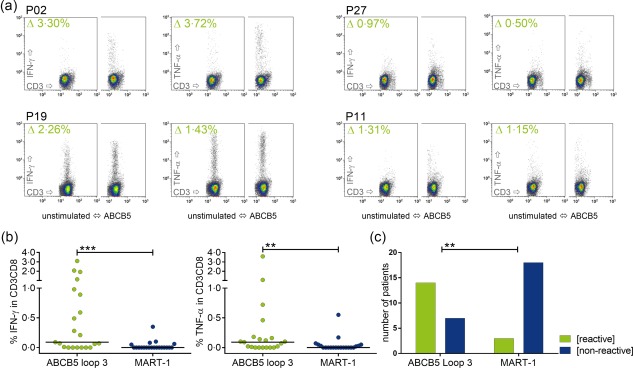
Detection of ATP binding cassette subfamily B member 5 (ABCB5)‐reactive CD3CD8 T cells in melanoma patients (a) Example of fluorescence activated cell sorting (FACS) plots for intracellular cytokine staining (ICS) after overnight stimulation of samples from melanoma patients (P). The density plots for CD3‐FITC fluorescein isothiocyanate (FITC) versus interferon (IFN)‐γ‐phycoerythrin (PE) or tumour necrosis factor (TNF)‐α‐allophycocyanin (APC), respectively, are shown for the CD3+CD8+ population. Complete gating strategy is depicted in Supporting information, Fig. S3. The value in the upper left is the difference between the percentage in the peptide‐stimulated minus the percentage in the unstimulated sample. (b) Comparison of the percentage of cytokine‐secreting CD3+CD8+ T cells after stimulation with ABCB5 compared to melanoma antigen recognised by T cells (MART‐1); only patients in whom both antigens were assessed were included in the analysis (n = 21). Stimulation with ABCB5 leads to significantly higher cytokine levels (Wilcoxon's matched‐pairs signed‐rank test, IFN‐γ P = 0·0002, TNF‐α P = 0·0011). (c) Based on the response to ABCB5 or MART‐1, data were arranged in a contingency table and analysed using Fisher's exact test. Only the analysis of IFN‐γ is depicted here, TNF‐α‐based analysis yielded similar results. Patients in this cohort reacted to ABCB5 significantly more often than to MART‐1 (IFN‐γ Fisher's exact test P = 0·0013, relative risk 4·667, odds ratio 12; TNF‐α Fisher's exact test P = 0·0088, relative risk 4, odds ratio 8).
For three patients (P06, P12 and P19), samples from different time‐points were available. In patient P06, no increase for cytokine production could be seen in in‐vitro stimulation, either for ABCB5‐loop‐3, or for MART‐1, in both samples taken 292 days apart. Samples from patient P12 were taken 195 days apart; this patient showed reactivity against ABCB5‐loop‐3 and no reactivity against MART‐1 at both time‐points, respectively. Reproducibly, in P19, no response against MART‐1 and a strong response against ABCB5‐loop‐3 were detected in both samples taken 98 days apart.
Reactivity against ABCB5‐loop‐3 could not be correlated with clinical characteristics and occurred independently of disease stage, presence of metastases, previous or ongoing immunotherapy or chemotherapy. Overall, 19 of 29 (65·5%) patients tested showed an immune response by raised IFN‐γ or TNF‐α levels compared to patient‐specific background against ABCB5‐loop‐3, while only six of 21 (28·5%) patients tested showed a reaction against MART‐1. As expected, one patient with amelanotic melanoma showed no reactivity against MART‐1; however, MART‐1 responses were rare in this cohort, which might still be too small to find a correlation between responses against the tested antigens and clinical characteristics.
Staining of ABCB5‐derived peptides loaded onto mDC
Surface staining of ABCB5 peptides on mDC was performed in DC generated from healthy donors, peptide doses from 1 to 600 µM were tested, and peptide dose‐dependent staining of mDC with αABCB5‐FITC could be shown after pulsing the DC at a peptide concentration of 200 µM or above (Supporting information, Fig. S2a). Using the same antibody, ABCB5‐expressing cells were detected in primary tumour material (Supporting information, Fig. S2b). Experiments with individual peptides showed that antibody staining is only dose‐dependent for peptide 3 (data not shown); no specific staining occurs when DC are pulsed with a ‘scramble’ peptide (data not shown), consisting of the AA from the original sequence used for antibody generation, but in a different order.
Induction of CD8+ T cell response against ABCB5 in healthy donors using peptide‐pulsed DC
To explore immunogenicity of ABCB5 in vitro, CD8+ T cells of healthy donors were co‐cultured with ABCB5 peptide‐loaded autologous mDC for 2–4 weeks. DC were assessed initially in selected donors (n = 10) for expression of relevant surface markers [median expression CD209 > 55%, CD80 > 85%, CD83 > 85%, CD86 > 90%, human leucocyte antigen D‐related (HLA‐DR) > 95%, CD14 < 10%] and production of IL‐12p70 (mean > 5000 pg per 106 mDC) to confirm an immunogenic phenotype (data not shown). ABCB5 reactivity was assessed by ICS for IFN‐γ and TNF‐α following restimulation with ABCB5 peptides overnight. The results are summarised in Fig. 2. In stimulation experiments with 16 donors, ABCB5 reactivity – albeit low in some cases – could be induced in 14 of 16 donors (88%). In 10 of 16 patients (63%), the percentage of cytokine‐producing CD3+CD8+ T cells was above 0·5%.
Figure 2.
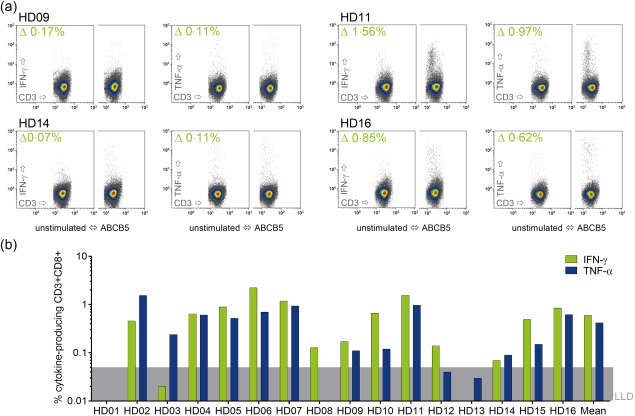
Induction of an immune response against ATP binding cassette subfamily B member 5 (ABCB5) in healthy donors in vitro (a) Example of fluorescence activated cell sorting (FACS) plots for intracellular cytokine staining (ICS) with samples from healthy donors (HD) after co‐culture with autologous ABCB5‐peptide‐loaded dendritic cells (DC). The density plots for CD3‐fluorescein isothiocyanate (FITC) versus interferon (IFN)‐γ‐phycoerythrin (PE) or tumour necrosis factor (TNF)‐α‐allophycocyanin (APC), respectively, are shown for the CD3+CD8+ population. Complete gating strategy is depicted in Supporting information, Fig. S3. The value in the upper left is the difference between the percentage in the peptide‐stimulated minus the percentage in the unstimulated sample. (b) Cytokine‐secretion in the CD3+CD8+ compartment after subtraction of background. The grey area above the x‐axis shows the 0·05% cut‐off/lower limit of detection (LLD) for this method. Thirteen of 16 donors showed ABCB5 reactivity; in two donors (HD01, HD13) no ABCB5‐specific CD3CD8 T cell response was induced; in one donor (HD14) reactivity was very low.
Discussion
Classical cancer treatment aims at the dissection of the tumour and destruction or growth limitation of malignant cells. While a variety of chemotherapeutic drugs, targeted therapies and radio‐therapeutic treatment schemes is available, for some cancers and/or disease stages such treatments are of limited success. Therefore, induction of a durable immune response is believed to be important for more efficient cancer therapies achieving long‐term remission and disease‐free survival. Identification of new TAA is relevant for the development of new drugs and defining new targets for immunotherapy. Here, we explored the eligibility of ABCB5 as a target in cell‐based cancer immunotherapy. Potential epitopes from ABCB5 were synthesised and peptides were tested regarding their clinical relevance and applicability for DC‐based immunotherapy using different strategies: (i) clinical relevance of all selected ABCB5 peptides was tested by stimulation of T cells from melanoma patients (Fig. 1); (ii) dose‐dependent peptide loading of DC was proved by in‐house antibody staining (Supporting information, Fig. S2); and (iii) immunogenicity of the aforementioned peptides was tested by in‐vitro stimulations of CD8+ human T cells with peptide‐pulsed autologous mDC (Fig. 2).
ABCB5 was shown to be expressed in, for example, malignant melanoma 11, 19, Merkel cell carcinoma 14 and colon carcinoma 12. Chemotherapy does not eradicate, but selects ABCB5‐positive tumour cells 11, 24, and higher ABCB5 expression correlates with higher malignancy 19. In human‐to‐mouse xenotransplantation models, tumour growth was inhibited by administration of αABCB5 antibodies, which make the tumour cells susceptible to chemotherapy and initiate immune responses against the antibody‐labelled cells; for example, antibody‐dependent cellular cytotoxicity which was shown in vitro 19. While the development of a therapeutic antibody represents one therapeutic option once a target is identified, individual immunotherapeutic approaches such as active immunisation against the target antigen can often be realised more quickly. However, no cellular immune responses directed against ABCB5 have been described so far. As a murine antibody could be raised against the ABCB5 extracellular loop 3, this region of the protein can be considered immunogenic. In addition, ABCB5‐expressing tumour cells were described to initiate metastases 19, and in a multi‐marker‐based method for quantification of circulating tumour cells, the number of ABCB5‐positive circulating tumour cells correlated with metastasis 20, 21, 25, 26. ABCB5‐positive tumour cells could detach from the primary tumour and therefore stimulate circulating tumour‐specific T cells. To detect a possible immune response against ABCB5, we analysed peripheral blood from melanoma patients for ABCB5‐reactive CD8+ T cells in comparison to a well‐known melanoma TAA, MART‐1. Interestingly, ABCB5 reactivity occurred more often than reaction to MART‐1. MART‐1‐reactive T cells in the peripheral blood of melanoma patients were already described more than 20 years ago 27, and it was postulated that the presence of tumour‐specific T cells correlates with clinical response to immune adjuvant treatment and overall outcome 6. At the same time, it became apparent that a T cell response against a TAA might lead to down‐regulation of the recognised antigen and ultimately tumour immune escape 28. MART‐1 has been used as target for several cancer immunotherapies, including peptide vaccination 29, adoptive T cell transfer 30 and DC vaccination 31, with limited success. Furthermore, especially in approaches based on adoptive transfer of (receptor‐modified) T cells, adverse reactions such as vitiligo, uveitis or ototoxicity occurred. Peptide vaccination can also – apart from inducing tumour‐reactive cytotoxic T cells – lead to expansion of regulatory T cells, followed by decline of tumour‐reactive cytotoxic T lymphocytes (CTL) to baseline 32. The low frequency of MART‐reactive patients in our patient cohort might be due to inhibition of CTL activity by regulatory T cells. This is in line with findings from other studies, where either the expression of MART‐1 declines in correlation to the level of MART‐1‐reactive T cells 28 or a loss of function in TAA‐specific CTL occurs, characterised by expression of PD‐1 and T cell immunoglobulin and mucin domain‐3 (TIM‐3) 33, 34. Furthermore, some reports described tumour‐specific CD4 T cells to have a negative impact on patient survival 35. An aberrant MHC‐II expression in melanoma was shown to induce tumour‐specific CD4+ T cells, which dampen tumour‐reactive CD8 T cells by TNF production 36. Depletion of regulatory T cells was shown to improve induction and expansion of TAA‐specific memory T cells 37. The ABCB5‐specific T cell response in melanoma patients needs to be characterised further in this regard, including the expression of exhaustion markers on peripheral T cells and cytokine patterns of CD8+ and CD4+ T cells.
Our patient cohort was heterogeneous regarding disease stage, metastasis and treatments. No correlation was found between reactivity against either ABCB5 or MART‐1 and clinical characteristics. However, a lack of correlation of ABCB5 reactivity with disease stage might also imply that the antigen was recognised early on. If sampling of both tumour material and peripheral blood is possible, characterisation of ABCB5 expression in the tumour and tumour infiltrating lymphocyte (TIL) infiltration, together with quantification of peripheral ABCB5‐reactive T cells, could help to confirm eligibility of ABCB5 as a target for immunotherapy. As ABCB5 is considered as a tumour‐initiating cell marker characterising therapy‐resistant cells 12, 19, inducing or enhancing pre‐existing ABCB5 immunity might help to eradicate tumour cells and reduce tumour metastasis and relapse. While immunotherapies targeting other autoantigens such as MART‐1 were tolerated overall and induced mainly temporary problems 29, 31, some severe side effects occurred in individual cases 38. In murine models, targeting ABCB5 to ablate tumour engraftment and growth was safe 14, 19. Moreover, apart from epithelial defects and impairment in wound healing, the viability of ABCB5 knock‐out mice has been determined to be similar to wild‐type animals 39.
After detecting ABCB5‐reactive T cells in melanoma patients, we aimed to assess its suitability for an immunotherapeutic treatment approach. Therefore, we tried to induce T cell reactivity in healthy donors using autologous DC in in‐vitro stimulations, which led to induction of ABCB5‐specific CD8+ T cells in 14 of 16 donors tested. This indicates that ABCB5‐loaded autologous DC might be suitable for immunotherapy approaches, possibly in combination with immune check‐point blockade. ABCB5 is expressed in a variety of cancers, and ABCB5 expression particularly marks cells which are chemotherapy‐resistant and can give rise to metastases 11, 12, 14, 19, 24. While ABCB5 is a tumour‐associated antigen (TAA), it is also expressed on normal cells, yet the expression is lower than in malignant cells 12, 19. The availability of a monoclonal antibody against the region containing several putative T cell epitopes has important benefits: as a safety assessment, expression of the target antigen can be analysed in tissue cross‐reactivity studies, and possible long‐term toxicities and adverse effects induced by an immune response against this target can be assessed in relevant species (e.g. mouse) using the antibody.
Taken together, in addition to data on the ABCB5 expression in malignancies already available, detection of ABCB5‐reactive CD8+ T cells in melanoma patients affirms ABCB5 as a potential target for immunotherapy.
Disclosure
MHF is inventor or co‐inventor of US and international patents assigned to Brigham and Women's Hospital and/or Boston Children's Hospital, Boston, MA, and licensed to TICEBA GmbH (Heidelberg, Germany) and RHEACELL GmbH & Co. KG (Heidelberg, Germany). MHF serves as a scientific adviser to TICEBA GmbH and RHEACELL GmbH & Co. KG. and participates in corporate sponsored research collaborations with RHEACELL GmbH & Co. KG. JU received compensation for personal and material costs for this project by TICEBA as detailed by a collaboration contract. The other authors declare no potential conflicts of interest.
Author contributions
SB designed the study and established the methods, performed FACS data analysis, performed statistical analysis and wrote the manuscript. CM performed IF stainings of tumour cryomaterial, supported sample gathering and banking, ABCB5 antibody characterisation and critical discussion of the manuscript. CAM processed blood samples, performed cell banking, documentation, DC generation and characterisation, performed ELISAs, co‐culture experiments and in (re)stimulation experiments, performed FACS experiments and performed FACS data analysis. AT processed blood samples, cell banking and documentation, performed DC generation and characterisation, performed FACS experiments and performed IF stainings. JV processed blood samples, cell banking and documentation, performed DC generation and characterisation and performed FACS experiments. YN gathered and shipped patient material. Critical discussion of the manuscript was performed by VU, JE and CG. MHF participated in experimental planning and critical discussion of the manuscript. MAK supported writing and critical discussion of the manuscript. JU supported study design, patient selection, analysis of clinical data and supported manuscript writing.
Supporting information
Additional Supporting information may be found in the online version of this article at the publisher's web‐site:
Fig. S1. Epitope ranking for ATP binding cassette subfamily B member 5 (ABCB5)‐Loop3 15mers based on normalised values from different prediction algorithms. The normalised ranking for possible major histocompatibility complex (MHC)‐I epitopes derived from the AA sequence GAYLIQAGRMTPEGMFIVFTAIAY was calculated according to Krishna and Anderson 22; the suggested MHC‐I set covers > 60% of the population for HLA‐A locus and > 35% for the B locus. The highest‐ranked epitopes all fall within the sequence of at least one of the three 15mers. Thus, using a cocktail based on these three peptides, many different HLA‐loci would be covered.
Fig. S2. Staining of ATP binding cassette subfamily B member 5 (ABCB5) on peptide‐loaded mature dendritic cells (mDC) and in tumour slides. (a) Dendritic cells (DC) generated from peripheral blood mononuclear cells (PBMNCs) of healthy donors were pulsed with different ABCB5‐Loop3 peptide pool concentrations ranging from 1 to 600 µM for 2 h. Cells were washed and stained with αABCB5‐3C2‐fluorescein isothiocyanate (FITC). The total number of loading and staining experiments performed is given for each median value. Below 100 µM, signal for peptide‐pulsed DC was below background. Dose‐dependent staining started from 100 µM, and was clearly detectable using concentrations above 200 µM; however, there is no proof that this correlates directly with peptide presentation in the major histocompatibility complex (MHC) context. (b) A cryosection of a large primary, periocular melanoma (stage II) stained with αABCB5‐3C2‐FITC and 4′,6‐diamidino‐2‐phenylindole (DAPI). The image was taken on an EVOS Floid Cell Imaging Station at ×20 magnification (settings for intensity were 60% green channel, 30% blue channel, and for processing 51% brightness, 56% contrast). Approximately 80% of cells express ABCB5.
Fig. S3. Intracellular cytokine staining (ICS) gating strategy. The gating strategy for analysis of ICS samples is illustrated; staining of expanded healthy donor CD8 T cells is shown. In the forward‐(FSc)/side‐scatter (SSc) (upper left plot), a gate is set on the living lymphocytes [gate (alive)]. In the lower left corner of the FSc/SSc density plot, dead cells and debris can be seen (‘dd’ = dead/debris). The population next to it are the irradiated feeder cells (‘f’ = feeder). In the CD3‐fluorescein isothiocyanate (FITC) versus CD8‐phycoerythrin‐cyanin 7 (PE‐Cy7) density plot gated on (alive), the CD3+CD8+ cells are gated [gate (CD3CD8)]. At least 20 000 events were recorded in the (CD3CD8) gate. Next, the percentages of cytokine‐producing cells [interferon (IFN)‐γ] are determined in the unstimulated and peptide‐restimulated samples. To calculate the peptide‐specific CD8+ T cell response, the signal in the unstimulated control is subtracted from the value determined in the peptide‐stimulated sample. Values above 0·05% are considered as a positive response, values below or equal to 0·05% no response.
References
- 1. Farkona S, Diamandis EP, Blasutig IM. Cancer immunotherapy: the beginning of the end of cancer? BMC Med 2016; 14:73. [DOI] [PMC free article] [PubMed] [Google Scholar]
- 2. Weber JS. Current perspectives on immunotherapy. Semin Oncol 2014; 41: S14–29. [DOI] [PubMed] [Google Scholar]
- 3. Pennock GK, Chow LQ. The evolving role of immune checkpoint inhibitors in cancer treatment. Oncologist 2015; 20:812–22. [DOI] [PMC free article] [PubMed] [Google Scholar]
- 4. Kreamer KM. Immune checkpoint blockade: a new paradigm in treating advanced cancer. J Adv Pract Oncol 2014; 5:418–31. [DOI] [PMC free article] [PubMed] [Google Scholar]
- 5. Topalian SL, Hodi FS, Brahmer JR et al Safety, activity, and immune correlates of anti‐PD‐1 antibody in cancer. N Engl J Med 2012; 366:2443–54. [DOI] [PMC free article] [PubMed] [Google Scholar]
- 6. Karaki S, Anson M, Tran T et al Is there still room for cancer vaccines at the era of checkpoint inhibitors. Vaccines (Basel) 2016; 4:E37. [DOI] [PMC free article] [PubMed] [Google Scholar]
- 7. Palucka K, Banchereau J. Dendritic‐cell‐based therapeutic cancer vaccines. Immunity 2013; 39:38–48. [DOI] [PMC free article] [PubMed] [Google Scholar]
- 8. Eyrich M, Schreiber SC, Rachor J et al Development and validation of a fully GMP‐compliant production process of autologous, tumor‐lysate‐pulsed dendritic cells. Cytotherapy 2014; 16:946–64. [DOI] [PubMed] [Google Scholar]
- 9. Nava S, Lisini D, Pogliani S et al Safe and reproducible preparation of functional dendritic cells for immunotherapy in glioblastoma patients. Stem Cells Transl Med 2015; 4:1164–72. [DOI] [PMC free article] [PubMed] [Google Scholar]
- 10. Frank NY, Margaryan A, Huang Y et al ABCB5‐mediated doxorubicin transport and chemoresistance in human malignant melanoma. Cancer Res 2005; 65:4320–33. [DOI] [PubMed] [Google Scholar]
- 11. Chartrain M, Riond J, Stennevin A et al Melanoma chemotherapy leads to the selection of ABCB5‐expressing cells. PLoS One 2012; 7:e36762. [DOI] [PMC free article] [PubMed] [Google Scholar]
- 12. Wilson BJ, Schatton T, Zhan Q et al ABCB5 identifies a therapy‐refractory tumor cell population in colorectal cancer patients. Cancer Res 2011; 71:5307–16. [DOI] [PMC free article] [PubMed] [Google Scholar]
- 13. Cheung ST, Cheung PF, Cheng CK, Wong NC, Fan ST. Granulin‐epithelin precursor and ATP‐dependent binding cassette (ABC)B5 regulate liver cancer cell chemoresistance. Gastroenterology 2011; 140:344–55. [DOI] [PubMed] [Google Scholar]
- 14. Kleffel S, Lee N, Lezcano C et al ABCB5‐targeted chemoresistance reversal inhibits Merkel cell carcinoma growth. J Invest Dermatol 2016; 136:838–46. [DOI] [PMC free article] [PubMed] [Google Scholar]
- 15. Yang M, Li W, Fan D et al Expression of ABCB5 gene in hematological malignances and its significance. Leuk Lymphoma 2012; 53:1211–5. [DOI] [PubMed] [Google Scholar]
- 16. Farawela HM, Khorshied MM, Kassem NM, Kassem HA, Zawam HM. The clinical relevance and prognostic significance of adenosine triphosphate ATP‐binding cassette (ABCB5) and multidrug resistance (MDR1) genes expression in acute leukemia: an Egyptian study. J Cancer Res Clin Oncol 2014; 140:1323–30. [DOI] [PubMed] [Google Scholar]
- 17. Frank NY, Pendse SS, Lapchak PH et al Regulation of progenitor cell fusion by ABCB5 P‐glycoprotein, a novel human ATP‐binding cassette transporter. J Biol Chem 2003; 278:47156–65. [DOI] [PubMed] [Google Scholar]
- 18. Schatton T, Yang J, Kleffel S et al ABCB5 identifies immunoregulatory dermal cells. Cell Rep 2015; 12:1564–74. [DOI] [PMC free article] [PubMed] [Google Scholar]
- 19. Schatton T, Murphy GF, Frank NY et al Identification of cells initiating human melanomas. Nature 2008; 451:345–9. [DOI] [PMC free article] [PubMed] [Google Scholar]
- 20. Klinac D, Gray ES, Freeman JB et al Monitoring changes in circulating tumour cells as a prognostic indicator of overall survival and treatment response in patients with metastatic melanoma. BMC Cancer 2014; 14:423. [DOI] [PMC free article] [PubMed] [Google Scholar]
- 21. Freeman JB, Gray ES, Millward M, Pearce R, Ziman M. Evaluation of a multi‐marker immunomagnetic enrichment assay for the quantification of circulating melanoma cells. J Transl Med 2012; 10:192. [DOI] [PMC free article] [PubMed] [Google Scholar]
- 22. Krishna S, Anderson KS. T‐cell epitope discovery for therapeutic cancer vaccines. Methods Mol Biol 2016; 1403:779–96. [DOI] [PubMed] [Google Scholar]
- 23. Jonuleit H, Kuhn U, Muller G et al Pro‐inflammatory cytokines and prostaglandins induce maturation of potent immunostimulatory dendritic cells under fetal calf serum‐free conditions. Eur J Immunol 1997; 27:3135–42. [DOI] [PubMed] [Google Scholar]
- 24. Wilson BJ, Saab KR, Ma J et al ABCB5 maintains melanoma‐initiating cells through a proinflammatory cytokine signaling circuit. Cancer Res 2014; 74:4196–207. [DOI] [PMC free article] [PubMed] [Google Scholar]
- 25. Gray ES, Reid AL, Bowyer S et al Circulating melanoma cell subpopulations: their heterogeneity and differential responses to treatment. J Invest Dermatol 2015; 135:2040–8. [DOI] [PMC free article] [PubMed] [Google Scholar]
- 26. Aya‐Bonilla CA, Marsavela G, Freeman JB et al Isolation and detection of circulating tumour cells from metastatic melanoma patients using a slanted spiral microfluidic device. Oncotarget 2017; 8:67355–68. [DOI] [PMC free article] [PubMed] [Google Scholar]
- 27. Scheibenbogen C, Lee KH, Stevanovic S et al Analysis of the T cell response to tumor and viral peptide antigens by an IFNgamma‐ELISPOT assay. Int J Cancer 1997; 71:932–6. [DOI] [PubMed] [Google Scholar]
- 28. Jager E, Ringhoffer M, Karbach J, Arand M, Oesch F, Knuth A. Inverse relationship of melanocyte differentiation antigen expression in melanoma tissues and CD8+ cytotoxic‐T‐cell responses: evidence for immunoselection of antigen‐loss variants in vivo . Int J Cancer 1996; 66:470–6. [DOI] [PubMed] [Google Scholar]
- 29. Tarhini AA, Leng S, Moschos SJ et al Safety and immunogenicity of vaccination with MART‐1 (26–35, 27L), gp100 (209–217, 210M), and tyrosinase (368–376, 370D) in adjuvant with PF‐3512676 and GM‐CSF in metastatic melanoma. J Immunother 2012; 35:359–66. [DOI] [PMC free article] [PubMed] [Google Scholar]
- 30. Khammari A, Labarriere N, Vignard V et al Treatment of metastatic melanoma with autologous Melan‐A/MART‐1‐specific cytotoxic T lymphocyte clones. J Invest Dermatol 2009; 129:2835–42. [DOI] [PubMed] [Google Scholar]
- 31. Chodon T, Comin‐Anduix B, Chmielowski B et al Adoptive transfer of MART‐1 T‐cell receptor transgenic lymphocytes and dendritic cell vaccination in patients with metastatic melanoma. Clin Cancer Res 2014; 20:2457–65. [DOI] [PMC free article] [PubMed] [Google Scholar]
- 32. Chakraborty NG, Chattopadhyay S, Mehrotra S, Chhabra A, Mukherji B. Regulatory T‐cell response and tumor vaccine‐induced cytotoxic T lymphocytes in human melanoma. Hum Immunol 2004; 65:794–802. [DOI] [PubMed] [Google Scholar]
- 33. Ahmadzadeh M, Johnson LA, Heemskerk B et al Tumor antigen‐specific CD8 T cells infiltrating the tumor express high levels of PD‐1 and are functionally impaired. Blood 2009; 114:1537–44. [DOI] [PMC free article] [PubMed] [Google Scholar]
- 34. Fourcade J, Sun Z, Benallaoua M et al Upregulation of Tim‐3 and PD‐1 expression is associated with tumor antigen‐specific CD8+ T cell dysfunction in melanoma patients. J Exp Med 2010; 207:2175–86. [DOI] [PMC free article] [PubMed] [Google Scholar]
- 35. Zelba H, Weide B, Martens A et al Circulating CD4+ T cells that produce IL4 or IL17 when stimulated by melan‐A but not by NY‐ESO‐1 have negative impacts on survival of patients with stage IV melanoma. Clin Cancer Res 2014; 20:4390–9. [DOI] [PubMed] [Google Scholar]
- 36. Donia M, Andersen R, Kjeldsen JW et al Aberrant expression of MHC class II in melanoma attracts inflammatory tumor‐specific CD4+ T‐ cells, which dampen CD8+ T‐cell antitumor reactivity. Cancer Res 2015; 75:3747–59. [DOI] [PubMed] [Google Scholar]
- 37. Schuetz F, Ehlert K, Ge Y et al Treatment of advanced metastasized breast cancer with bone marrow‐derived tumour‐reactive memory T cells: a pilot clinical study. Cancer Immunol Immunother 2009; 58:887–900. [DOI] [PMC free article] [PubMed] [Google Scholar]
- 38. van den Berg JH, Gomez‐Eerland R, van de Wiel B et al Case report of a fatal serious adverse event upon administration of T cells transduced with a MART‐1‐specific T‐cell receptor. Mol Ther 2015; 23:1541–50. [DOI] [PMC free article] [PubMed] [Google Scholar]
- 39. Ksander BR, Kolovou PE, Wilson BJ et al ABCB5 is a limbal stem cell gene required for corneal development and repair. Nature 2014; 511:353–7. [DOI] [PMC free article] [PubMed] [Google Scholar]
Associated Data
This section collects any data citations, data availability statements, or supplementary materials included in this article.
Supplementary Materials
Additional Supporting information may be found in the online version of this article at the publisher's web‐site:
Fig. S1. Epitope ranking for ATP binding cassette subfamily B member 5 (ABCB5)‐Loop3 15mers based on normalised values from different prediction algorithms. The normalised ranking for possible major histocompatibility complex (MHC)‐I epitopes derived from the AA sequence GAYLIQAGRMTPEGMFIVFTAIAY was calculated according to Krishna and Anderson 22; the suggested MHC‐I set covers > 60% of the population for HLA‐A locus and > 35% for the B locus. The highest‐ranked epitopes all fall within the sequence of at least one of the three 15mers. Thus, using a cocktail based on these three peptides, many different HLA‐loci would be covered.
Fig. S2. Staining of ATP binding cassette subfamily B member 5 (ABCB5) on peptide‐loaded mature dendritic cells (mDC) and in tumour slides. (a) Dendritic cells (DC) generated from peripheral blood mononuclear cells (PBMNCs) of healthy donors were pulsed with different ABCB5‐Loop3 peptide pool concentrations ranging from 1 to 600 µM for 2 h. Cells were washed and stained with αABCB5‐3C2‐fluorescein isothiocyanate (FITC). The total number of loading and staining experiments performed is given for each median value. Below 100 µM, signal for peptide‐pulsed DC was below background. Dose‐dependent staining started from 100 µM, and was clearly detectable using concentrations above 200 µM; however, there is no proof that this correlates directly with peptide presentation in the major histocompatibility complex (MHC) context. (b) A cryosection of a large primary, periocular melanoma (stage II) stained with αABCB5‐3C2‐FITC and 4′,6‐diamidino‐2‐phenylindole (DAPI). The image was taken on an EVOS Floid Cell Imaging Station at ×20 magnification (settings for intensity were 60% green channel, 30% blue channel, and for processing 51% brightness, 56% contrast). Approximately 80% of cells express ABCB5.
Fig. S3. Intracellular cytokine staining (ICS) gating strategy. The gating strategy for analysis of ICS samples is illustrated; staining of expanded healthy donor CD8 T cells is shown. In the forward‐(FSc)/side‐scatter (SSc) (upper left plot), a gate is set on the living lymphocytes [gate (alive)]. In the lower left corner of the FSc/SSc density plot, dead cells and debris can be seen (‘dd’ = dead/debris). The population next to it are the irradiated feeder cells (‘f’ = feeder). In the CD3‐fluorescein isothiocyanate (FITC) versus CD8‐phycoerythrin‐cyanin 7 (PE‐Cy7) density plot gated on (alive), the CD3+CD8+ cells are gated [gate (CD3CD8)]. At least 20 000 events were recorded in the (CD3CD8) gate. Next, the percentages of cytokine‐producing cells [interferon (IFN)‐γ] are determined in the unstimulated and peptide‐restimulated samples. To calculate the peptide‐specific CD8+ T cell response, the signal in the unstimulated control is subtracted from the value determined in the peptide‐stimulated sample. Values above 0·05% are considered as a positive response, values below or equal to 0·05% no response.