

Summary
Only mismatch repair (MMR)‐deficient colorectal cancer (CRC) appears to respond well to programmed death (PD)‐1 inhibition at the present time. Emerging evidence suggests a role for micro‐environmental factors such as CD25+ cells modulating response to PD‐1 inhibition. In the ApcMin/+ model of familial adenomatous polyposis (MMR‐proficient CRC), increased Cyclooxygenase‐2 (Cox‐2) expression by cells which include alternatively activated mononuclear phagocytes promotes intestinal tumorigenesis by mechanisms which may include immune suppression. To gain insight into this, we compared regulatory T cell (Treg) populations between ApcMin/+ and wild‐type mice prior to and after the phase of increased intestinal Cox‐2‐dependent prostaglandin E2 (PGE2) production. There was no difference in systemic Treg function or numbers between ApcMin/+ and wild‐type mice. However, increased numbers of small intestinal CD25+ Tregs were observed with increased Cox‐2 activity in the absence of any difference in the expression of Tgf‐β or Tslp between ApcMin/+ and wild‐type mice. Cox‐2 inhibitor therapy (Celecoxib) reversed the increase in ApcMin/+ intestinal CD25+ Treg numbers, without decreasing numbers of CD25+ systemic Tregs. Forkhead box protein 3 (FoxP3+) and Cox‐2+ cells were co‐localized to the interstitium of adenomas of Apcmin/+ mice. These results suggest selective dependence of an ‘activated Treg’ phenotype on paracrine Cox‐2 activity in ApcMin/+ small intestine. For therapeutic potential, further studies are required to evaluate the relevance of these findings to human cancer as well as the functional significance of CD25+ intestinal Tregs in cancer.
Keywords: Cox‐2, intestine, regulatory T cell, TGF‐β, tumorigenesis
Introduction
Systemic therapy has led to some improvement in survival for patients with advanced colorectal cancer (CRC) during the past few decades; however, it remains a major cause of cancer‐related mortality in the western world 1. Therapeutic reversal of programmed death 1 (PD‐1)/programmed death ligand 1 (PD‐L1) pathway‐mediated cancer immune suppression has emerged recently as a potent therapeutic target in some forms of cancer, but has not been effective for the majority of metastatic CRC except for those with mismatch repair (MMR) deficiency 2. This observation is surprising, as there are relatively similar levels of PD‐L1 expression between MMR‐proficient and ‐deficient cancers 3. A lower mutational burden resulting in reduced neo‐epitopes in MMR‐proficient cancer has been hypothesized as one factor explaining reduced responsiveness to antagonism of immunosuppression 2. However, emerging evidence suggests that tumour immune alterations beyond PD‐L1 expression may also modulate responsiveness to PDL‐1/PD‐1 pathway antagonism. A recent study reported significantly enhanced response to PD‐1 inhibition following depletion of CD25+ cells 4.
Cyclooxygenase‐2 (Cox‐2) over‐expression is associated ubiquitously with intestinal adenomas of familial adenomatous polyposis (FAP) 5 and more than 70% of sporadic colorectal adenomas 6. However, up to half of MMR‐deficient CRC may not over‐express Cox‐2 7, while lower levels of Cox‐2 over‐expression have been reported for the others 8. In contrast to most other mammalian tissues where Cox‐2 is an inducible gene, Cox‐2 is expressed constitutively by intestinal lamina propria mononuclear cells (LPMNCs), where it has been shown to play a role in the establishment of dietary immune tolerance 9. The observation that prostaglandin E2 (PGE2) can induce regulatory phenotype in CD4+ T lymphocytes (Tregs) 10 has suggested a mechanism for Cox‐2 in immune suppression. We have shown previously that intestinal LPMNC Cox‐2‐dependent PGE2 production increases in C57BL/6 mice after the age of weaning (∼ 4 weeks of age), with further up‐regulation of intestinal LPMNC Cox‐2‐dependent PGE2 production in the ApcMin/+ model of FAP during the phase of appearance of macroscopic adenomas 11. Our study and others 11, 12, 13 have suggested that macrophages, fibroblasts and vascular endothelial cells are the predominant source of intestinal Cox‐2 expression in Apc mutant mice. Furthermore, CD4‐Treg adoptive transfer led paradoxically to intestinal adenoma regression and reduced Cox‐2 expression in the ApcMin/+ model 14. Conversely, adoptive transfer of naive CD4+ T lymphocytes had the opposite effect of promoting intestinal tumorigenesis in the ApcMin/+ mouse in association with inflammatory mononuclear infiltrates 15. This has suggested a potential interaction between Tregs and mononuclear phagocytes in the intestinal micro‐environment to modulate intestinal tumorigenesis.
To yield insight into the role of Cox‐2 expression in intestinal immune changes, we compared intestinal regulatory CD4‐lymphocyte populations between ApcMin/+, Cox‐2 inhibitor‐treated ApcMin/+ and wild‐type mice. We also studied Treg association with Cox‐2 expressing cells.
Materials and methods
Animals
All animal work was carried out with appropriate UK Home Office and local ethical committee approval. ApcMin/+ and Apc+/+ (wild‐type) mice on the C57BL/6 background obtained from the Jackson Laboratory (Bar Harbor, ME, USA) were bred according to UK Home Office guidelines under specific pathogen‐free conditions at the University of Edinburgh and had free access to water and a standard RM1 diet (DBM, Livingston, UK). Some ApcMin/+ mice were fed an RM1™ diet containing 300 parts per million (p.p.m.) of Celecoxib (Pfizer, Madison, NJ, USA) from weaning (approximately 4 weeks of age) until analysis.
Adenoma counts and intestinal epithelial or LPMNC isolation
Mice were killed by a schedule 1 method (cervical dislocation). Intestinal adenomas were counted macroscopically by O.O.F., blinded to mouse diet. After removing visible Peyer's patches, intestinal LPMNCs were isolated as described previously 9. LPMNC viability was assessed by trypan blue exclusion. Viability generally ranged between 75 and 85%. Intestinal epithelial cells obtained during the ethylenediamine tetraacetic acid (EDTA) (Invitrogen, Paisley, UK) incubation phase of LPMNC isolation were lysed in TRIZOL™ (Invitrogen) and stored at −20°C for real‐time polymerase chain reaction (PCR) analysis. LPMNCs obtained after enzymatic digestion of residual intestinal tissue were washed in phosphate‐buffered saline (PBS) containing 5% fetal calf serum (FCS) (Sigma, Poole, UK) and used for flow cytometric analysis.
Tissue processing
Mice at ∼ 4 (range = 4–5) or 15 (range = 14–16) weeks of age were culled and small intestine dissected out from the pylorus to the ileo–caecal junction. Intestinal lumina were flushed out with PBS until no luminal content was evident. The intestinal tissue was then opened longitudinally, segments fixed in methacarn (60% methanol, 30% chloroform and 10% glacial acetic acid) were dehydrated in ethanol and embedded in wax; 5‐μm sections were obtained from wax‐embedded tissue.
Immunohistochemistry (IHC)
Forkhead box protein 3 (FoxP3). Anti‐FoxP3 antibody (e‐Bioscience, Hatfield, UK) and anti‐CD3 antibody (Dako, Ely, UK) IHC staining was carried out on methacarn fixed tissue as described 14. Antigen retrieval was by means of Borg decloaker (Biocare Medical, Pacheco, CA, USA). FoxP3 staining was visualized with diaminobenzidine (DAB) from Dako and CD3 with Vector blue (Vector Labs, Peterborough, UK). The number of positive cells for either of these markers was determined by counting from 10 alternate villi in distal small intestine. Anti‐transforming growth factor (TGF)‐β antibody (R&D Systems, Abingdon, UK) IHC was carried out as described previously and developed with DAB 16. Single‐stained sections were counterstained with Mayer's haematoxylin.
Dual immunohistochemistry
Cox‐2. Methacarn‐fixed intestinal sections were stained with 10 µg/ml of affinity‐purified rabbit anti‐mouse Cox‐2 antibody (160126; Cayman Chemicals, Ann Arbor, MI, USA) overnight at 4°C. Controls included Cox‐2 antibody mixed with ×10 its concentration of its competing peptide (360106; Cayman Chemicals). An anti‐rabbit secondary antibody was used, with development of staining with DAB 17. Sections were then washed in PBS and underwent FoxP3 immunohistochemistry as described above, except that staining was developed with alkaline phosphatase rather than DAB.
Flow cytometry
Cell surface markers
Inguinal lymph node (ILN) (∼ 5 × 10⁵) or intestinal mononuclear cells were resuspended in fluorescence activated cell sorter (FACS) buffer (2% FCS). After an Fc block (BD Biosciences, Oxford, UK) for 30 min, cells were labelled with CD4‐FITC (2 × 5 μg/ml) and/or CD25‐phycoerythrin (PE) (1 × 25 μg/ml) or concentration‐matched isotype control (all e‐Biosciences) for 30 min and then washed in FACS buffer. Intracellular staining was then carried out.
Intracellular staining
ILN (∼ 5 × 10⁵) or intestinal mononuclear cells were resuspended in FACS buffer (2% FCS). After Fc blocking as above, cells were labelled with surface markers or concentration‐matched isotype control (e‐Biosciences) for 30 min and washed in FACS buffer. Cells were then fixed and permeabilized using the Treg flow cytometry kit (e‐Biosciences), according to the manufacturer's instructions. Subsequently, cells were stained with FoxP3‐allophycocyanin (APC) (1 × 25 μg/ml) or concentration‐matched isotype control (e‐Biosciences) with or without an antibody to Helios (Helios‐Alexa Fluor 647, from BioLegend, San Diego, CA, USA) or concentration‐matched isotype control, as per the manufacturer's instructions. Cells were then washed and resuspended in FACS buffer.
Flow cytometry data acquisition was carried out on a FACSCalibur (BD Biosciences) using Cell Quest™ software. Cells within a viable lymphocyte gate were analysed with FloJo™ software (Tree Star, Inc., Ashland, OR, USA).
Regulatory T lymphocyte isolation and functional assays
ILN and spleens were obtained by dissection and passed through 40‐μm filters (BD Biosciences, Oxford, UK) into 5% FCS in PBS. Splenic and ILN mononuclear cells were washed in 5% FCS and CD4+CD25+ (regulatory) and CD4+CD25– (helper‐inducer) populations were isolated using a Treg isolation kit (Miltenyi Biotec, Woking, UK), according to the manufacturer's instructions; 5 × 10⁴ CD4+ CD25– cells/well in 96‐well tissue culture plates were stimulated with CD3/CD28 microbeads (Invitrogen), according to the manufacturer's instructions, and then cultured alone or with an equal number of CD4+CD25+ cells. Unstimulated CD4+CD25– cells served as controls. Cultures were pulsed with 1 μCi [3H]‐thymidine (Perkin Elmer, Cambridge, UK) per well after 72 h and then incubated for a further 24 h, after which the plates were frozen at −20°C until harvested and incorporated [3H]‐thymidine counted in a β‐scintillation counter.
Real‐time PCR analysis
RNA was isolated from cells lysed in TRIZOL as advised by the manufacturer. Subsequently, cDNA was generated using a reverse transcription kit (Invitrogen). Genomic contamination was excluded using intron spanning primers to Cox‐1 (forward: CAC AGT GCG GTC CAA CCT TAT, reverse: GAT GTA GTC ATG CGC TGA GTT GT) and looking for genomic‐DNA sized PCR products on 2% agarose gels. Otherwise, real‐time PCR was carried out with the following primers: Hprt (forward: TGA AAG ACT TGC TCG AGA TGT CA, reverse‐ CAC ACA GAG GGC CAC AAT GT); Tgf‐β1 (forward: GCA GTG GCT GAA CCA AGG A, reverse: AGC AGT GAG CGC TGA ATC G); and Tslp (forward: CCC TGG CTG CCC TTC ACT, reverse CAT TGA GGG CTT CTC TTG TTC TC). All PCR primers were obtained from Invitrogen. PCR was then carried out on an Applied Biosystems 7700 machine using SYBR‐green™ dye for fluorescence detection. PCR conditions were an annealing temperature of 60°C for 30s, then amplification for 60 s at 72°C for 40 cycles followed by 72°C for 10 min. The level of expression of Tgf‐β1 (Tgf‐β) or Tslp was normalized to the housekeeping gene Hprt.
Statistics
Group data are summarized and presented as the mean value ± standard error of the mean. Data were analysed by Mann–Whitney using Prism™ software. Differences were considered statistically significant at a P‐value of < 0·05.
Results
Increased numbers of FoxP3+ small intestinal T lymphocytes in ApcMin/+ compared with wild‐type mice
We compared Treg (FoxP3‐expressing cell) numbers between ApcMin/+ (n=3) and wild‐type (n = 3) mouse small intestine at 15 weeks of age. CD3 (as a pan‐T lymphocyte marker) was used to control for the total number of T lymphocytes. Double IHC showed that all FoxP3+ cells were also CD3+ (Fig. 1b). FoxP3+ cells were localized to the lamina propria (LP) of intestinal villi in ApcMin/+ and wild‐type mice (Fig. 1b). However, FoxP3+ cells were also localized to the interstitium of intestinal adenomas in ApcMin/+ mice, particularly in a subepithelial location (shown later in Fig. 3). The number of FoxP3+ cells per villus in ApcMin/+ mouse small intestine was more than double the number observed in wild‐type littermates, despite no significant difference in the number of CD3+ cells (Fig. 1d,e). Consequently, we demonstrate increased numbers of FoxP3+ T lymphocytes in ApcMin/+ mouse intestine with established adenomas.
Figure 1.
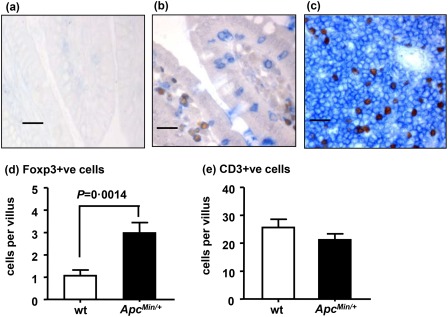
Increased numbers of forkhead box protein 3 (FoxP3)+ cells in the intestinal villi of ApcMin/+ mice at 15 weeks of age. (a–e) Immunohistochemistry, black bars = 30 μm. (a) Histologically normal distal small intestine from a wild‐type (wt) mouse, no primary antibody control. (b) Histologically normal distal small intestine from ApcMin/+ mouse showing nuclear FoxP3+ (brown) and membrane CD3+ (blue) staining in the lamina propria as well as an intra‐epithelial location. (c) Spleen from an ApcMin/+ mouse showing peri‐arteriolar FoxP3+ and CD3+ cells in the marginal zone. (d) Numbers of FoxP3+ cells per villus are significantly increased in ApcMin/+ mice compared to wt mice (Mann–Whitney U‐test). (e) Number of CD3+ cells per villus are not significantly different in ApcMin/+ mice compared to wt mice.
Figure 3.
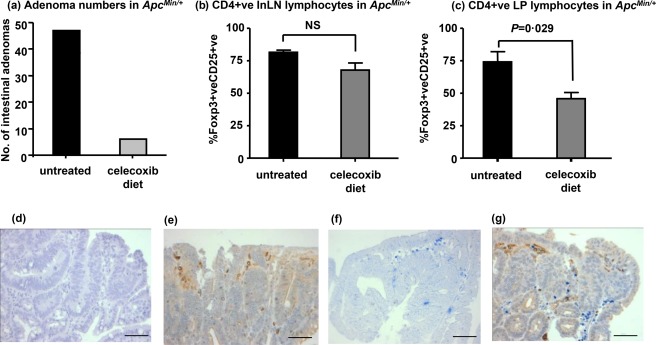
Celecoxib treatment reduces the proportion of CD4+forkhead box protein 3 (FoxP3)+CD25+ lamina propria but not inguinal lymph node lymphocytes of ApcMin/+ mice at 15 weeks of age. (a) Celecoxib reduces the numbers of ApcMin/+ mouse intestinal adenomas. (b) Celecoxib has no significant effect on the proportion of ApcMin/+ mouse inguinal lymph nodes (InLN) cells with a conventional regulatory T cell (Treg) phenotype. (c) Decreased proportion of CD4+FoxP3+CD25+ cells in intestinal lamina propria (LP) lymphocytes of ApcMin/+ mice treated with celecoxib. (d–g) Co‐immunohistochemistry for Cox‐2 and FoxP3 protein localization was carried out on ApcMin/+ mouse small intestinal adenomas. (d) Adenomatous small intestine from an ApcMin/+ mouse, showing no staining with Cox‐2 pre‐incubated with the competing peptide. (e) Adenomatous small intestine from an ApcMin/+ mouse, showing staining with Cox‐2 (brown cells). (f) Adenomatous small intestine from an ApcMin/+ mouse showing staining with FoxP3 (blue cells). (g) Adenomatous small intestine from an ApcMin/+ mouse adenoma co‐localizing Cox‐2 (brown cells) and FoxP3 (blue cells) (scale bar = 50 μm).
Increased proportion of ApcMin/+ mouse FoxP3+ small intestinal lymphocytes with age
We then compared LP and ILN populations between ApcMin/+ and wild‐type mice at 4 and 15 weeks of age (Fig. 2) in order to determine if the increased FoxP3+ lymphocyte population of ApcMin/+ small intestine occurred with age (during the phase of increased Cox‐2 dependent PGE2 production) and, furthermore, if populations in the intestine reflected those in unconnected lymphoid tissue.
Figure 2.
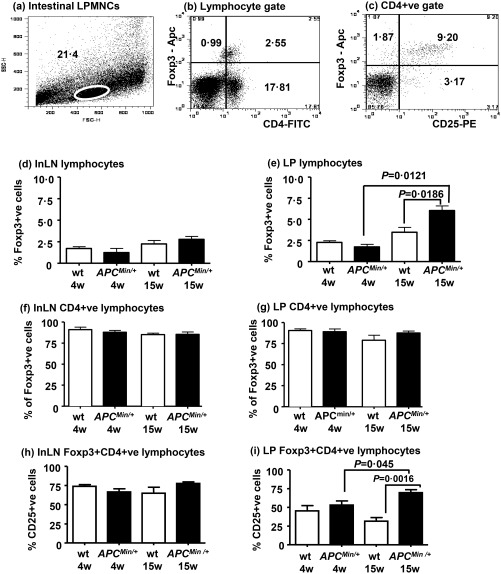
Analysis of FoxP3+ lymphocyte populations in inguinal lymph nodes and intestinal lamina propria (LP) of wild‐type (wt) and ApcMin/+ mice. (a–c) Representative flow cytometry plots of intestinal lamina propria mononuclear cells (LPMNCs) showing (a) the viable lymphocyte gate on a forward‐ versus side‐scatter plot; (b) the % of FoxP3+ and CD4+ cells within the viable lymphocyte gate and (c) the % of FoxP3+ and CD25+ cells within lymphocytes gated for CD4 expression. (d) There are no significant differences between the % of forkhead box protein 3 (FoxP3)+ lymphocytes in inguinal lymph nodes (InLN) of wt (open boxes) or ApcMin/+ (black boxes) mice at 4 or 15 weeks of age. (e) There is no significant difference between the % of FoxP3+ lymphocytes in the LP of mice at 4 weeks of age. In contrast, there is an increase in the % of FoxP3+ lymphocytes in the LP of ApcMin/+ mice at 15 weeks compared to wt mice of the same age and to 4‐week‐old ApcMin/+ mice. (f,g) There are no significant differences in the % of FoxP3+ cells that are also CD4+ in InLN (f) or LP (g) between wt and ApcMin/+ mice at 4 or 15 weeks of age. (h) The proportion of FoxP3+CD4+ cells that are CD25+ does not change with age in inguinal lymph nodes and is similar between wt and ApcMin/+ mice. (i) Compared to lymph node lymphocytes, there is a decreased proportion of CD25+FoxP3+CD4+ cells in lamina propria lymphocytes. There is no difference in this subset between wt and ApcMin/+ mice at 4 weeks of age, whereas it is increased significantly in ApcMin/+ mice at 15 weeks of age compared to wt mice of the same age and to ApcMin/+ mice at 4 weeks of age. Data are shown as mean ± standard error of the mean (s.e.m.) of three to six mice per group. Statistical comparisons by Mann–Whitney U‐test.
The FoxP3+ proportion of LP or ILN lymphocytes was similar between ApcMin/+ and wild‐type mice at 4 weeks of age (Fig. 2d). However, there was a significantly increased proportion of FoxP3+ LP lymphocytes in ApcMin/+ mice (P = 0·012) but not wild‐type mice (P = 0·19) between 4 and 15 weeks of age (Fig. 2e). In particular, a significantly increased proportion of FoxP3+ LP lymphocytes was observed in ApcMin/+ compared with wild‐type mice at 15 weeks of age (P = 0·019), with no significant difference in the proportion of FoxP3+ ILN lymphocytes (Fig. 2e).
Alterations in the intestinal CD8 T lymphocyte population of the ApcMin/+ mouse during tumorigenesis have been reported 18. We therefore determined the CD4+ population of regulatory T lymphocytes in ApcMin/+ mice. CD4 and FoxP3 expression by LP or ILN lymphocytes of ApcMin/+ and wild‐type mice were analysed (Fig. 2f,g). The CD4+ proportion of FoxP3+ LP or ILN lymphocytes (range = 81–91%) was similar between ApcMin/+ and wild‐type mice. Consequently, during the phase of increased Cox‐2‐dependent PGE2 production, we demonstrated an increased (predominantly CD4+) regulatory intestinal lymphocyte population in ApcMin/+ mice. Changes of a similar nature were not observed in inguinal lymph nodes.
An increased CD25+ regulatory T lymphocyte population during tumorigenesis in ApcMin/+ mouse intestine
IL‐2 receptor‐alpha (CD25) is a low‐affinity IL‐2 receptor expressed by Tregs and activated lymphocytes 19. We therefore analysed FoxP3 and CD25 expression by LP CD4 lymphocytes of ApcMin/+ and wild‐type mice to determine the phenotype of the increased Treg population occurring during the phase of increased Cox‐2 expression (Fig. 2h,i).
As observed previously, a significantly increased CD4+FoxP3+ proportion of LP lymphocytes was observed in 15‐week‐old ApcMin/+ compared with wild‐type mice (Fig. 2i). Even though the CD25+ proportion of CD4+FoxP3+ lymphocytes was reduced in wild‐type intestine compared to ILN (Fig. 2h,i), the CD25+ proportion of CD4+FoxP3+ LP lymphocytes was higher in 15‐week‐old ApcMin/+ than wild‐type mice (P = 0·002) (Fig. 2i).
Cox‐2‐inhibitor therapy inhibits small intestinal tumorigenesis and prevents the increase in CD4+FoxP3+CD25+ lymphocytes in the ApcMin/+ mouse
We determined initially if Cox‐2 inhibitor therapy (with Celecoxib 300 parts ppm) prevented intestinal tumorigenesis in ApcMin/+ mice, as described previously 16. Figure 3a shows that Celecoxib treatment led to an 85% reduction in intestinal adenoma numbers in ApcMin/+ mice.
We then determined the effect of Cox‐2 inhibition on the Treg population of 15‐week‐old ApcMin/+ mice. Celecoxib therapy had no significant effect on the CD25+ proportion of the CD4+FoxP3+ ILN lymphocytes (Fig. 3b). However, the increased CD25+ proportion of CD4+FoxP3+ LP lymphocytes of ApcMin/+ compared with wild‐type mice was reduced by Celecoxib treatment (Fig. 3c). This suggested that the increased CD25+ intestinal Treg population of ApcMin/+ mice was dependent upon Cox‐2 activity. Notably, there was no significant difference in the proportion of CD4+FoxP3+ intestinal lymphocytes between Cox‐2 inhibitor‐treated ApcMin/+ mice (24·56 ± 0·59%; n = 4) and those fed a control diet (24·12 ± 2·18%; n = 8) (P = 0·933). This suggested that even though Cox‐2 inhibition decreased the CD25+ intestinal Treg population, it did not decrease the total intestinal Treg population.
FoxP3 and Cox‐2 expressing cells are co‐localized to the interstitium of ApcMin/+ small intestinal adenomas
The distribution of FoxP3+ cells in this study (Figs 1 and 3) was similar to the distribution of Cox‐2+ cells in our previous study 11 and those of others 12. Therefore, to substantiate the possibility of paracrine interaction between Tregs and Cox‐2 expressing mononuclear phagocytes, we carried out co‐immunohistochemistry for FoxP3 and Cox‐2 expression on intestinal adenomas of ApcMin/+ mice. FoxP3 and Cox‐2 expressing cells were co‐localized to the interstitium of intestinal adenomas (Fig. 3g).
No impairment of CD4‐regulatory T lymphocyte function in ApcMin/+ mice
Lymphocytic developmental defects have been described in mice with constitutive β‐catenin signalling 20, such as occurs in Apc mutant mice. We therefore tested for possible defective function of ApcMin/+ mouse CD4+ Tregs accounting for their increased numbers in the immune active intestinal micro‐environment. CD4+CD25– (helper) and CD4+CD25+ (regulatory) T lymphocytes were isolated from splenic and ILN lymphocytes of ApcMin/+ mice (n = 3) and wild‐type mice (n = 3) at 15 weeks of age. The percentage suppression of CD3CD28‐induced T lymphocyte proliferation by regulatory T lymphocytes was 62·8 ± 16·1% for ApcMin/+ compared to 59·9 ± 9·1% for wild‐type mice. Therefore, we did not observe any impairment of ApcMin/+ mouse peripheral Treg functional ability.
Helios expression by intestinal regulatory lymphocytes of ApcMin/+ mice
Helios expression has been reported to stabilize Treg function 21. We further characterized the increased intestinal Tregs occurring after the phase of increased Cox‐2‐dependent PGE2 production in ApcMin/+ mice (Fig. 4). We compared Helios expression by LP Tregs of 15‐week‐old ApcMin/+ and wild‐type mice (Fig. 4). Among CD4+FoxP3+ LP lymphocytes, a significantly increased Helios+ population was observed in ApcMin/+ compared with wild‐type mice (P = 0·029) (Fig. 4e). Furthermore, among CD4+CD25+ LP lymphocytes, increased Helios expression in ApcMin/+ compared with wild‐type mice (P = 0·029) was observed (Fig. 4f). This suggested that induced Tregs during the phase of Cox‐2 dependent PGE2 production were predominantly CD25+ and Helios+ in ApcMin/+ mice. In contrast, no significant differences were observed in the Helios + lymphocyte populations between ILN lymphocytes of ApcMin/+ and wild‐type mice (data not shown).
Figure 4.
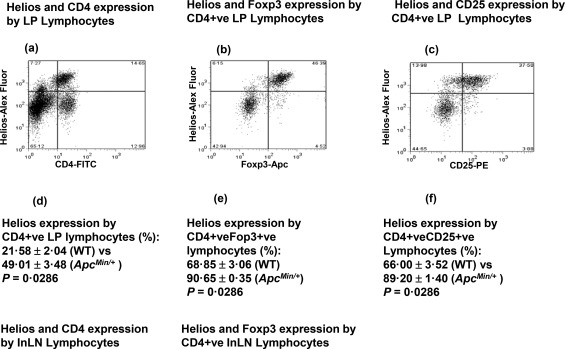
Increased proportions of Helios+forkhead box protein 3 (FoxP3)+CD25+ small intestinal regulatory T lymphocytes in ApcMin/+ mice at 15 weeks of age. (a–c) Representative flow cytometry plots of intestinal lamina propria mononuclear cells (LPMNCs) showing: (a) The % of Helios and CD4+ cells within viable lymphocytes of an ApcMin/+ mouse. (b) The % of Helios+ and FoxP3+ cells within viable lymphocytes of an ApcMin/+ mouse gated for CD4 expression. (c) The % of Helios+ and CD25+ cells within viable lymphocytes of an ApcMin/+ mouse gated for CD4 expression. (d) There is a significantly increased LP Helios+ CD4‐lymphocyte population in ApcMin/+ compared with wild‐type mice. (e) There is a significantly increased LP Helios+FoxP3+ CD4‐lymphocyte population in ApcMin/+ compared with wild‐type mice. (f) There is a significantly increased LP Helios+CD25+CD4–lymphocyte population in ApcMin/+ compared with wild‐type mice.
Tslp and Tgf‐β expression by small intestinal epithelial cells of ApcMin/+ and wild‐type mice at different ages
We then compared known molecular signals to Treg generation between ApcMin/+ and wild‐type mice. We compared small intestinal epithelial Tgf‐β 22 and Tslp 23 mRNA expression prior to and after the period of increased Cox‐2 dependent PGE2 production. Increased Tgf‐β mRNA expression was observed between 4 and 15 weeks of age in ApcMin/+ and wild‐type mice (Fig. 5a), but levels of Tgf‐β mRNA expression were similar between ApcMin/+ and wild‐type mice at either age tested. In contrast, we observed a trend towards decreased small intestinal epithelial Tslp mRNA expression between 4 and 15 weeks of age in ApcMin/+ and wild‐type mice, but no difference in levels of Tslp mRNA expression between ApcMin/+ and wild‐type mice at either age tested (Fig. 5b).
Figure 5.
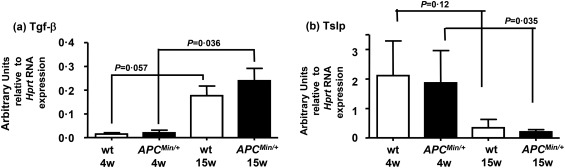
Tgf‐β and Tslp mRNA expression by small intestinal cells of wild‐type (wt) and ApcMin/+ mice. mRNA isolated from small intestinal epithelial cells of ApcMin/+ (black boxes) and wt (open boxes) mice was analysed by real‐time polymerase chain reaction (PCR) analysis. The fold expression of Tgf‐β (a) or Tslp (b) relative to Hprt for individual mice is expressed in arbitrary units [three to five mice per group, data reported as mean ± standard error of the mean (s.e.m.)]. There was no difference between wt and ApcMin/+ mice at either 4 or 15 weeks of age for mRNA of either gene. There was a significant increase in Tgf‐β expression in ApcMin/+ and an almost significant increase in wt mice at 15 weeks of age compared to younger mice (Mann–Whitney U‐test). Tslp expression was more variable in the younger age group; although the results did not achieve significance, there was a trend for higher Tslp expression in younger animals of both genotypes.
Discussion
To the best of our knowledge, this is the first description of an association between Cox‐2 activity and Treg phenotypical variation during intestinal tumorigenesis in the ApcMin/+ model. We show an increased predominantly CD4+ ApcMin/+ small intestinal Treg population with age during the phase of adenoma development. This is consistent with previous reports of increased Tregs in the tumor micro‐environment 24. Similarly, we previously showed induction of human Tregs in vitro by a small‐cell lung cancer cell line 25. Perhaps the most important finding was a Cox‐2‐dependent increased CD25+ intestinal Treg population which is Helios+. We also demonstrate co‐localization of Tregs and Cox‐2 expressing mononuclear phagocytes. Taken together, these suggest that paracrine interaction between Cox‐2 expressing mononuclear phagocytes and Tregs in ApcMin/+ mouse intestine modulate the Treg phenotype.
Determining the functional significance of phenotypical observations reported here, as well as the relationship between Cox‐2 and PD‐1/PDL‐1 expression, were beyond the scope of this study. However, diphtheria‐toxin‐mediated FoxP3‐expressing cell depletion in the ApcMin/+ mouse has been reported to increase intestinal T lymphocyte infiltrates with a proinflammatory stroma as a consequence 26. Nevertheless, the functional significance of the CD25+FoxP3+ subpopulation in the intestinal immune microenvironment is not known. The recent observation that antibody‐mediated depletion of CD25+ cells in a mouse model enhanced response to PD‐1 antagonism suggests their potential in‐vivo relevance. CD25‐null mice (IL‐2Rα‐null) had reduced sensitivity to IL‐2, which compromised T lymphocyte function associated with polyclonal expansion of T lymphocytes 27. With respect to Tregs, it is known that IL‐2R–STAT‐5‐mediated signalling generates activated STAT‐5, which is essential for stabilization of FoxP3 expression by binding the conserved non‐coding sequence 2 (CNS2) region of the FoxP3 promoter 28. Additionally, the Ikaros transcription factor Helios is known to have STAT‐5b as one of its principal targets in mice, stabilizing STAT‐5‐dependent IL‐2 responsiveness 21. The observation that constitutive STAT‐5b activation increased intestinal adenoma size in the ApcMin/+ mouse is consistent with a role for IL‐2R‐–STAT‐5 Treg activation in promoting intestinal tumorigenesis 29. It is noteworthy that constitutive STAT‐5b activation abrogated proinflammatory cytokine secretion while modifying expression of cell surface molecules by T lymphocytes 29. These, taken together, suggest that abrogation of an increased intestinal CD25+ Treg population during tumorigenesis in ApcMin/ + mice by Cox‐2 inhibition could impair Treg function, thus countering tumour immunosuppression. Our observation that the CD25+ Treg population of unconnected lymph nodes is not increased during tumorigenesis and unaffected by Cox‐2 inhibition suggests selectivity of the LP Treg phenotypical modification as a potential therapeutic target, compared to non‐specific ablation of the CD25+ population.
With regard to underlying mechanisms, the observation of an increased proportion of CD25– LP Tregs and increased intestinal epithelial Tgf‐β expression with age in wild‐type mice would be consistent with the generation of adaptive Tregs by TGF‐β activity in intestinal immune tolerance 30. However, there was no increase in levels of Tgf‐β expression in ApcMin/+ compared with wild‐type small intestine to explain the further increase in the number of CD25– Tregs observed with the inhibition of Cox‐2 activity. The observation that Cox‐2 inhibition is known to suppress the growth of adenomas greater than 1 mm in size, but does not abrogate adenoma growth completely, may explain this 31. Consequently, one explanation for increased CD25– Tregs in ApcMin/+ with Cox‐2 inhibition could be increased TGF‐β derived from an increased number of intestinal epithelial cells within adenomas, rather than increased levels of Tgf‐β expression in ApcMin/+ mice. However, an alternative tumour‐specific signal to LP Treg generation during the process of tumorigenesis (which was not the purpose of this study) cannot be excluded. With reference to our observations, it has been proposed that, in different circumstances, TGF‐β can generate Tregs via diverse molecular pathways [dependent upon or independent of CD25 signalling] 32. Furthermore, a previous study showed conversion of CD25– Tregs to CD25+ Tregs by TGF‐β to mediate immunosuppression in tumours 33. Of possible relevance to this is the fact that TGF‐β has been shown to induce alternative activation of mononuclear phagocytes 34. Our study suggests that Cox‐2 inhibition reverses paracrine effects of alternately activated macrophages to enhance CD25 expression in Tregs of the ApcMin/+ intestinal micro‐environment.
With regard to determining the clinical relevance of observations reported here, it would be important to determine if the phenotypical Treg change observed with Cox‐2 inhibition in ApcMin/+ intestine applies to CRC tumours and/or metastases in humans. Furthermore, future studies will need to define the functional significance of loss of the Treg IL‐2 receptor with Cox‐2 inhibition in the ApcMin/+ intestinal tumour micro‐environment. These could help to determine if there is a role for Cox‐2 inhibition in enhancing immunotherapy for CRC.
Disclosure
None declared.
Acknowledgements
O. O. F. and S. H. designed the study. O. O. F. performed the experiments. P. F. assisted with the experiments. We are grateful to Mr Robert Morris for technical advice and support and for advice from Professors Owen Sansom and David Harrison. O. O. F. wrote the initial copy of the manuscript. All authors agreed to the final copy. We wish to express our gratitude to Ms Jennifer Rennie and Ms Laraine Wells of the BRR animal facility, University of Edinburgh for expert help with the animals used in the study. We also wish to thank Ms Helen Cadwell for helping with mouse genotyping and Ms Shona Johnston (QMRI flow cytometry facility) for advice regarding flow cytometric analysis. The KIS fund and Lothian Cancer Research Endowments funded this work. The Research Fellowship for O. O. F. was funded by NHS Education for Scotland.
References
- 1. Ferlay J, Steliarova‐Foucher E, Lortet‐Tieulent J et al Cancer incidence and mortality patterns in Europe: estimates for 40 countries in 2012. Eur J Cancer 2013; 49:1374–403. [DOI] [PubMed] [Google Scholar]
- 2. Le DT, Uram JN, Wang H et al PD‐1 blockade in tumors with mismatch‐repair deficiency. N Engl J Med 2015; 372:2509–20. [DOI] [PMC free article] [PubMed] [Google Scholar]
- 3. Droeser RA, Hirt C, Viehl CT et al Clinical impact of programmed cell death ligand 1 expression in colorectal cancer. Eur J Cancer 2013; 49:2233–42. [DOI] [PubMed] [Google Scholar]
- 4. Arce Vargas F, Furness AJS, Solomon I et al Fc‐optimized anti‐CD25 depletes tumor‐infiltrating regulatory T cells and synergizes with PD‐1 blockade to eradicate established tumors. Immunity 2017; 46:577–86. [DOI] [PMC free article] [PubMed] [Google Scholar]
- 5. Khan KN, Masferrer JL, Woerner BM, Soslow R, Koki AT. Enhanced cyclooxygenase‐2 expression in sporadic and familial adenomatous polyposis of human colon. Scand J Gastroenterol 2001; 36:865 –9. [DOI] [PubMed] [Google Scholar]
- 6. Chapple KS, Cartwright EJ, Hawcroft G et al Localization of cyclooxygenase‐2 in human sporadic colorectal adenomas. Am J Pathol 2000; 156:545 –53. [DOI] [PMC free article] [PubMed] [Google Scholar]
- 7. Castells A, Payá A, Alenda C et al Cyclooxygenase 2 expression in colorectal cancer with DNA mismatch repair deficiency. Clin Cancer Res 2006; 12:1686–92. [DOI] [PubMed] [Google Scholar]
- 8. Sinicrope FA, Lemoine M, Xi L et al Reduced expression of cyclooxygenase 2 proteins in hereditary nonpolyposis colorectal cancers relative to sporadic cancers. Gastroenterology 1999; 117:350–8. [DOI] [PubMed] [Google Scholar]
- 9. Newberry RD, Stenson WF, Lorenz RG. Cyclooxygenase‐2‐dependent arachidonic acid metabolites are essential modulators of the intestinal immune response to dietary antigen. Nat Med 1999; 5:900–6. [DOI] [PubMed] [Google Scholar]
- 10. Baratelli F, Lin Y, Zhu L et al Prostaglandin E2 induces FOXP3 Gene expression and T‐regulatory cell function in human CD4+ T cells. J Immunol 2005; 175:1483–90. [DOI] [PubMed] [Google Scholar]
- 11. Hull MA, Faluyi OO, Ko CWS et al Regulation of stromal cell cyclooxygenase‐2 in the ApcMin/+ mouse model of intestinal tumorigenesis. Carcinogenesis 2006; 27:382–91. [DOI] [PubMed] [Google Scholar]
- 12. Shattuck‐Brandt RL, Varilek GW, Radhika A, Yang F, Washington MK, DuBois RN. Cyclooxygenase 2 expression is increased in the stroma of colon carcinomas from IL‐10(–/–) mice. Gastroenterology 2000; 118:337–45. [DOI] [PubMed] [Google Scholar]
- 13. Sonoshita M, Takaku K, Oshima M, Sugihara K, Taketo MM. Cyclooxygenase‐2 expression in fibroblasts and endothelial cells of intestinal polyps. Cancer Res 2002; 62:6846–9. [PubMed] [Google Scholar]
- 14. Erdman SE, Sohn JJ, Rao VP et al CD4+CD25+ regulatory lymphocytes induce regression of intestinal tumors in ApcMin/+ mice. Cancer Res 2005; 65:3998–4004. [DOI] [PubMed] [Google Scholar]
- 15. Rao VP, Poutahidis T, Ge Z et al Proinflammatory CD4+CD45RBhi lymphocytes promote mammary and intestinal carcinogenesis in ApcMin/+ mice. Cancer Res 2006; 66:57–61. [DOI] [PubMed] [Google Scholar]
- 16. Swamy MV, Patlolla JM, Steele VE, Kopelovich L, Reddy BS, Rao CV. Chemoprevention of familial adenomatous polyposis by low doses of atorvastatin and celecoxib given individually and in combination to APCMin mice. Cancer Res 2006; 66:7370–7. [DOI] [PubMed] [Google Scholar]
- 17. Cook CH, Bickerstaff AA, Wang J et al Spontaneous renal allograft acceptance associated with ''regulatory'' dendritic cells and IDO. J Immunol 2008; 180:3103 – 12. [DOI] [PMC free article] [PubMed] [Google Scholar]
- 18. Tanner SM, Daft JG, Hill SA, Martin CA, Lorenz RG. Altered T‐cell balance in lymphoid organs of a mouse model of colorectal cancer. J Histochem Cytochem 2016; 64:753–67. [DOI] [PMC free article] [PubMed] [Google Scholar]
- 19. Malek TR, Castro I. Interleukin‐2 receptor signaling: at the interface between tolerance and immunity. Immunity 2010; 33:153–65. [DOI] [PMC free article] [PubMed] [Google Scholar]
- 20. Coletta PL, Müller AM, Jones EA et al Lymphodepletion in the ApcMin/+ mouse model of intestinal tumorigenesis. Blood 2004; 103:1050–8. [DOI] [PubMed] [Google Scholar]
- 21. Kim HJ, Barnitz RA, Kreslavsky T et al Stable inhibitory activity of regulatory T cells requires the transcription factor Helios. Science 2015; 350:334–9. [DOI] [PMC free article] [PubMed] [Google Scholar]
- 22. Buzoni‐Gatel D, Debbabi H, Mennechet FJD et al Murine ileitis after intracellular parasite infection is controlled by TGF‐beta producing intraepithelial lymphocytes. Gastroenterology 2001; 120:914–24. [DOI] [PubMed] [Google Scholar]
- 23. Taylor BC, Zaph C, Troy AE et al TSLP regulates intestinal immunity and inflammation in mouse models of helminth infection and colitis. J Exp Med 2009; 206:655–67. [DOI] [PMC free article] [PubMed] [Google Scholar]
- 24. Valzasina B, Piconese S, Guiducci C, Colombo MP. Tumor‐induced expansion of regulatory T cells by conversion of CD4+CD25– lymphocytes is thymus and proliferation independent. Cancer Res 2006; 66:4488–95. [DOI] [PubMed] [Google Scholar]
- 25. Wang W, Hodkinson P, McLaren F et al Small cell lung cancer tumour cells induce regulatory T lymphocytes, and patient survival correlates negatively with FOXP3(+) cells in tumour infiltrate. Int J Cancer 2012; 131:E928–37. [DOI] [PubMed] [Google Scholar]
- 26. Akeus P, Langenes V, Kristensen J et al Treg‐cell depletion promotes chemokine production and accumulation of CXCR3(+) conventional T cells in intestinal tumors. Eur J Immunol 45:1654–66. [DOI] [PubMed] [Google Scholar]
- 27. Willerford DM, Chen J, Ferry JA, Davidson L, Ma A, Alt FW. Interleukin‐2 receptor alpha chain regulates the size and content of the peripheral lymphoid compartment. Immunity 1995; 3:521–30. [DOI] [PubMed] [Google Scholar]
- 28. Josefowicz SZ, Lu LF, Rudensky AY. Regulatory T cells: mechanisms of differentiation and function. Annu Rev Immunol 2012; 30:531–64. [DOI] [PMC free article] [PubMed] [Google Scholar]
- 29. Chinen T, Kannan AK, Levine AG et al An essential role for the IL‐2 receptor in Treg cell function. Nat Immunol 2016; 17:1322–33. [DOI] [PMC free article] [PubMed] [Google Scholar]
- 30. Neurath MF, Fuss I, Kelsall BL, Presky DH, Waegell W, Strober W. Experimental granulomatous colitis in mice is abrogated by induction of TGF‐beta‐mediated oral tolerance. J Exp Med 1996; 183:2605–16. [DOI] [PMC free article] [PubMed] [Google Scholar]
- 31. Seno H, Oshima M, Ishikawa TO et al Cyclooxygenase‐2 and prostaglandin E(2) receptor EP(2)‐dependent angiogenesis in Apc(Delta716) mouse intestinal polyps. Cancer Res 2002; 62:506–11. [PubMed] [Google Scholar]
- 32. Ogawa C, Tone Y, Tsuda M, Peter C, Waldmann H, Tone M. TGF‐β‐mediated Foxp3 gene expression is cooperatively regulated by Stat5, Creb, and AP‐1 through CNS2. J Immunol 2014; 192:475–83. [DOI] [PMC free article] [PubMed] [Google Scholar]
- 33. Liu VC, Wong LY, Jang T et al Tumor evasion of the immune system by converting CD4+CD25‐ T cells into CD4+CD25+ T regulatory cells: role of tumor‐derived TGF‐beta. J Immunol 2007; 178:2883–92. [DOI] [PubMed] [Google Scholar]
- 34. Tiemessen MM, Jagger AL, Evans HG, van Herwijnen MJ, John S, Taams LS. CD4+CD25+Foxp3+ regulatory T cells induce alternative activation of human monocytes/macrophages. Proc Natl Acad Sci USA 2007; 104:19446–51. [DOI] [PMC free article] [PubMed] [Google Scholar]