Figure 5.

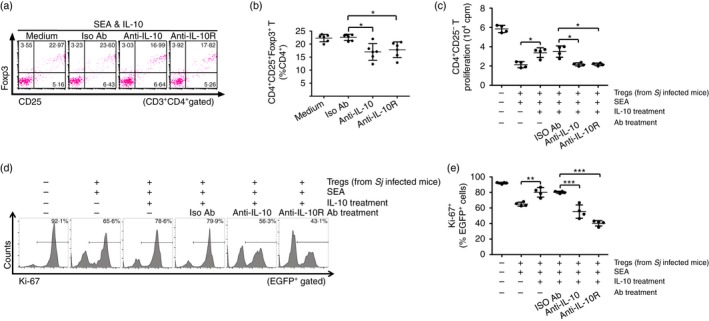
Anti‐interleukin‐10 (IL‐10) or anti‐interleukin‐10 receptor (IL‐10R) antibody in vitro treatment diminished soluble egg antigen (SEA) ‐mediated induction of regulatory T (Treg) cells and restored their suppression activity. (a) Splenocytes isolated from S. japonicum‐infected mice were pre‐treated with 20 μg/ml of anti‐IL‐10, anti‐IL‐10R or rat IgG1 isotype control antibody for 30 min and then followed by 20 ng/ml of rmIL‐10 treatment in the presence of SEA for a further 72 hr (n = 6 per group), as described in the Materials and methods. Cells were stained with PerCP‐Cy5.5 anti‐CD3, FITC anti‐CD4, APC anti‐CD25, and PE anti‐Foxp3. FCM dot plots of CD25+ Foxp3+ Treg cells gated on CD3+ CD4+ T cells are shown. (b) Scatter plot shows the average percentages of CD4+ CD25+ Foxp3+ Treg cells in CD4+ T cells. (c) Anti‐IL‐10 or anti‐IL‐10R pre‐treated CD4+ CD25+ Treg cells (1 × 10⁵/well) were co‐cultured in triplicate wells with normal mouse‐derived CD4+ CD25− T cells and antigen‐presenting cells at a ratio of 1 : 1 : 1 in the presence of anti‐CD3 (2 μg/ml) at 37° for 72 hr (n = 4 per group). The proliferation was measured by incorporation of [3H]thymidine. Each assay has been performed three times on independent cell samples. (d, e) CD4+ CD25− T cells from EGFP‐Tg mice and CD4+ CD25+ Treg cells from S. japonicum‐infected mice pre‐treated with anti‐IL‐10, anti‐IL‐10R or isotype control antibodies were co‐cultured as described in (c) (n = 4 per group). The suppressive activity of Treg cells on CD4+ CD25− T cells was measured by analysing the expression of Ki‐67 in EGFP + cells (CD4+ CD25− T cells). Histogram profiles of Ki‐67 gated on EGFP + cells are shown. Scatter plot shows the average percentages of Ki‐67+ cells in EGFP + cells. Flow cytometry dot plots or histograms are representative of three independent experiments. Data (mean ± SD) are representative of three independent experiments. *P < 0·05, **P < 0·01, ***P < 0·001. [Colour figure can be viewed at wileyonlinelibrary.com]
