Figure 8.

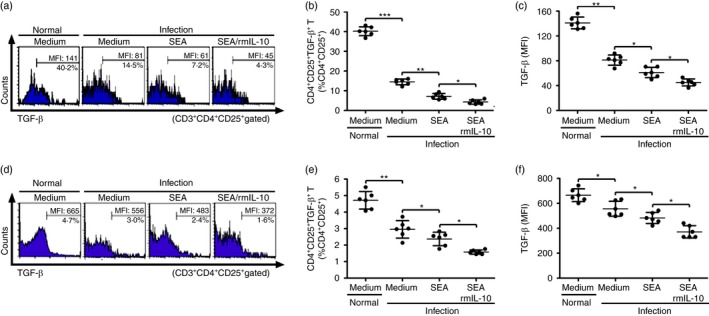
Interleukin‐10 (IL‐10) in vitro treatment regulated murine transforming growth factor‐β (mTGF‐β) expression on surface of regulatory T (Treg) cells. (a) Splenocytes (1 × 10⁷/well) from Schistosoma japonicum‐infected mice were stimulated in triplicate wells with SEA (20 μg/ml) in the presence or absence of rmIL‐10 (20 ng/ml) in a 24‐well‐plate at 37° for 72 hr (n = 6 per group). Splenocytes were then collected and stained with PerCP‐Cy5.5 anti‐CD3, FITC anti‐CD4, APC anti‐CD25 and anti‐TGF‐β. Histogram profiles of mTGF‐β gated on CD3+ CD4+ CD25+ Treg cells are shown. (b, c) Scatter plots show respectively the average percentages of CD4+ CD25+ mTGF‐β + Treg cells in CD3+ CD4+ CD25+ Treg cells and the average MFI of mTGF‐β expression in CD3+ CD4+ CD25+ Treg cells. (d) Purified CD4+ CD25+ Treg cells (1 × 10⁶/well) from S. japonicum‐infected mice were cultured in triplicate wells with or without recombinant murine (rm) IL‐10 (20 ng/ml) under soluble egg antigen (SEA) stimulation (20 μg/ml) for 72 hr (n = 6 per group). CD4+ CD25+ Treg cells from normal mice served as a control. Histogram profiles of mTGF‐β gated on CD3+ CD4+ CD25+ Treg cells are shown. (e, f) Scatter plots show respectively the average percentages of CD4+ CD25+ mTGF‐β + Treg cells in CD3+ CD4+ CD25+ Treg cells and the average MFI of mTGF‐β expression in CD3+ CD4+ CD25+ Treg cells. Data (means ± SD) of 12 mice are representative of two independent experiments. *P < 0·05, **P < 0·01, ***P < 0·001. [Colour figure can be viewed at wileyonlinelibrary.com]
