Abstract
In this study, distributed fiber optic sensors based on pulse pre-pump Brillouin optical time domain analysis (PPP-BODTA) are characterized and deployed to measure spatially-distributed temperatures in reinforced concrete specimens exposed to fire. Four beams were tested to failure in a natural gas fueled compartment fire, each instrumented with one fused silica, single-mode optical fiber as a distributed sensor and four thermocouples. Prior to concrete cracking, the distributed temperature was validated at locations of the thermocouples by a relative difference of less than 9 %. The cracks in concrete can be identified as sharp peaks in the temperature distribution since the cracks are locally filled with hot air. Concrete cracking did not affect the sensitivity of the distributed sensor but concrete spalling broke the optical fiber loop required for PPP-BOTDA measurements.
Keywords: Fire, Temperature distribution, Distributed fiber optic sensor, PPP-BOTDA, Reinforced concrete, Crack detection
1. Introduction
The load bearing capacity and integrity of concrete structures can degrade significantly during a fire due to degraded material properties and spalling associated with high temperatures [1, 2]. The remaining capacity of a structure can be more reliably evaluated through thermo-mechanical analysis when temperature distributions within structural members are known in situ [3]. The current state of practice in experimental structural fire analysis is to measure local temperatures on the surface or inside of concrete members using thermocouples (or calculate surface temperatures from measured heat fluxes), and then estimate the temperature distributions within the concrete structures [4]. While thermocouples can be deployed to measure temperatures at numerous locations, the required wiring is costly and time consuming – particularly in large-scale structures. More importantly, measurements from thermocouples can be adversely affected by electromagnetic interference, moisture, and unanticipated junctions[5].
Fiber optic sensors are compact, durable, accurate, immune to electromagnetic interference, and resistant to harsh environments. They can be various types of interferometers for strain and temperature measurements, such as Fabry-Perot interferometers fabricated with femtosecond lasers [6], Michelson fiber interferometers with mixed single-mode and multi-mode fibers [7], and Mach-Zehnder interferometers with conventional single-mode optical fibers [8]. They can also be grating sensors, such as fiber Bragg gratings (FBGs) and long period fiber gratings [9, 10]. Conventional grating sensors degrade significantly when temperature exceeds 300 °C [11, 12] and regenerated FBG sensors can survive 1000 °C [13]. Neither grating sensors nor interferometric sensors, however, provide fully-distributed measurements. Although multiple grating sensors can be multiplexed to form a quasi-distributed sensor [14], they can be costly and inconvenient to fabricate.
Fully-distributed sensors using telecommunications-grade optical fiber, based on light scattering changes, have attracted increased interest in the past decade. For example, Raman scattering was used to measure temperature changes [15]. Rayleigh scattering was used to measure strain and temperature with high spatial resolution [16]. Spontaneous Brillouin scattering with single-end measurements was used for strain and temperature measurements in Brillouin optical time domain reflectometry (BOTDR). Stimulated Brillouin scattering with two-end measurements was used to enhance the strain and temperature measurements in Brillouin optical time domain analysis (BOTDA). A predictable shift in Brillouin frequency for temperatures up to 1050 °C was demonstrated [17]. The temperature sensitivity was found to decrease at temperatures above 400 °C, and a bilinear relationship was provided [17]. A fiber with side holes was used to develop high temperature sensors with traditional BOTDA [18], for which a linear relationship between Brillouin frequency and temperature up to 1000 °C was reported.
The spatial resolution of both BOTDA and BOTDR is in the order of half a meter, which is too coarse for strain measurement in some structural applications [19]. Thus, a pulse pre-pump BOTDA (PPP-BOTDA) has recently been developed and commercialized with spatial resolution of 2 cm over a measurement distance of 0.5 km [20, 21]. PPP-BOTDA sensors for strain and temperature measurement at elevated temperatures were characterized [22–24], and implemented the sensors for steel beams in fire [25]. With an annealing treatment, the maximum operation temperature has been extended to 1000 °C [26]. However, fully-distributed fiber optic sensors have never been embedded in concrete to investigate their potential in fire research.
In this study, four small-scale reinforced concrete beams were tested in a natural gas fueled compartment fire in the National Fire Research Laboratory at the National Institute of Standards and Technology (NIST). Each beam was instrumented with a distributed fiber optic sensor and four thermocouples and exposed to fires of increasing intensity until extensive spalling of the concrete occurred. The thermocouples were used to validate the distributed sensor at the locations of the thermocouples.
2. Distributed Fiber Optic Sensors
2.1. Description of the Optical Fiber
A single-mode optical fiber with a dual-layer coating was used as a distributed sensor. As illustrated in Fig. 1, the optical fiber was composed of a silica (glass) core (diameter: 8.2 μm), a silica cladding (outer diameter: 125 μm), and a dual-layer polymer coating (outer diameter: 242 μm). The soft inner layerof the polymer coating (outer diameter:190 μm) protectsthe glass from mechanical impact, and the stiff outer layer protects the fiber from abrasion and adverse environmental effects. The protective coating burns off at approximately 300 °C to 400 °C. However, the glass core and cladding can sustain temperatures above 1000 °C. Light waves propagate along the optical fiber with total internal reflection occurring at the interface of the core and the cladding [16].
Fig. 1.
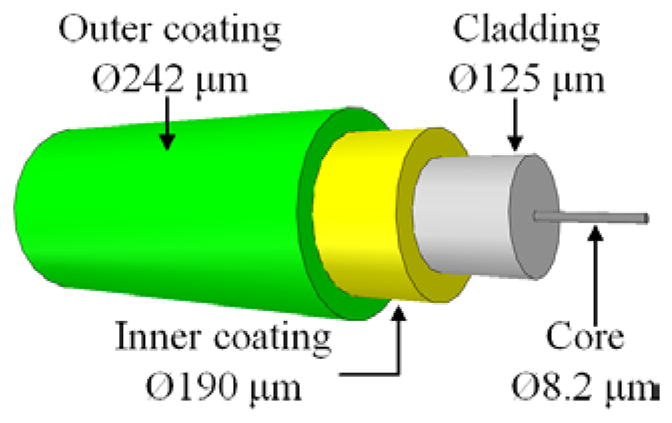
Schematic view of an optical fiber with dual-layer coating.
2.2. Working Principle of PPP-BOTDA
PPP-BOTDA measures stimulated Brillouin backscattering light at any point along the length of an optical fiber using a pulsed pump wave and a counter-propagating continuous probe wave [19]. When the frequency difference between the pump and probe waves matches the frequency associated with the vibration of a crystal lattice, the probe wave is amplified and the frequency difference is referred to as the Brillouin frequency. The Brillouin frequency depends on the optical properties of the fiber, which change with the strain and temperature applied on the optical fiber. The arrival time of backscattered light is related to the location in the optical fiber where strain and temperature are applied. For silica-based single mode optical fibers, the Brillouin frequency νB typically ranges from 9 GHz to 13 GHz for light wavelengths of 1.3 μm to 1.6 μm and can be calculated by [19]:
| (1) |
where ν0 denotes the frequency of an incipient light wave, n denotes the refractive index of the optical fiber, Va denotes the speed of acoustic wave in the fiber, and C (= 3.0 × 10⁸ m/s) denotes the speed of light in a vacuum. The speed of the acoustic wave is given by [20]:
| (2) |
where μ, E, and ρ denote the Poisson’s ratio, the Young’s modulus, and the density of the fiber, respectively.
The refractive index and density are related to both temperature and strain. The Poisson’s ratio and Young’s modulus are related to temperature only. Therefore, the Brillouin frequency varies with strain and temperature changes in the fiber. For a relatively small change of strain Δε and temperature ΔT with respect to their calibration values, the Brillouin frequency shift ΔνB can be linearly related to the strain and temperature changes[19]:
| (3) |
where Cε and CT denote the strain and temperature sensitivity coefficients, respectively. For an optical fiber that is free of strain change, the Brillouin frequency shift depends upon temperature change only. For large changes in temperature, the relationship is nonlinear [24, 26]. When both strain and temperature change, an additional fiber that is free of strain can be incorporated for temperature compensation.
2.3. Sensor Calibration
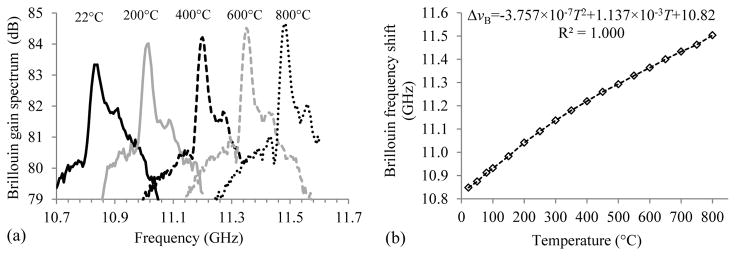
The sensitivity of Brillouin frequency to temperature was experimentally calibrated. The optical fiber was passed through an electric tube furnace where the temperature was monitored using a calibrated thermocouple. The furnace temperature was monotonically increased from 22 °C to 800 °C. Spatially-distributed Brillouin gain spectra were measured along the length of the test optical fiber using a Neubrescope® data acquisition system (Model NBX7020). The five curves in Fig. 2(a) represent the one-point Brillouin gain spectra measured at five temperatures [26]. The peak of each curve represents the corresponding Brillouin frequency at a given temperature. The Brillouin frequency was then determined using a Lorentz curve-fitting algorithm and plotted against temperature, as shown in Fig. 2(b). The Brillouin frequency increased with temperature at a decreasing rate as the temperature increased from room temperature to 800 °C. The relationship between the Brillouin frequency and temperature was fitted using a parabolic equation with thecoefficient of determination (R2) equal to 1.000.
Fig. 2.
Temperature measurement: (a) Brillouin frequency shift, and (b) frequency-temperature calibration.
3. Experimental Program
3.1. Test Setup
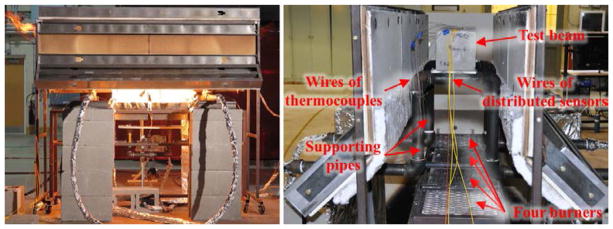
Each concrete beam was tested in the compartment fire setup shown in Fig. 3. The setup, which was located under a 6 m × 6 m exhaust hood, consisted of a burner rack, an enclosure and water-cooled supports for the beam specimen. The rack supported four independent natural gas diffusion burners made of sheet metal, each with dimensions of 300 mm × 300 mm × 140 mm (length × width × height). The two middle burners were fueled with natural gas from their bottom through the burner cavity and a 20 mm thick ceramic fiber blanket for gas distribution. The burners were manually regulated using a needle valve on the gas line, and the energy content of the supplied gas was measured with an expanded uncertainty of less than 2.4 % [27]. An enclosure constructed of steel square tubes, cold-formed steel C-channels, and gypsum boards lined with refractory fiber board formed the fire test space above the burner rack. The enclosure was open at the bottom and the two end faces in the longitudinal direction of the beam, creating the compartment flame dynamics depicted in Fig 3. The heated area created by the enclosure had dimensions of 380 mm × 400 mm × 1830 mm (height × width × length), in which the entire beam was engulfed in flame.
Fig. 3.
Test setup.
The test beams were simply supported at a clear span of 0.5 m on two supports constructed from 1-1/2″ Schedule 40 pipe (outer diameter: 48 mm), which were, in turn, supported on concrete blocks. The only mechanical load on the beam was its self-weight. The supporting pipes were water-cooled so that the exiting water temperature did not exceed 50 °C, which limited undesired thermally-induced movement of the supports.
3.2. Test Specimens and Instrumentation
Four concrete beams were tested, designated as Beam 1, Beam 2, Beam 3, and Beam 4 in Fig. 4. Each beam was 152 mm deep, 152 mm wide, and 610 mm long. Normal weight concrete with nominal 28-day compressive strength of 42 MPa was used (concrete casting and curing are detailed in Section 3.3). A deformed steel reinforcing bar with 25.4 mm diameter was placed approximately in the center of each beam. The geometry of the beams was not intended to be representative of construction practice, but rather to provide simple specimen geometry to test the optical fibers. Each test beam was instrumented with four, glass sheathed, K-type, bare-bead thermocouples, and one distributed fiber optic sensor. The four thermocouples (TC1, TC2, TC3, and TC4) were embedded within the beam at the quarter span and the mid-span as depicted in Fig. 4. TC1 was at the quarter span at the 1/2 depth of the beam and near the rebar; TC2, TC3, and TC4 were at mid-span at the 1/4, 1/2, and 3/4 depth of the beam, respectively. Additional thermocouples were deployed on the inner wall of the compartment and throughout the test setup to characterize the test environment and monitor safety-relevant temperatures. The optical fiber (in Fig. 1) was loosely passed through a protective polymer sheath (diameter: 1 mm) and could freely slide within the sheath. The sheath had a thermal conductivity of 3.0 W/(m·K), which was slightly higher than the thermal conductivity of the concrete, which is typically less than 2.0 W/(m·K) [28]. The sheath was in direct contact with concrete and isolated the optical fiber from the effect of strain in concrete. Thus, the distributed sensor was subjected to temperature change only. It was deployed within the concrete following the path illustrated in Fig. 4. Capital letters A to G designate key locations on the optical fiber. For example, A and G corresponded to the entrance and exit points of the optical fiber with respect to concrete. The optical fiber was firmly attached on a fishing wire every 150 mm using superglue; and the fishing wire was tightly fixed at both ends to the walls of casting mold to keep the fiber straight during casting of the concrete.
Fig. 4.
Test beam specimens (units: mm).
Data from the fuel delivery system and thermocouples were measured continuously using a National Instruments data acquisition system (NI PXIe-1082). Thermocouple data were recorded using 24-Bit Thermocouple Input Modules (NI PXIe-4353). Data were sampled at 90 Hz with average values and standard deviations recorded in the output file at 1 Hz. The manufacturer-specified standard limit of error for the thermocouples is 2.2 °C or 0.75 % (whichever value is greater). This error represents a standard uncertainty of the thermocouple itself and does not account for possible additional sources of uncertainty, such as the data acquisition systems and calibration drifts during use. A Neubrescope® data acquisition system (Model NBX7020) was used to take Brillouin gain spectra from the distributed fiber optic sensors [20]. Using a pulse length of 0.2 ns, 2 cm spatial resolution measurements are obtainable, and the accuracies for strain and temperature measurements were reported to be 15 με and 0.75 °C, respectively, at an average count of 214 [29]. In this study, the measurement distance and the spatial resolution were set at 50 m and 2 cm, respectively, meaning the Brillouin frequency shifts of two points spaced at no less than 2 cm could be distinguished over a 50 m fiber length. The scanning frequency ranged from 10.82 GHz to 11.50 GHz, which approximately corresponded to a target temperature range of 20 °C to 800 °C [22]. The acquisition time varied from 15 seconds to 25 seconds, depending on the scanning frequency range.
3.3. Mix Design and Curing of Concrete
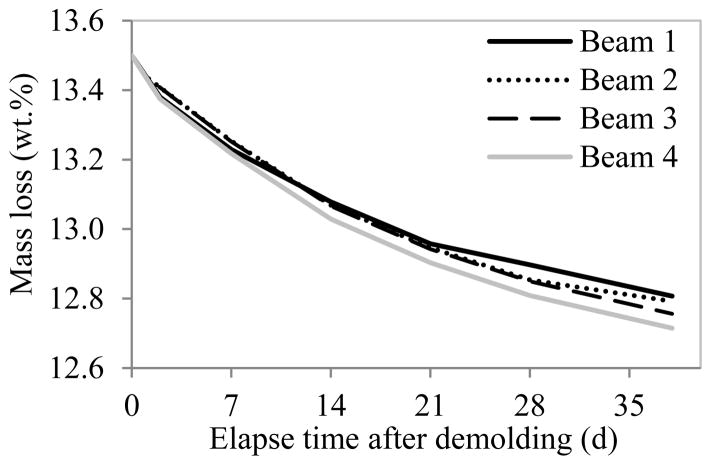
Type III Portland cement, Missouri river sands, and small aggregates (maximum grain size of 5 mm) at 640 kg/m3, 800 kg/m3, and 400 kg/m3, respectively, were used. The water-to-cement ratio was 0.45 by mass. To improve the flowability of self-consolidated concrete, a polycarboxylic acid high-range water reducer was used at a dosage of 1% by volume of the water content. The initial slump flow was measured to be between 280 mm and 290 mm, ensuring that no vibration was required and optical fibers in the specimens would not be disturbed during casting. After concrete casting, the beams were trowel-finished and covered with wet burlap pieces and a plastic sheet for 1 day. The beams were then demolded and air-cured for 36 days prior to testing. In the first 32 days, the beams were cured at a temperature of 25±3 °C and a relative humidity of 40±4 %. In the last four days before testing, the beams were exposed to a less controllable environment (transport and indoor space) where the temperature and humidity were about 30±5 °C and 30±10 %, respectively. The beams were weighed every three days. The mass loss over time was measured and plotted in Fig. 5. The thermal conductivity and the specific heat of the concrete were measured to be 1.8 W/m·K and 1.7 kJ/kg·K, respectively.
Fig. 5.
Moisture content change over time after demolding.
3.4. Fire Test Protocols
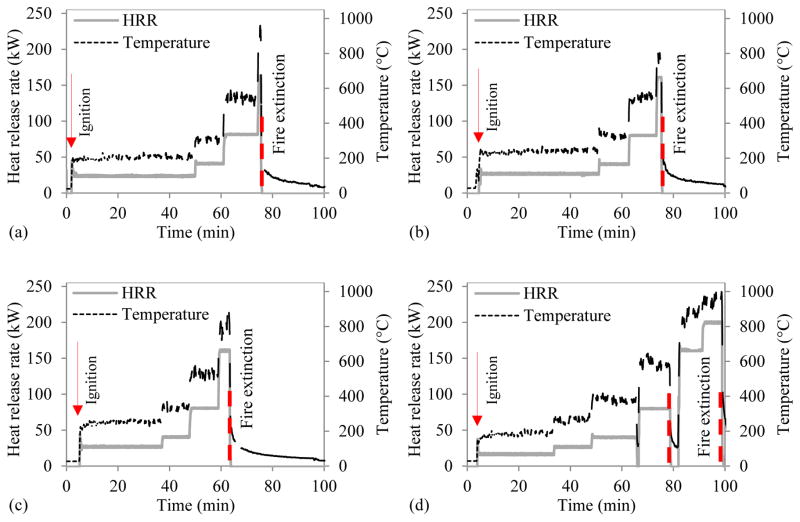
The four concrete beams were exposed to fire at increasing intensities under the control of burner heat release rate (HRR). Fig. 6 shows the test protocols of the four beams. The HRR was held constant at each target level. The durations corresponding to each sustained HRR value for the four beams are listed in Table 1. A relatively longer duration was adopted at the first target level to more slowly heat the test beams, reduce the temperature gradient, and drive off some of the residual moisture near the surface. The intent was to delay spalling of the concrete, which tends to occur with a relatively high (> 10 % by weight) moisture content [30]. Beam 1 and Beam 2 were tested with the same protocol. They were pre-heated at a HRR of 25 kW for 45 minutes, and, then, heated at each elevated HRR for 10 minutes. Beam 3 was heated at 25 kW for 30 minutes, which was 15 minutes less than that of Beam 1 and Beam 2, in order to shorten the test duration. For Beam 1 to Beam 3, fire was extinguished when excessive spalling occurred at a HRR of 160 kW for varioustime duration s. Beam 4 was first heated for 30 minutes at 15 kW, which was 10 kW less than that of the other three beams. The fire was extinguished for 3 minutes between 40 kW and 80 kW to allow visual observation of Beam 4. Then, fire was reignited, and the HRR was increased from 160 kW to 200 kW until excessive spalling occurred.
Fig. 6.
HRR and average compartment air temperature protocols for: (a) Beam 1, (b) Beam 2, (c) Beam 3, and (d) Beam 4.
Table 1.
Durations corresponding to each sustained HRR value for four beams
| HRR (kW) | Duration (minutes)
|
|||
|---|---|---|---|---|
| Beam 1 | Beam 2 | Beam 3 | Beam 4 | |
| 15 | N/A | N/A | N/A | 30 |
| 25 | 45 | 45 | 30 | 15 |
| 40 | 10 | 10 | 10 | 10 |
| 80 | 10 | 10 | 10 | 10 |
| 160 | 1 | 2 | 4 | 10 |
| 200 | N/A | N/A | N/A | 8 |
4. Results and Discussion
4.1. Physical Observations of Concrete Cracking and Spalling
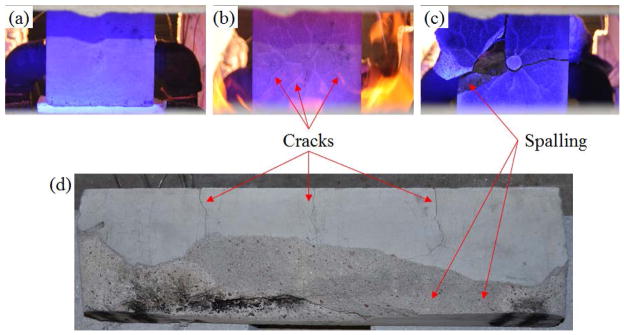
As the temperature in Beam 4 increased, the concrete cracked and spalled as shown in Fig. 7. Surface cracks were observed when the air temperature within the compartment reached about 300 °C. Cracking continued as the temperature increased and at 450 °C spalling occurred at the corners and edges of beam. Sudden fracture through the entire specimen happened shortly after the air temperature reached 800 °C to 1000 °C. Similar damage progressions were observed for each of the other beams. The mechanisms causing cracking and spalling of concrete at elevated temperatures are complicated and involve a series of physicochemical reactions and stresses induced by thermal gradients [31, 32]. It is noted that fracture behavior is governed by the temperature of the beam, not the surrounding air. Moreover, the observed damage sequence was specific to our test member geometry, material properties, conditions at the time of testing (e.g. beam moisture content), and thermal loading protocols applied.
Fig. 7.
End and side views of Beam 4: (a) prior to ignition, (b) when engulfed in fire, (c) at the moment of fire extinction, and (d) when cooled down to room temperature (a–c illuminated with blue light to improve visualization of cracking).
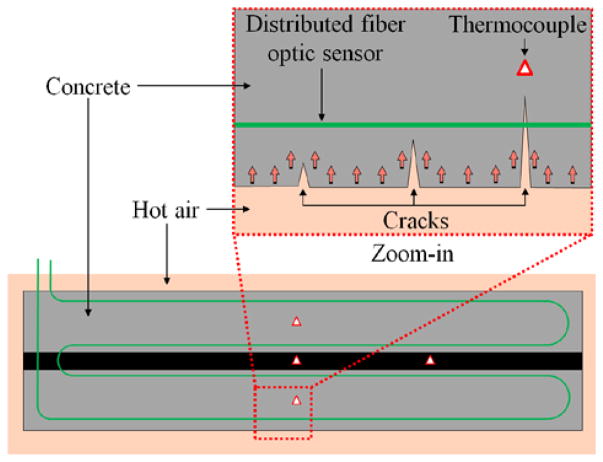
Concrete cracking and spalling affect the heat transfer behavior of the beam as illustrated in Fig. 8. Before cracks appear, the temperature of internal concrete increases mainly due to thermal conduction. Due to the low thermal conductivity of concrete, the temperature of the concrete away from the surface increases slowly. Once cracks appear, they can be filled with hot air. The internal concrete is then subjected to thermal radiation and convection along the crack, in addition to thermal conduction through the concrete cover. Therefore, the temperatures in the vicinity of cracks can increase more rapidly. Since the spatially-distributed sensors have greater chances to cross the cracks than discrete thermocouple beads, they are a potential method to monitor cracking within concrete.
Fig. 8.
Heat transfer after concrete cracking.
4.2. Temperature Histories
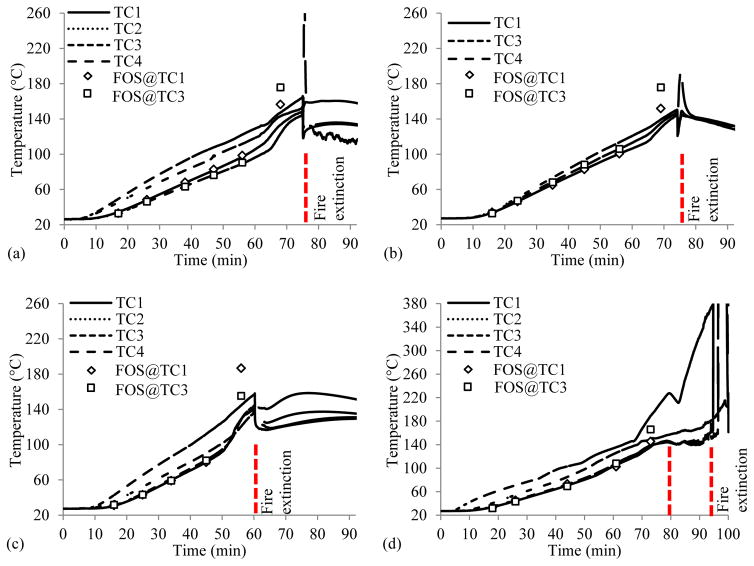
When the beams were subjected to fire, the temperature within the concrete gradually increased. At each HRR, the spatially-distributed Brillouin frequencies along the length of fiber optic sensor were measured and converted to temperatures using the calibration curve in Fig. 2(b). Figs. 9(a)–9(d) show the temperature time histories in Beam 1 to Beam 4, respectively. The measurement results from the thermocouples and distributed fiber optic sensors were compared.
Fig. 9.
Temperatures histories of: (a) Beam 1, (b) Beam 2, (c) Beam 3, and (d) Beam 4. “TCn” and “FOS@TCn” indicate the measurements from the nth thermocouple and a distributed sensor at the location of the nth thermocouple.
As expected, temperatures were typically highest at the bottom, mid-span of the beam (TC2) and lowest at the center of the beam (TC1 and TC3). At a HRR of 25 kW and 40 kW for Beam 1 to Beam 3 and at 15 kW to 40 kW for Beam 4, temperatures within the concrete increased almost linearly with time and the maximum discrepancy between the measurements from the thermocouples and fiber optic sensors was 8.8 %. However, at a HRR of 80 kW for Beam 1 to Beam 4, temperatures increased at higher rates over time and the discrepancies between the measurements were increased up to 53.7 %. As discussed in the next section, these larger discrepancies are believed to be due to the influence of concrete cracking or spalling on the heat transfer. Indeed, the spikes in the thermocouple measurements immediately prior to fire extinction were due to exposure of the thermocouple beads to heated air after spalling.
4.3. Temperature Distributions
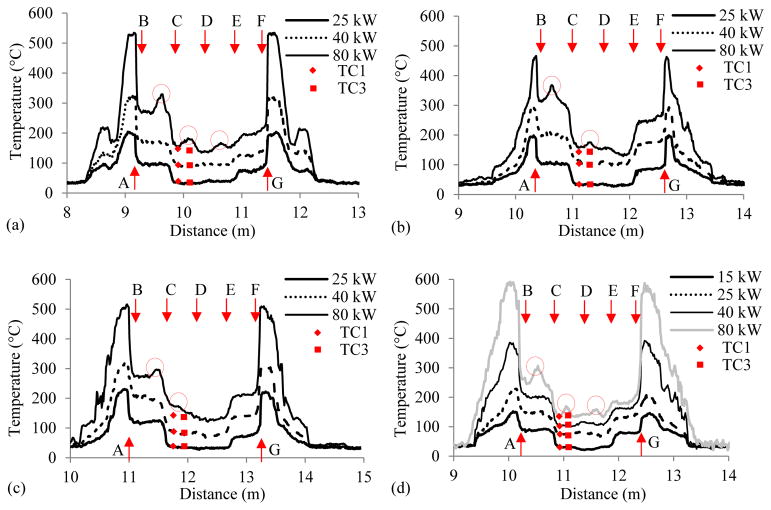
Figs. 10(a)–10(d) present temperature distributions in the four beams, measured from the distributed fiber optic sensors. The horizontal axis represents the distance along the distributed fiber optic sensor, starting from the pump end of the Neubrescope. The vertical axis represents temperature. The location of the distributed fiber optic sensor within the test beam was marked using capital letters from A to G (refer to Fig. 4). The length between A and G was embedded within concrete. The other portions of the fiber were exposed to air, and, in particular, the part of the fiber length within the compartment was subjected to heated air. As indicated in Fig. 10, air temperatures up to 600 °C were measured by the distributed fiber optic sensors. However, as the distance from the compartment increased, the temperature dropped to room temperature. While the air temperatures measured by the fiber optic sensors generally agree with the compartment thermocouple measurements (comparison between Fig. 6 and Fig. 10), a direct comparison is not made since the sensors were not co-located inside the compartment.
Fig. 10.
Temperature distributions in: (a) Beam 1, (b) Beam 2,(c) Beam 3, and (d) Beam 4.
The optical fibers between points A and G measured the temperature distributions within the concrete beams. Non-uniform temperature distributions are demonstrated in Fig. 10. Overall, temperatures between B and C and between E and F are higher than those between C and E. This is because fiber sections B–C and E–F were closer to the exterior surfaces of the beam than C–E. Furthermore, temperatures between B and C are higher than those between E and F. This is because the bottom surface was closer to fire and had a higher temperature than the top surface, and B–C and E–F were respectively close to the bottom and top surfaces of the beams.
When the air temperature was below 400 °C corresponding to a HRR of below 40 kW, temperatures over B–C, C–D, D–E, and E–F sections were approximately constant in the four beams. However, when the air temperature exceeded 400 °C, peaks appeared as indicated by the dashed circles in Fig. 10. For instance, as shown in Fig. 10(a), the temperature at the middle of C–D was higher than that at C or D at a HRR of 80 kW. Additionally, the thermal gradients of C–D and D–E were approximately the same and symmetrical to D. This behavior is believed to be due to cracking in the concrete.
4.4. Effects of Concrete Cracking and Spalling on the Performance of Distributed Sensors
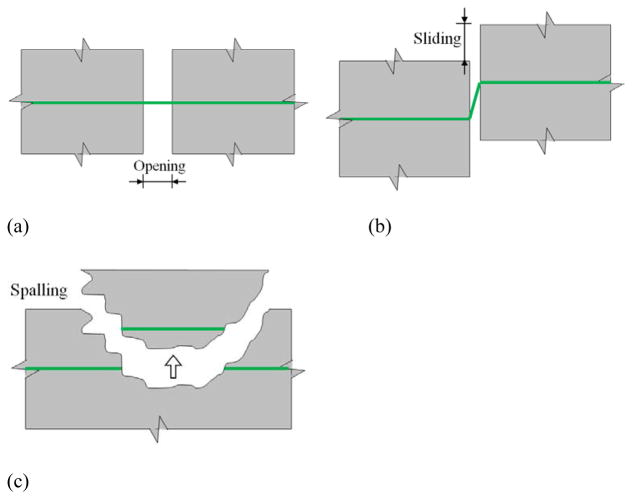
Concrete cracking and spalling may break the distributed fiber optic sensor in two mechanisms, as respectively illustrated in Figs. 11(a) and 11(b): opening (Mode I) and sliding (Mode II). Crack opening in concrete influenced the heat transfer behavior but had no effect on sensor function as evidenced from the test results since there was no bond between the optical fiber and its protective sheath. However, sliding can be detrimental to the distributed sensor by bending the optical fiber into an acute angle, which results in a significant signal loss and thus a reduction of signal-to-noise ratio. Fibers in a section of spalling concrete were sheared off as illustrated in Fig. 11(c). Once broken, the distributed sensor with PPP-BOTDA measurements was no longer functional. However, BOTDR measurements can still be taken from one end of the optical fiber to determine the location of the spalling [19].
Fig. 11.
Fiber optic sensor behavior under: (a) crack opening (mode I), (b) crack sliding (mode II), and (c) spalling.
5. Conclusions
Based on the test results and numerical analysis, the following conclusions can be drawn:
A fused silica, single-mode optical fiber with PPP-BOTDA was used to measure spatially-distributed internal temperature of concrete exposed to fire. This new approach in structural-fire applications is advantageous over conventional thermocouples and grating-type fiber optic sensors since it can provide a dense array of temperature data (every 2 cm along the fiber) at a low sensor cost (about $0.02 to $0.08 per meter of fiber). The availability of dense data allows for enhanced visualization and understanding of the concrete behavior.
The distributed fiber optic sensor survived from crack opening as observed in all tests. At the moment of concrete spalling, the sensor was broken and the PPP-BOTDA measurements based on the optical fiber loop were no longer available. However, BOTDR can still be used to detect the location of concrete spalling from one end of the broken fiber.
Non-uniform temperature distributions were observed in all tested beams. Cracks in concrete were identified at sharp peaks of the measured temperature distribution since the cracks were filled with hot air, thus accelerating the local heat transfer from the surface to inside of the concrete beams. Prior to concrete cracking, the internal temperatures measured with the fiber optic sensor are in good agreement with those of the bare-bead thermocouples by a relative difference of less than 9 % at 95 % confidence. When concrete cracks appeared, this difference increased because the thermocouples were not able to measure the local temperature changes as the fiber optic sensors captured.
Continued development and application of the approach is needed to quantify the uncertainty of measurements under diverse conditions, to investigate the feasibility of crack width determination from measured temperature gradients, and to effectively separate temperature and stain effects on the Brillouin frequency shift for situations where strain measurements are desired.
Highlights.
Distributed fiber optic sensors are applied in concrete beams exposed to fire.
Non-uniform temperature distributions are measured with PPP-BOTDA.
Concrete cracks are localized using detailed temperature distributions.
Fiber optic sensors remain functional until excessive concrete spalling occurs.
Acknowledgments
This work was funded by the NIST [grant number 70NANB13H183]. The contents of this paper reflect the views of the authors only, and do not necessarily reflect the official views or policies of the NIST. Certain commercial equipment, products, instruments, or materials are identified in this paper to specify the experimental procedure. Such identification is not intended to imply recommendation or endorsement by the NIST nor to imply the products, materials, or equipment are necessarily the best available for the purposes.
Abbreviations
- FBG
Fiber Bragg gratings
- BOTDR
Brillouin optical time domain reflectometry
- BOTDA
Brillouin optical time domain analysis
- PPP-BOTDA
Pulse pre-pump BOTDA
References
- 1.Kodur V, Sultan MA. Effect of temperature on thermal properties of high-strength concrete. J Mater Civil Eng. 2003;15(2):101–107. [Google Scholar]
- 2.Kodur V, Dwaikat M, Raut N. Macroscopic FE model for tracing the fire response of reinforced concrete structures. Engineering Structures. 2009;31(10):2368–2379. [Google Scholar]
- 3.Usmani A, Rotter JM, Lamont S, Gillie M. Fundamental principles of structural behavior under thermal effects. Fire Safety J. 2001;36(8):721–744. [Google Scholar]
- 4.Jeffers AE, Sotelino ED. An efficient fiber element approach for the thermo-structural simulation of non-uniformly heated frames. Fire Safety J. 2012;51:18–26. [Google Scholar]
- 5.Smalcerz A, Przylucki R. Impact of electromagnetic field upon temperature measurement of induction heated charges. Int J Thermophys. 2013;34(4):667–679. [Google Scholar]
- 6.Wei T, Han Y, Tsai H, Xiao H. Miniaturized fiber inline Fabry-Perot interferometer fabricated with a femtosecond laser. Optics Lett. 2008;33:536–538. doi: 10.1364/ol.33.000536. [DOI] [PubMed] [Google Scholar]
- 7.Zhu T, Ke T, Rao YJ, Chiang KS. Fabry-Perot optical fiber tip sensor for high temperature measurement. Opt Commun. 2010;283:3683. [Google Scholar]
- 8.Jiang L, Yang J, Wang S, Li B, Wang M. Fiber Mach-Zehnder interferometer based on microcavities for high-temperature sensing with high sensitivity. Optics Lett. 2011;36(19):3753–3755. doi: 10.1364/OL.36.003753. [DOI] [PubMed] [Google Scholar]
- 9.Lönnermark A, Hedekvist PO, Ingason H. Gas temperature measurements using fibre Bragg grating during fire experiments in a tunnel. Fire Saf J. 2008;43:119–126. [Google Scholar]
- 10.Bueno A, Torres B, Barrera D, Calderón PA, Lloris M, López MJ, Sales S. Optical fiber sensors embedded in concrete for measurement of temperature in a real fire test. Opt Eng. 2011;50:124404. [Google Scholar]
- 11.Venugopalan T, Sun T, Grattan KTV. Temperature characterization of long period gratings written in three different types of optical fibre for potential high temperature measurements. Sens Actuator A: Phys. 2010;160:29–34. [Google Scholar]
- 12.Brambilla G. High-temperature fibre Bragg grating thermometer. Electron Lett. 2002;38:954–955. [Google Scholar]
- 13.Rinaudo P, Torres B, Paya-Zaforteza I, Calderón PA, Sales S. Evaluation of new regenerated fiber Bragg grating high-temperature sensors in an ISO834 fire test. Fire Safety J. 2015;71:332–339. [Google Scholar]
- 14.Crunelle C, Wuilpart M, Caucheteur C, Mégret P. Original interrogation system for quasi-distributed FBG-based temperature sensor with fast demodulation technique. Sens Actuator A: Phys. 2009;150:192–198. [Google Scholar]
- 15.Tanner MG, Dyer SD, Baek B, Hadfield RH, Nam SW. High-resolution single-mode fiber-optic distributed Raman sensor for absolute temperature measurement using superconducting nanowire single-photon detectors. Appl Phys Lett. 2011;99(20):201110. [Google Scholar]
- 16.Bao X, Chen L. Recent progress in distributed fiber optic sensors. Sens. 2012;12:8601–8639. doi: 10.3390/s120708601. [DOI] [PMC free article] [PubMed] [Google Scholar]
- 17.Fellay A. PhD dissertation. Swiss Federal Institute of Technology Lausanne; Swiss: 2003. Extreme temperature sensing using Brillouin scattering in optical fibers. [Google Scholar]
- 18.Wang J. Distributed pressure and temperature sensing based on stimulated Brillouin scattering, Master Thesis. Virginia Polytechnic Institute and State University; USA: 2013. [Google Scholar]
- 19.Bao X, Chen L. Recent progress in Brillouin scattering based fiber sensors. Sens. 2011;11:4152–4187. doi: 10.3390/s110404152. [DOI] [PMC free article] [PubMed] [Google Scholar]
- 20.Kishida K, Li CH. Pulse pre-pump-BOTDA technology for new generation of distributed strain measuring system. Proc of Structural Health Monitoring and Intelligent Infrastructure Conference; 2006. [Google Scholar]
- 21.Bao Y, Meng W, Chen Y, Chen G, Khayat KH. Measuring mortar shrinkage and cracking by pulse pre-pump Brillouin optical time domain analysis with a single optical fiber. Material Lett. 2015;145:344–346. [Google Scholar]
- 22.Bao Y, Chen G. Proc Int Workshop Struct Health Monit. Vol. 2015 Stanford University; CA: 2015. Fully-distributed fiber optic sensor for strain measurement at high temperature. [Google Scholar]
- 23.Bao Y, Chen G. Strain distribution and crack detection in thin unbonded concrete pavement overlays with fully distributed fiber optic sensors. Opt Eng. 2016;55(1):011008. [Google Scholar]
- 24.Bao Y, Chen G. Temperature-dependent strain and temperature sensitivities of fused silica single mode fiber sensors with pulse pre-pump Brillouin optical time domain analysis. Mes Sci Tech. 2016;27(6):65101–65111. [Google Scholar]
- 25.Bao Y, Chen Y, Hoehler MS, Smith CM, Bundy M, Chen G. Experimental analysis of steel beams subjected to fire conditions enhanced by Brillouin scattering based fiber optic sensor data. ASCE J Struct Eng. 2016:04016143. doi: 10.1061/(ASCE)ST.1943-541X.0001617. [DOI] [PMC free article] [PubMed] [Google Scholar]
- 26.Bao Y, Chen G. High temperature measurement with Brillouin optical time domain analysis. Optics Letters. 2016;41(14):3177–3180. doi: 10.1364/OL.41.003177. [DOI] [PubMed] [Google Scholar]
- 27.Bundy M, Hamins A, Johnsson EL, Kim SC, Ko GH, Lenhert DB. Measurements of heat and combustion products in reduced-scale ventilation-limited compartment fires. NIST Technical Note 1483. 2007 [Google Scholar]
- 28.ECS. EN 1992-1-2. European Committee for Standardization; 2004. Eurocode 2: Design of Concrete Structures - Part 1–2: General Rules - Structural Fire Design. [Google Scholar]
- 29.Neubrex Co. Ltd. User’s manual of Neubrescope NBX-7020. Jul, 2013. [Google Scholar]
- 30.Kodur V, Dwaikat M. Effect of fire induced spalling on the response of reinforced concrete beams. Int J Concr Struct Mater. 2008;2(2):71–82. [Google Scholar]
- 31.Debicki G, Haniche R, Delhomme F. An experimental method for assessing the spalling sensitivity of concrete mixture submitted to high temperature. Cem Concr Compos. 2012;34:958–963. [Google Scholar]
- 32.Zhao J, Zheng J, Peng G, Breugel K. A meso-level investigation into the explosive spalling mechanism of high-performance concrete under fire exposure. Cem Concr Res. 2014;65:64–75. [Google Scholar]


