

Abstract
CAT‐2003 is a novel conjugate of eicosapentaenoic acid (EPA) and niacin designed to be hydrolyzed by fatty acid amide hydrolase to release EPA inside cells at the endoplasmic reticulum. In cultured liver cells, CAT‐2003 blocked the maturation of sterol regulatory element‐binding protein (SREBP)‐1 and SREBP‐2 proteins and decreased the expression of multiple SREBP target genes, including HMGCR and PCSK9. Consistent with proprotein convertase subtilisin/kexin type 9 (PCSK9) reduction, both low‐density lipoprotein receptor protein at the cell surface and low‐density lipoprotein particle uptake were increased. In apolipoprotein E*3‐Leiden mice fed a cholesterol‐containing western diet, CAT‐2003 decreased hepatic inflammation and steatosis as evidenced by fewer inflammatory cell aggregates in histopathologic sections, decreased nuclear factor kappa B activity in liver lysates, reduced inflammatory gene expression, reduced intrahepatic cholesteryl ester and triglyceride levels, and decreased liver mass. Plasma PCSK9 was reduced and hepatic low‐density lipoprotein receptor protein expression was increased; plasma cholesterol and triglyceride levels were lowered. Aortic root segments showed reduction of several atherosclerotic markers, including lesion size, number, and severity. CAT‐2003, when dosed in combination with atorvastatin, further lowered plasma cholesterol levels and decreased hepatic expression of SREBP target genes. Conclusion: SREBP inhibition is a promising new strategy for the prevention and treatment of diseases associated with abnormal lipid metabolism, such as atherosclerosis and nonalcoholic steatohepatitis. (Hepatology Communications 2017;1:311–325)
Abbreviations
- APOE
apolipoprotein E
- AUC
area under the curve
- EPA
eicosapentaenoic acid
- ER
endoplasmic reticulum
- FAAH
fatty acid amide hydrolase
- GPR109A
G‐protein coupled receptor 109A
- HDL
high‐density lipoprotein
- HDL‐C
high‐density lipoprotein cholesterol
- Insig‐1
insulin induced gene 1
- LDL
low‐density lipoprotein
- LDL‐C
low‐density lipoprotein cholesterol
- LDLR
low‐density lipoprotein receptor
- LPS
lipopolysaccharide
- mRNA
messenger RNA
- NASH
nonalcoholic steatohepatitis
- NF‐κB
nuclear factor kappa B
- PCSK9
proprotein convertase subtilisin/kexin type 9
- PNPLA3
patatin‐like phospholipase domain containing 3
- SCAP
SREBP cleavage‐activating protein
- SREBP
sterol regulatory element‐binding protein
- VLDL
very low‐density lipoprotein
- WTD+C
western diet plus cholesterol
Introduction
CAT‐2003 is a novel conjugate of eicosapentaenoic acid (EPA) and niacin that is cleaved intracellularly into its active components through the activity of fatty acid amide hydrolase (FAAH), an endoplasmic reticulum (ER)‐resident enzyme responsible for the catabolism of several bioactive fatty acid amides.1, 2 The requirement for intracellular enzymatic cleavage ensures the codelivery of both EPA and niacin moieties into the cell. Cleavage of CAT‐2003 by FAAH has been demonstrated by using liver homogenates with and without a selective FAAH inhibitor and with a recombinant FAAH enzyme.2
Omega‐3 fatty acids, such as EPA and docosahexaenoic acid, inhibit sterol regulatory element‐binding protein‐1 (SREBP‐1).3, 4, 5 They also reduce inflammation through inhibition of nuclear factor kappa B (NF‐κB) activity.6 CAT‐2003 inhibits SREBP better than EPA alone in cell‐culture experiments.2 SREBP consists of three isoforms, SREBP‐1a, SREBP‐1c, and SREBP‐2, that regulate intracellular cholesterol and lipid levels by promoting the transcription of genes required for their synthesis.7 SREBP is synthesized as a transcriptionally inactive precursor molecule that is retained in the ER through its interaction with SREBP cleavage‐activating protein (SCAP) and insulin‐induced gene (Insig) proteins.8 Under cholesterol‐limiting conditions, SREBP is transported to the Golgi where the mature N‐terminal domain is released to enter the nucleus and promote the transcription of genes involved with cholesterol and fatty acid synthesis.9, 10 SREBP also regulates genes involved with cholesterol transport and clearance, including LDLR and PCSK9.11 Low‐density lipoprotein receptor (LDLR) regulates plasma LDL cholesterol (LDL‐C) levels by internalizing LDL particles, whereas secreted proprotein convertase subtilisin/kexin type 9 (PCSK9) binds to LDLR at the cell surface to promote its internalization and degradation.12 Niacin is actively transported into HepG2 cells and primary hepatocytes13 and may enhance delivery of EPA to the liver.
Niacin favorably impacts serum lipoproteins, increasing high‐density lipoprotein (HDL)‐C while decreasing LDL‐C and triglycerides.14 It also causes subcutaneous skin flushing, and the degree to which these activities are separable is controversial. Flushing is the result of extracellular niacin binding to G‐protein coupled receptor 109A (GPR109A) on islet of Langerhans cells,15 whereas niacin binding to GPR109A in adipose tissue inhibits lipolysis and blocks the release of free fatty acids. This deprives the liver of substrate for the generation of triglycerides and is thought to be a major contributor to niacin's effects on lipid lowering. Indeed, one study showed that niacin failed to lower both free fatty acid and triglyceride levels in GPR109A knockout mice.16 However, GPR109A‐independent effects of niacin have also been reported, including enhanced degradation of de novo apolipoprotein B protein in the liver, which is required for liver very low‐density lipoprotein (VLDL) secretion,17 and decreased diglyceride acyltransferase activity.18 Another study in GPR109A‐deficient mice found that niacin decreased LDL‐C and triglycerides despite a lack of effect on adipose tissue.19 CAT‐2003 neither activated GPR109A in a human epidermal cell line2 nor promoted skin flushing in a phase 1 study.20 Thus, the niacin moiety of CAT‐2003, in addition to facilitating liver uptake, would exert only GPR109A‐independent effects on lipid lowering.
The APOE*3‐Leiden mouse is a well‐established model for the study of cardiovascular and metabolic diseases.21 These mice express the dominantly inherited APOE*3‐Leiden mutation as a trans gene as well as human APOC1. The primary effect of the APOE*3 mutation is impaired clearance of triglyceride‐rich lipoproteins due to decreased affinity for LDLR, while lipolysis is inhibited due to overexpression of APOC1. Impaired clearance leads to high LDL‐C levels and a more human‐like fast protein liquid chromatography cholesterol profile.22 These animals, when fed a high‐fat and high‐cholesterol Western diet (WTD+C) for 16 weeks, develop dyslipidemic disease burden, including atherosclerotic lesions in the aortic root, fatty liver, and inflammation. The inflammation induced by increased hepatic triglyceride and cholesterol may help promote the morbidity of hypercholesterolemia and hepatic steatosis. This model therefore has important implications for studying and understanding fatty liver‐related diseases, such as nonalcoholic steatohepatitis (NASH), even though the animals do not develop the pronounced fibrosis associated with NASH.
Materials and Methods
CELL CULTURE AND REAGENTS
HepG2 (HB‐8065) cell lines were obtained from ATCC. RAW264 and 7‐3X NF‐κB cells have been reported.2 Cells were maintained in Dulbecco's modified Eagle's medium (11965; Invitrogen) supplemented with 10% fetal bovine serum (10437; Invitrogen). The LANCE Ultra cAMP kit was obtained from Perkin Elmer (TRF0262). Bovine serum albumin was obtained from Sigma (A7030). AlamarBlue was obtained from Invitrogen (DAL1100). Atorvastatin was obtained from Sigma.
WESTERN BLOT ANALYSIS
For HuH‐7 cell experiments, whole‐cell lysates were prepared and subjected to immunoblot analyses of SREBP‐1 and SREBP‐2 as described.23 For HepG2 experiments, cells were lysed in radio immunoprecipitation assay buffer with protease and phosphatase inhibitors. Densitometry was performed relative to actin in matched lanes. Goat anti‐human SREBP‐2 antibody was from R&D Systems (AF7119). LDLR antibody was from BioVision (3839‐100). Beta‐actin antibody was from Abcam (Ab8226). Secondary antibodies were from Li‐Cor.
ENZYME‐LINKED IMMUNOBSORBANT ASSAYS
HepG2 cells were treated in triplicate with the indicated concentrations of EPA, niacin, the combination of EPA + niacin, or CAT‐2003, and secreted PCSK9 was measured in the supernatant 6 hours or 16 hours later using commercially available enzyme‐linked immunosorbent assay kits (DPC900; R&D Systems). Plasma levels of E‐selectin (R&D Systems), PCSK9 (CY‐8079; Circulex), serum amyloid A (Biosource), and soluble vascular cell adhesion molecule 1 (R&D Systems) were determined by enzyme‐linked immunosorbent assay.24, 25
RNA ISOLATION AND SEMIQUANTITATIVE REVERSE‐TRANSCRIPTION POLYMERASE CHAIN REACTION
Total RNA was collected using RNeasy Plus Mini kit (74136; Qiagen) and complementary DNA generated using SuperScriptIII (18080‐044; Invitrogen) with random hexamers following the manufacturer's protocol. Relative messenger RNA (mRNA) expression levels were determined using TaqMan probes (Applied Biosystems, using recommended best primer pairs) with HPRT as the internal control.
NF‐κB REPORTER ASSAY
RAW264.7‐3X NF‐κB cells were treated with compound for 2 hours. Lipopolysaccharide (LPS; final concentration 250 ng/mL) and AlamarBlue viability reagent were then added, and cells were incubated for an additional 3 hours. Cell viability was determined by measuring the AlamarBlue fluorescence (excitation = 550 nm, emission = 590 nm) on the Victor 5 plate reader. To assess NF‐κB reporter activity, the supernatant was removed from the cells from each well and Bright Lite Plus luciferase reagent (6066761; Perkin Elmer) was added to each well. The luciferase signal was measured in counts per second on the Victor 5 plate reader.
p65 DNA BINDING ASSAY
NF‐κB activity was assessed by measuring p65 activity in liver homogenates. Whole‐cell lysates were prepared, and total protein concentrations were measured using a bicinchoninic acid protein assay (Thermo Scientific Pierce). NF‐κB activity was measured using an NF‐κB p65 Transcription Factor kit (Thermo Scientific Pierce). Equal volumes of whole‐cell lysates were loaded, and results were then normalized to the amount of protein loaded as determined by the bicinchoninic acid assay.
HYDROXYPROLINE ASSAY
Paraffin‐embedded liver tissues were subjected to acid hydrolysis for 20 hours at 95°C. Hydroxyproline was measured in the hydrolysate using a total collagen assay relative to a collagen standard per the manufacturer's instructions (Quickzyme, Leiden, the Netherlands).
LDL UPTAKE AND CELL‐SURFACE LDLR IMAGING
The LDL uptake assay was performed according to the manufacturer's protocol. Briefly, culture medium was replaced with LDL‐Dylight 550 working solution and incubated at 37°C for 4 hours, washed once with phosphate‐buffered saline, and then LDL uptake was determined under the microscope by measuring excitation and emission wavelengths of 540 and 570 nm, respectively. Following the LDL uptake measurement, cells were fixed but not permeabilized to ascertain cell‐surface LDLR expression, using rabbit anti‐LDL receptor primary and Dylight 488‐conjugated secondary antibodies. The slides were mounted with Antifade with 4',6‐diamidino‐2‐phenylindole. Cell staining was examined using a Zeiss LSM 510 confocal microscope with a 25× objective lens. Images were collected with five slices of Z‐stack (2‐μm interval), and three such image stacks were collected from each slide chamber. The quantitative data of LDL uptake and LDLR staining were analyzed using ImageJ.
ANIMAL STUDIES
All animal studies conformed to the rules and regulations set forward by the Netherlands Law on Animal Experiments and were approved by the Committee on Animal Experiments (approval number 3138). APOE*3‐Leiden mice were generated using a cosmid vector containing APOE*3‐Leiden and APOC1 genes, and the region between the APOC1 and APOC1 pseudogene, injected into fertilized eggs of (C57Bl/6J × CBA/J)F1 mice. The transgenic strain was established by breeding founder mice with C57Bl/6J mice.22 The WTD+C diet consisted of 40.5% sucrose, 20% casein, 15% cocoa butter, 10% corn starch, 5.45% cellulose, 5.1% mineral mixture, 1% choline chloride, 1% corn oil, 0.2% methionine, and 1% cholesterol, supplemented or not with 0.75% (weight/weight) CAT‐2003. All diets received 30 mg/kg alpha tocopherol to prevent potential oxidation of CAT‐2003. In a separate study with male C57BL/6 mice fed the same diet for 7 days, significant exposure levels of CAT‐2003, as determined by its linker‐niacin metabolite, were measured in both plasma (area under the curve [AUC]last 32,414 ± 1,680 hour × ng/mL) and liver (AUClast 46,247 ± 3,387 hour × ng/mL). For the atherosclerotic endpoint study, female APOE*3‐Leiden mice were matched in groups (n = 16) based on plasma cholesterol levels after a 4‐week run‐in period on the WTD+C diet. The study continued for 16 weeks with animals on control WTD+C or 0.75% CAT‐2003 diets, with plasma taken at weeks 0, 2, 4, 12, and 16 before sacrificing for end of study atherosclerosis and liver histology measurements. For the atorvastatin study, female APOE*3‐Leiden mice were treated similarly except that after the 4‐week WTD+C run‐in period, animals were switched to WTD+C diets containing atorvastatin (dosed as a diet admixture that has historically produced plasma levels equivalent to a 20‐mg/kg dose), 0.75% CAT‐2003, or the combination of atorvastatin and CAT‐2003 (n = 10). Animals were killed and livers flash frozen for mRNA and protein analysis after 4 weeks of dosing.
PLASMA MEASUREMENTS
Triglycerides were measured using either Cayman Chemicals (10010303) or Roche Diagnostics (11488872) kits. Cholesterol was measured using Abcam (ab65390) or Roche Diagnostics (11489437) kits. Lipoprotein profiles were determined in pooled plasma, fractionated using an ÅKTA fast protein liquid chromatography system (Pharmacia, Roosendaal, the Netherlands), and analysed as reported.26
ATHEROSCLEROTIC ENDPOINT MEASUREMENTS
Serial cross‐sections (5 μm thick) were taken throughout the entire aortic root area for histological analysis of atherosclerosis as described.27 Briefly, paraffin‐embedded aortic cross‐sections were stained with hematoxylin‐phloxine‐saffron, and the atherosclerotic lesion area was analyzed blindly in four cross‐sections of each specimen (at intervals of 50 μm). Cell‐D software (Olympus Soft Imagine Solutions GmbH) was used for morphometric computer‐assisted quantification of lesion number, lesion area, and lesion severity according to the classification of the American Heart Association.25
LIVER HISTOPATHOLOGY
Liver pathology was evaluated as described.28 Briefly, NASH development was assessed in hematoxylin and eosin‐stained liver sections (3 μM) by analysis of steatosis and inflammation, the two key features of NASH. Steatosis was determined at a 40× magnification by analysis of macrovesicular and microvesicular steatosis and hepatocellular hypertrophy (hepatocyte size > 1.5 × normal diameter), expressed as the percent of the total liver slice area affected (considering only the area of the slice occupied by hepatocytes). Hepatic inflammation was analyzed by counting the number of inflammatory foci per field at a 100× magnification (view size 3.1 mm2) in five different fields per specimen and was expressed as the average number of foci per field. Liver sections were also assessed for collagen by Sirius‐Red staining and macrophage content using rat anti‐mouse monoclonal F4/80, clone BM8 from Thermo Fisher/eBioscience (14‐4801‐81).
STATISTICAL ANALYSIS
For parameters with multiple measurements (plasma cholesterol and triglycerides), two‐way analysis of variance was used with the factors time and treatment. For in vitro studies and atherosclerosis endpoint values, group comparison P values were determined using the Student t test. Data sets that were not normally distributed (Shapiro‐Wilk test) were tested with the nonparametric Mann‐Whitney U test. Unless stated otherwise, data are shown as means ± SEM. P < 0.05 was considered significant using the following scale: *P < 0.05, **P < 0.01, ***P < 0.001, ****P < 0.0001.
Results
CAT‐2003 INHIBITS SREBP MATURATION AND DECREASES SREBP‐MEDIATED GENE EXPRESSION
We tested CAT‐2003 for effects on SREBP processing in HuH‐7 cells (Fig. 1). We found that processing of both SREBP‐1 and SREBP‐2 to its mature nuclear form was rapidly inhibited by 50 μM CAT‐2003 (Fig. 1A). An equal concentration of arachidonic acid blocked the processing of SREBP‐1 without affecting SREBP‐2, consistent with previous findings.4, 5 The inhibition of SREBP‐1 and SREBP‐2 by CAT‐2003 was greater than that of 1 μg/mL 25‐hydroxycholesterol, which potently inhibits SREBP processing by trapping SCAP in the ER (Fig. 1A).29 Consistent with these data, CAT‐2003 decreased the expression of multiple SREBP target genes in a dose‐dependent manner (Fig. 1B). Relative expressions of archetypal SREBP target genes PCSK9, HMGCR, and LDLR are shown in Fig. 1B. However, similar results were obtained for other SREBP target genes, including FASN, SCD1, PNPLA3, ACC2, INSIG1, SREBPF1, and SREBPF2 (data not shown).
Figure 1.
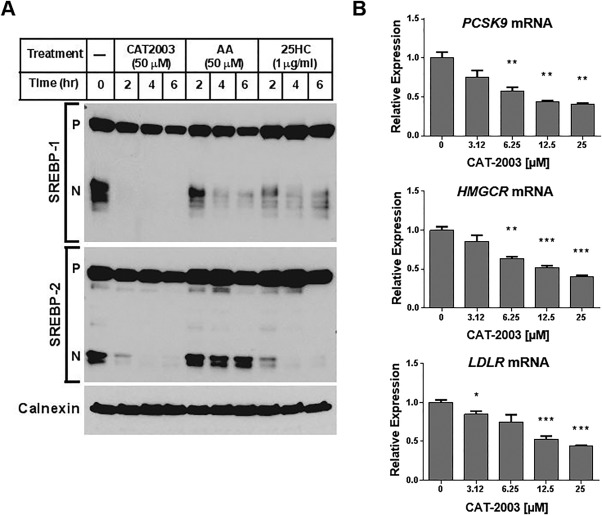
CAT‐2003 inhibits SREBP‐1 and SREBP‐2 protein processing and SREBP target gene expression. (A) HuH‐7 cells were grown in medium containing 5% delipidated serum overnight and then treated with 50 μM CAT‐2003, 50 μM AA, or 1 μg/mL 25HC for 2, 4, or 6 hours; SREBP protein expression was assessed by western blot. The precursor and nuclear forms of SREBP are denoted as P and N, respectively. Calnexin protein was used as the loading control. (B) HepG2 cells were treated with CAT‐2003 overnight at the indicated concentrations, and mRNA levels of PCSK9, HMGCR, and LDLR were determined by real‐time reverse‐transcription polymerase chain reaction. Significance was determined using the Student t test. Values are expressed as mean ± SEM (n = 3). Abbreviations: 25HC, 25‐hydroxy‐cholesterol; AA, arachidonic acid. *p < 0.05, **p < 0.01, ***p < 0.001, ****p < 0.0001.
CAT‐2003 INCREASES LDLR PROTEIN EXPRESSION
The inhibition of LDLR and PCSK9 mRNAs promote opposing forces on LDLR protein expression, concomitantly decreasing its synthesis while increasing its stability. We therefore tested for the effect of CAT‐2003 on LDLR protein expression in HepG2 cells. We found that LDLR protein expression was increased in a dose‐dependent manner by CAT‐2003 treatment, while the combination of niacin and EPA had no effect (Fig. 2A). The increase in LDLR expression was more pronounced for the nascent low molecular weight form of the protein than it was for the mature glycosylated form. CAT‐2003 decreased secreted PCSK9 protein levels, while the combination of niacin and EPA had no effect (Fig. 2B). To confirm that LDLR is increased at the cell surface, we determined cell‐surface LDLR expression and the ability to internalize labeled LDL particles in CAT‐2003‐treated HepG2 cells by confocal microscopy. LDLR protein expression was determined in fixed but nonpermeabilized cells. We found that CAT‐2003 increased cell surface LDLR protein expression and incorporation of labeled LDL particles by ∼20% (Fig. 2C). HepG2 cells tend to grow as clumps, and it is sometimes hard to determine cellular architecture. 4',6‐diamidino‐2‐phenylindole costained and z‐stack images underscore that the observed LDLR staining was predominantly localized to the cell surface (Supporting Fig. S1).
Figure 2.
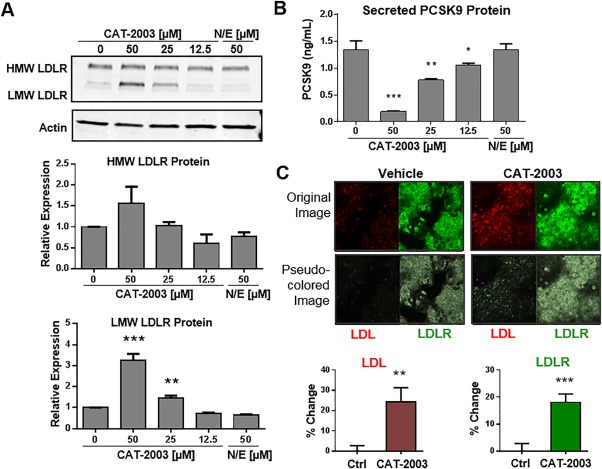
CAT‐2003 increases LDLR protein expression, decreases secreted PCSK9, and increases uptake of LDL particles. (A) HepG2 cells were treated overnight with the indicated concentrations of CAT‐2003 or 50 μM each of niacin and EPA, and protein expression was determined by western blot. Lower panels represent actin‐normalized densitometry of HMW and LMW LDLR protein. Significance was determined by the Student t test. Values are mean ± SEM (n = 3). (B) HepG2 cells were treated overnight with indicated concentrations of CAT‐2003 or 50 μM each of the combination of niacin and EPA, and secreted PCSK9 levels were determined by enzyme‐linked immunosorbent assay. Significance was determined by the Student t test. Values are expressed as mean ± SEM (n = 3). (C) HepG2 cells were seeded on glass coverslips and treated with 25 μM CAT‐2003 for 48 hours followed by treatment with 200 μL LDL‐Dylight 550 for an additional 4 hours. Cell staining was examined using a Zeiss LSM 510 confocal microscope with 25× objective. Images were collected with five slices of Z‐stack (2‐μm‐thick interval), and three such image stacks were collected from each slide chamber. Significance was determined by the Student t test. Values are presented as mean percent change from control ± SEM (n = 15). Abbreviations: HMW, high molecular weight; LMW, low molecular weight; N/E, niacin and EPA. *p < 0.05, **p < 0.01, ***p < 0.001, ****p < 0.0001.
CAT‐2003 INHIBITS INFLAMMATORY MARKERS
Because omega‐3 fatty acids are known to be anti‐inflammatory, we tested CAT‐2003 for inhibition of LPS‐induced expression of the IL1β and TNFα genes in the human monocytic cell line THP‐1. We found that CAT‐2003 decreased the levels of both of these markers/mediators of inflammation, while equivalent concentrations of EPA and niacin added separately or in combination did not (Supporting Fig. S2A,B). Moreover, we found that CAT‐2003 inhibited LPS‐induced NF‐κB reporter activity in RAW 264.7 macrophages stably expressing an NF‐κB‐luciferase transgene.30 No inhibition was observed when equivalent concentrations of EPA and niacin, alone or in combination, were tested in the same assay (Supporting Fig. S2C).
CAT‐2003 DECREASES PLASMA CHOLESTEROL AND TRIGLYCERIDE LEVELS
APOE*3‐Leiden mice were fed the WTD+C diet for 4 weeks. CAT‐2003 was then administered for an additional 16 weeks as a 0.75% diet admixture. CAT‐2003 lowered PCSK9, total cholesterol, and triglyceride levels within 2 weeks of treatment, and the levels were significantly and stably decreased by ∼30% within 4 weeks of treatment (Fig. 3A‐C). After 16 weeks, a full cholesterol fast protein liquid chromatography profile was performed. The majority of the cholesterol decrease was from the VLDL and LDL fractions, while HDL levels were comparatively unchanged (Fig. 3D).
Figure 3.
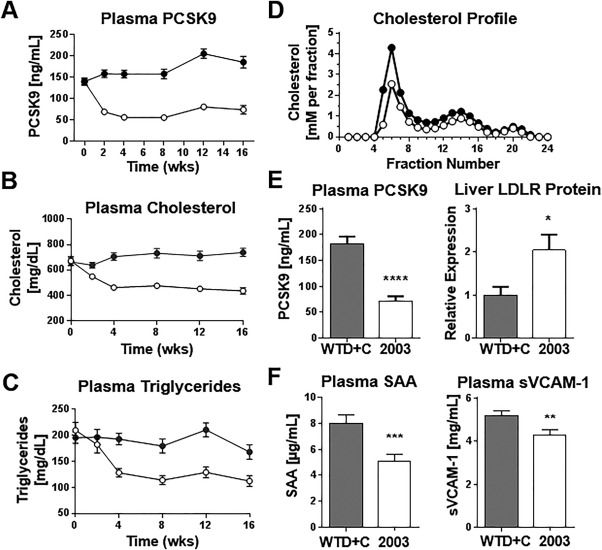
CAT‐2003 lowers plasma PCSK9, cholesterol, and triglycerides in APOE*3‐Leiden mice. (A) Plasma was taken from control or CAT‐2003‐fed animals every 2 weeks for 16 weeks, and circulating PCSK9 was measured by enzyme‐linked immunosorbent assay. (B) Plasma cholesterol and (C) plasma triglycerides were measured using commercially available colorimetric assays. (D) Cholesterol fast protein liquid chromatography profile of 16‐week plasma. (E) Plasma PCSK9 was determined by enzyme‐linked immunosorbent assay, and liver LDLR protein expression was determined by western blot at 16 weeks. (F) SAA and soluble VCAM‐1 was determined by enzyme‐linked immunosorbent assay. For panels A‐D, closed circles represent animals fed control WTD+C diet. Open circles denote animals fed the same diet plus 0.75% CAT‐2003 as diet admixture. For panels E and F, closed bars denote control WTD+C fed animals, open bars represent animals fed the same diet plus 0.75% CAT‐2003. Significance in panel E was determined by the Student t test. Significance in panel F was determined using the nonparametric Mann‐Whitney U test. For all panels, values are expressed as mean ± SEM (n = 16), except for panel D, where only the mean data are shown. Abbreviations: SAA, serum amyloid A; sVCAM‐1, soluble vascular cell adhesion molecule 1. *p < 0.05, **p < 0.01, ***p < 0.001, ****p < 0.0001.
Flash‐frozen liver samples were homogenized and analyzed for LDLR protein expression by western blotting. We found that liver LDLR protein levels doubled in CAT‐2003‐treated animals relative to control mice. The increase in LDLR protein was inversely proportional to the change in plasma PCSK9 (Fig. 3E). Systemic inflammation was also decreased in CAT‐2003‐treated animals as measured by decreases in plasma expression serum amyloid‐A and soluble vascular cell adhesion molecule 1 (Fig. 3F).
CAT‐2003 PREVENTS FORMATION OF ATHEROSCLEROTIC LESIONS
CAT‐2003 treatment significantly decreased the total lesion area and number in aortic root segments. It also increased the number of undiseased segments (Fig. 4A). A representative hematoxylin phloxine saffron stained photomicrograph demonstrating the decreased lesion area is shown in Supporting Fig. S3A. These differences led to a redistribution of the lesion severity such that fewer animals exhibited the severe type 5 phenotype (Fig. 4B). Macrophage‐mediated degradation of the fibrous cap contributes to atherosclerotic plaque instability.31 Treatment with CAT‐2003 increased plaque stability as determined by increased collagen content and reduced macrophage infiltration (Fig. 4C). Representative photomicrographs demonstrating reduced collagen staining, as analyzed by Sirius‐Red staining, and reduced macrophage infiltration, as analyzed by Mac‐3 staining, are illustrated in Supporting Fig. S3B,C.
Figure 4.
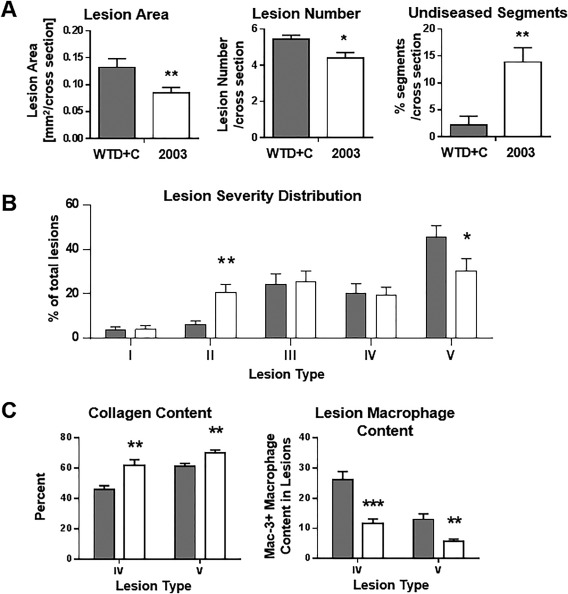
CAT‐2003 improves atherosclerotic endpoints in APOE*3‐Leiden mice. (A) Lesion area, lesion number, and undiseased segments of aortic root segments from mice treated with CAT‐2003 for 16 weeks were determined by histopathology. (B) Lesion severity distribution in aortic root segments, expressed as percent of total lesion area. (C) Collagen content as measured by percent of lesion surface area, and macrophage infiltration of aortic root segments as measured by counting the number of Mac‐3 positive cells were determined by histopathology. For all panels, closed bars represent animals fed control WTD+C. Open bars represent animals fed 0.75% CAT‐2003 diet admixture. Significance was determined using the nonparametric Mann‐Whitney U test. Values are expressed as mean ± SEM (n = 16). *p < 0.05, **p < 0.01, ***p < 0.001, ****p < 0.0001.
CAT‐2003 REDUCES DIET‐INDUCED FATTY LIVER AND FIBROSIS
Liver sections were examined by histopathology. Representative photomicrographs of the hematoxylin staining as well as the Oil‐Red‐O staining are illustrated in Fig. 5A. CAT‐2003 decreased the amount of Oil‐Red‐O staining relative to control animals (Fig. 5B). Cholesteryl ester and triglyceride levels in the livers of these animals were also significantly decreased (Fig. 5C,D). Treatment with CAT‐2003 also significantly reduced liver weights relative to control animals (Fig. 5E) and were similar to age‐matched animals fed a normal diet (data not shown).
Figure 5.
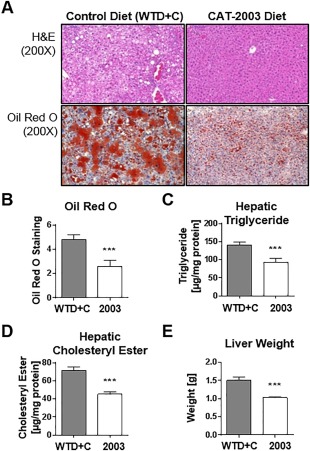
CAT‐2003 inhibits development of fatty liver in APOE*3‐Leiden mice. (A) H&E and Oil‐Red‐O staining of livers isolated from control or CAT‐2003‐fed animals after 16 weeks. (B) Quantitation of Oil‐Red‐O staining. (C) Hepatic triglyceride and (D) hepatic cholesteryl ester levels after 16 weeks as determined by commercially available colorimetric assays. (E) Liver weight. Significance was determined using the nonparametric Mann‐Whitney U test. Values are expressed as mean ± SEM (n = 16). Abbreviation: H&E, hematoxylin and eosin. *p < 0.05, **p < 0.01, ***p < 0.001, ****p < 0.0001.
Significant decreases for macrovesicular steatosis, microvesicular steatosis, and hypertrophy inflammatory cell aggregates were observed in livers of CAT‐2003‐treated animals (Fig. 6A). Representative photomicrographs showing reduced inflammatory foci and macrophage infiltration are shown in Supporting Fig. S4A,B. NF‐κB DNA binding and Il1β and Tnfα mRNA expression were decreased in liver homogenates (Fig. 6B). CAT‐2003 also reduced liver collagen deposition as determined by hydroxyproline assay (Fig. 6A). Liver sections of CAT‐2003‐treated animals similarly showed reduced Sirius‐Red staining for collagen (Supporting Fig. 4C).
Figure 6.
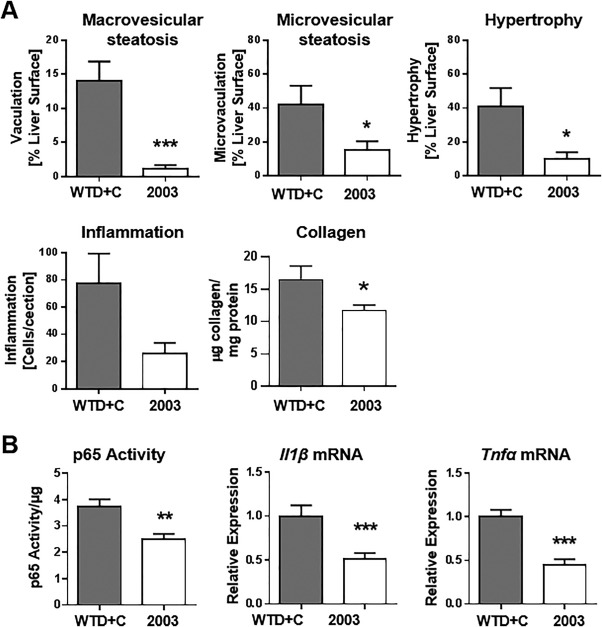
CAT‐2003 inhibits hepatic steatosis and inflammation in APOE*3‐Leiden mice. (A) macrovesicular steatosis, microvesicular steatosis, hepatocellular hypertrophy, and inflammation, as measured by histopathology in H&E sections, and hydroxyproline measurement for collagen in livers from control or CAT‐2003‐fed animals after 16 weeks. (B) NF‐κB DNA‐binding activity, Il1β mRNA and Tnfα mRNA expression as measured by real‐time reverse‐transcription polymerase chain reaction in 16‐week liver samples. Significance analysis for liver histopathology analysis in panel A was determined by the nonparametric Mann‐Whitney U test. Significance for hydroxyproline measurement in panel B was determined by the Student t test. Values are expressed as mean ± SEM (n = 16). Abbreviation: H&E, hematoxylin and eosin. *p < 0.05, **p < 0.01, ***p < 0.001, ****p < 0.0001.
CAT‐2003 SHOWS ADDITIVE CHOLESTEROL LOWERING ACTIVITY WHEN DOSED WITH ATORVASTATIN
We next tested CAT‐2003 in combination with atorvastatin in vitro and in vivo. Treatment of HepG2 cells with atorvastatin increased SREBP‐2 processing to its mature nuclear form and increased PCSK9 mRNA expression and PCSK9 protein secretion. CAT‐2003 decreased the amount of mature SREBP‐2 protein and attenuated the atorvastatin‐induced increase in PCSK9 mRNA and PCSK9 protein secretion (Supporting Fig. S5).
We therefore conducted a 4‐week APOE*3‐Leiden mouse study to test the effects of co‐administering CAT‐2003 with atorvastatin. CAT‐2003 and atorvastatin, when dosed as single agents, significantly reduced plasma cholesterol relative to control animals at both 2 and 4 weeks of treatment. The combination of CAT‐2003 and atorvastatin decreased cholesterol even further (46.5% versus 19.7% with CAT‐2003 alone and 13.8% for atorvastatin alone), indicating that CAT‐2003 works additively with a atorvastatin (Fig. 7A). This decrease was significant relative to control and CAT‐2003‐only‐ and atorvastatin‐only‐treated animals. Cholesterol in the control group increased 8.1% (Fig. 7B). Similar to our first study (Fig. 5E), the WTD+C diet led to increased liver weight relative to normal diet control animals. Atorvastatin had no effect on liver weight gain, but the livers in CAT‐2003‐treated animals, when dosed alone or in combination with atorvastatin, were comparable to those in normal diet control animals (Fig. 7C).
Figure 7.
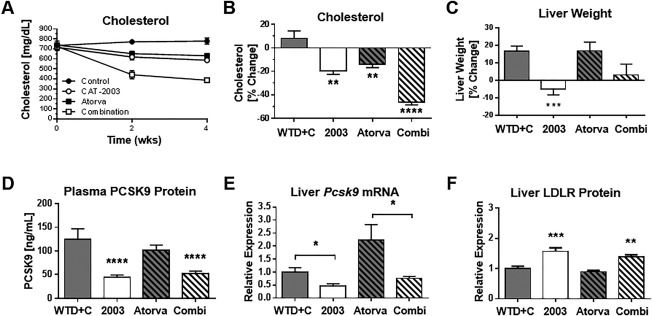
CAT‐2003 exhibits additional activity when dosed with atorvastatin for lowering cholesterol in APOE*3‐Leiden mice. (A) Time course of plasma cholesterol levels in treatment groups as measured using a commercially available colorimetric assay kit. (B) Cholesterol after 4 weeks of treatment, expressed as percent of control. (C) Liver weights after 4 weeks of treatment, expressed as percent of control. (D) Pcsk9 gene expression in liver after 4 weeks of treatment as measured by real‐time reverse‐transcription polymerase chain reaction. (E) Plasma PCSK9 levels following 4 weeks of treatment as measured by enzyme‐linked immunosorbent assay. (F) Liver LDLR protein expression following 4 weeks of treatment as measured by western blot. Significance was determined by the Student t test in comparison to WTD+C control group, except as indicated in panel E. Values are expressed as mean ± SEM (n = 10). *p < 0.05, **p < 0.01, ***p < 0.001, ****p < 0.0001.
Plasma PCSK9 levels were decreased in CAT‐2003 and CAT‐2003 plus atorvastatin‐fed animals, while atorvastatin alone showed no significant change (Fig. 7D). Liver Pcsk9 gene expression was also decreased by CAT‐2003 (Fig. 7E). LDLR protein was increased in the liver homogenates of the CAT‐2003‐fed and combination‐fed animals as measured by western blot (Fig. 7F). Similar to Pcsk9, the expression of SREBP target genes Hmgcr, Acc2, and Scd1 were decreased in the CAT‐2003 and combination diet groups but unchanged in the atorvastatin‐only group (Fig. 8A‐C).
Figure 8.
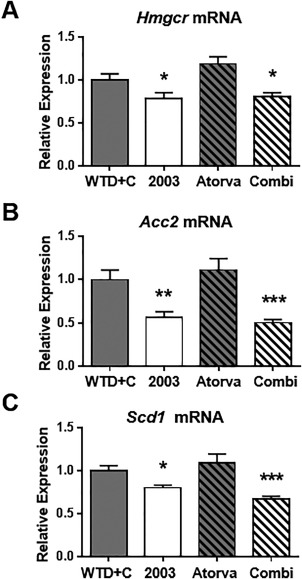
CAT‐2003 reduces SREBP target gene expression in livers of APOE*3‐Leiden mice. (A) Hmgcr, (B) Acc2, and (C) Scd1 normalized mRNA (to housekeeping gene transcript, Hprt) expression following 4 weeks of treatment. Significance was determined by the Student t test. Values are expressed as mean ± SEM (n = 10). *p < 0.05, **p < 0.01, ***p < 0.001, ****p < 0.0001.
Discussion
Omega‐3 and other polyunsaturated fatty acids have been shown to inhibit SREBP‐13, 4, 5 but have little effect on SREBP‐2. CAT‐2003, however, potently inhibits both isoforms. To the best of our knowledge, it is the only molecule known to do so. We believe this is because FAAH, the enzyme that cleaves EPA from the niacin moiety, is an ER‐resident enzyme. This serves to concentrate the EPA in the ER membrane. When the EPA of CAT‐2003 was switched to the fluorescent fatty acid cis‐parinaric acid, it was observed that the modified conjugate had an ER‐like perinuclear pattern, whereas cis‐parinaric acid by itself was highly concentrated in lysosomes. Pre‐incubation with an endocytosis inhibitor blocked the ER cellular localization, suggesting that unlike the free fatty acid the conjugated cis‐parinaric acid enters the cell by active endocytosis via clathrin‐coated vesicles.2 We hypothesize that this allows freed EPA to bind to a lipophilic site that stabilizes the SREBP/SCAP/Insig complex in the ER. SREBP‐2 inhibition apparently requires a higher concentration of EPA than SREBP‐1, as nuclear SREBP‐1 is completely inhibited after 2 hours with CAT‐2003 treatment while nuclear SREBP‐2 is only partially inhibited at the same time point (Fig. 1A). SREBP‐2 inhibition by omega‐3 fatty acids may only be achievable through enhanced ER delivery.
Statins are direct 3‐hydroxy‐3‐methyl‐glutaryl‐coenzyme A reductase inhibitors, blocking the de novo synthesis of cholesterol.32 This activates SREBP and promotes the synthesis of LDLR, which enhances the clearance of plasma lipoproteins; however, it also up‐regulates PCSK9, which promotes LDLR degradation.33, 34 Thus, the efficacy of statins is self‐limiting and determined through the establishment of a new steady state that represents the net effect of opposing factors. Pharmacologic SREBP inhibition potentiates the effect of atorvastatin by establishing yet a new steady state. This likely occurs through down‐regulation of HMGCR mRNA expression, which would compound inhibition of de novo cholesterol synthesis, and by blocking the statin‐induced up‐regulation of PCSK9. However, SREBP inhibition also decreases LDLR mRNA synthesis, which would limit the improvement of CAT‐2003 when used with a statin. Use of alirocumab or evolocumab, which are humanized monoclonal antibodies against PCSK9 that have significant LDL‐C lowering effects, represents an alternative choice for combination therapy as they would specifically block the PCSK9 effect of SREBP up‐regulation while maintaining the increased expression of LDLR mRNA.35, 36 However, these agents would not inhibit HMGCR mRNA expression. Moreover, while these agents potentiate the efficacy of statins, they do not replicate the intrahepatic effects of SREBP inhibition. Alirocumab, which cross‐reacts with mouse PCSK9, dose dependently decreased plasma cholesterol and triglycerides in APOE*3‐Leiden. CTEP mice through up‐regulation of LDLR, but had no effect on hepatic cholesterol or triglyceride content.37
As with statin therapy, the effect of CAT‐2003 when used as a single agent on plasma cholesterol is the result of a new steady state that represents the net effect of opposing forces. In the APOE*3‐Leiden mice, the balance of these opposing forces favors improved plasma lipids. However, it is possible that the relative strengths of these opposing forces will vary across different species or even within heterogeneous populations of the same species. This may explain the relatively modest effects of CAT‐2003 for lowering PCSK9, non‐HDL‐C, and LDL‐C in early clinical studies.20
A limitation in our study is an inability to parse the relative contribution of the EPA or niacin moiety on the observed changes in plasma lipids. The intracellular delivery of EPA and niacin cannot be mimicked by co‐administration of the individual components as is evidenced by our in vitro assays. Moreover, altering the components of the conjugate is also problematic in that the EPA moiety is needed for FAAH‐dependent cleavage and intracellular delivery of the EPA and niacin and the niacin moiety is required for enhanced liver uptake of the conjugate. However, the fact that non‐HDL‐C was selectively decreased suggests a contribution of the niacin beyond enhancing liver delivery. While neither CAT‐2003 nor its linker‐niacin metabolite binds GPR109A, we cannot rule out that the linker niacin or the parent compound might be acting extracellularly via another cell‐surface receptor.
The reduction of diet‐induced hepatic steatosis and liver inflammation suggests that SREBP inhibition may be efficacious in treatment of NASH. Given the inherent self‐limiting effects of CAT‐2003 on plasma lipids, this may be the best use for pharmacologic SREBP inhibition. APOE*3‐Leiden mice fed a high‐cholesterol diet for 20 weeks develop overt NASH with fibrosis.38 While fibrosis was only beginning to occur at the shorter experimental period used in our study, we could nevertheless detect a decrease in collagen content in the livers of CAT‐2003‐fed animals relative to controls. Approximately 1 in 3 Americans have some degree of hepatic steatosis,39 which is the first stage of NASH. Hepatic steatosis is asymptomatic and can resolve itself through changes in diet; however, a subset of these patients will progress to NASH, which affects 2%‐5% of Americans. NASH is characterized as fatty liver with inflammation and damage. At some point in its progression, the liver becomes fibrotic and cirrhosis develops. NASH is a growing worldwide problem, particularly in areas with high hepatitis C or human immunodeficiency virus infection rates.40 In addition to cirrhosis, patients are at increased risk of developing hepatocellular carcinomas.41 SREBP inhibition could improve NASH through decreased FASN expression, an SREBP target gene that is the rate‐limiting step in de novo fatty acid synthesis, and reduced hepatic inflammation. SREBP inhibition may also help clear liver fat through increased β‐oxidation of fatty acids. This could occur through inhibition of acetyl‐coenzyme A carboxylase‐2, which is responsible for the formation of malonyl‐coenzyme A, which inhibits the transport of fatty acids into the mitochondrial matrix through inhibition of carnitine palmitoyltransferase 1.42
A polymorphism in the SREBP‐2 gene, SREBF‐2, predisposes individuals to NASH.43 Moreover, a variant of the PNPLA3 gene, PNPLA3 I148M, is strongly associated with NASH44 and is an SREBP target gene.45 Patatin‐like phospholipase domain‐containing 3 (PNPLA3) is inhibited by CAT‐2003 in vitro (data not shown). The polymorphism occurs in 45% of Hispanics, 33% of Caucasians, and 24% of African Americans.46 Interestingly, Pnpla3 knockout mice do not develop fatty liver47; rather, the predisposition toward NASH is associated with the PNPLA3 I148M variant accumulating on lipid droplets.48
We have recently shown that CAT‐2003 reduces fibrosis, inflammation, and preneoplastic lesions in a murine NASH model.49 Interestingly, niacin itself has been reported to reduce hepatic steatosis in rats fed a high‐fat diet. However, this effect was attributed to the GPR109A‐dependent decrease in free fatty acids from adipose tissue reducing triglycerides in the liver, and no effect was seen on SREBP target genes in this study.50 Thus, we believe that the effects observed for hepatic steatosis with CAT‐2003 in our study are the result of EPA‐mediated inhibition of SREBP.
In summary, CAT‐2003 is a novel conjugate of EPA and niacin, designed to be taken up by the liver and release EPA at the ER. It inhibits the maturation of both SREBP isoforms and dose‐dependently decreases the expression of SREBP target genes. In APOE*3‐Leiden mice, CAT‐2003 lowers plasma triglyceride and cholesterol levels, improves multiple atherosclerotic endpoints, and works additively when dosed in combination with atorvastatin. It also decreased the steatosis, inflammation, and fibrosis that occur in the livers of these mice when fed a WTD+C diet. These data suggest that SREBP inhibition may be useful for the treatment of dyslipidemia and NASH.
Author names in bold designate shared co‐first authorship.
Supporting information
Additional Supporting Information may be found at onlinelibrary.wiley.com/doi/10.1002/hep4.1042/suppinfo.
Supporting Information
Acknowledgment
We thank Wim van Duyvenvoorde, Karin Toet, and Erik Offerman at the Netherlands Organization for Applied Scientific Research for technical assistance and the entire Catabasis team for numerous discussions and help in the preparation of this manuscript.
Potential conflict of interest: Nothing to report.
REFERENCES
- 1. Cravatt BF, Giang DK, Mayfield SP, Boger DL, Lerner RA, Gilula NB. Molecular characterization of an enzyme that degrades neuromodulatory fatty‐acid amides. Nature 1996;384:83‐87. [DOI] [PubMed] [Google Scholar]
- 2. Vu CB, Bemis JE, Benson E, Bista P, Carney D, Fahrner R, et al. Synthesis and characterization of fatty acid conjugates of niacin and salicylic acid. J Med Chem 2016;59:1217‐1231. [DOI] [PubMed] [Google Scholar]
- 3. Sekiya M, Yahagi N, Matsuzaka T, Najima Y, Nakakuki M, Nagai R, et al. Polyunsaturated fatty acids ameliorate hepatic steatosis in obese mice by SREBP‐1 suppression. Hepatology 2003;38:1529‐1539. [DOI] [PubMed] [Google Scholar]
- 4. Tanaka N, Zhang X, Sugiyama E, Kono H, Horiuchi A, Nakajima T, et al. Eicosapentaenoic acid improves hepatic steatosis independent of PPARalpha activation through inhibition of SREBP‐1 maturation in mice. Biochem Pharmacol 2010;80:1601‐1612. [DOI] [PMC free article] [PubMed] [Google Scholar]
- 5. Hannah VC, Ou J, Luong A, Goldstein JL, Brown MS. Unsaturated fatty acids down‐regulate srebp isoforms 1a and 1c by two mechanisms in HEK‐293 cells. J Biol Chem 2001;276:4365‐4372. [DOI] [PubMed] [Google Scholar]
- 6. Oh DY, Talukdar S, Bae EJ, Imamura T, Morinaga H, Fan W, et al. GPR120 is an omega‐3 fatty acid receptor mediating potent anti‐inflammatory and insulin‐sensitizing effects. Cell 2010;142:687‐698. [DOI] [PMC free article] [PubMed] [Google Scholar]
- 7. Horton JD. Sterol regulatory element‐binding proteins: transcriptional activators of lipid synthesis. Biochem Soc Trans 2002;30:1091‐1095. [DOI] [PubMed] [Google Scholar]
- 8. Brown MS, Goldstein JL. Cholesterol feedback: from Schoenheimer's bottle to Scap's MELADL. J Lipid Res 2009;50 Suppl:S15‐27. [DOI] [PMC free article] [PubMed] [Google Scholar]
- 9. Sun LP, Li L, Goldstein JL, Brown MS. Insig required for sterol‐mediated inhibition of Scap/SREBP binding to COPII proteins in vitro. J Biol Chem 2005;280:26483‐26490. [DOI] [PubMed] [Google Scholar]
- 10. DeBose‐Boyd RA, Brown MS, Li WP, Nohturfft A, Goldstein JL, Espenshade PJ. Transport‐dependent proteolysis of SREBP: relocation of site‐1 protease from Golgi to ER obviates the need for SREBP transport to Golgi. Cell 1999;99:703‐712. [DOI] [PubMed] [Google Scholar]
- 11. Horton JD, Cohen JC, Hobbs HH. PCSK9: a convertase that coordinates LDL catabolism. J Lipid Res 2009;50 Suppl:S172‐177. [DOI] [PMC free article] [PubMed] [Google Scholar]
- 12. Lagace TA, Curtis DE, Garuti R, McNutt MC, Park SW, Prather HB, et al. Secreted PCSK9 decreases the number of LDL receptors in hepatocytes and in livers of parabiotic mice. J Clin Invest 2006;116:2995‐3005. [DOI] [PMC free article] [PubMed] [Google Scholar]
- 13. Said HM, Nabokina SM, Balamurugan K, Mohammed ZM, Urbina C, Kashyap ML. Mechanism of nicotinic acid transport in human liver cells: experiments with HepG2 cells and primary hepatocytes. Am J Physiol Cell Physiol 2007;293:C1773‐1778. [DOI] [PubMed] [Google Scholar]
- 14. Ganji SH, Kamanna VS, Kashyap ML. Niacin and cholesterol: role in cardiovascular disease (review). J Nutr Biochem 2003;14:298‐305. [DOI] [PubMed] [Google Scholar]
- 15. Goel H, Dunbar RL. Niacin alternatives for dyslipidemia: fool's gold or gold mine? Part II: Novel niacin mimetics. Curr Atheroscler Rep 2016;18:17. [DOI] [PMC free article] [PubMed] [Google Scholar]
- 16. Tunaru S, Kero J, Schaub A, Wufka C, Blaukat A, Pfeffer K, et al. PUMA‐G and HM74 are receptors for nicotinic acid and mediate its anti‐lipolytic effect. Nat Med 2003;9:352‐355. [DOI] [PubMed] [Google Scholar]
- 17. Guo L, Fisher EA. Niacin (vitamin B3, nicotinic acid) decreases apolipoprotein B (ApoB) and VLDL secretion from mouse hepatocytes. FASEB Journal 2011;25:lb174. [Google Scholar]
- 18. Ganji SH, Tavintharan S, Zhu D, Xing Y, Kamanna VS, Kashyap ML. Niacin noncompetitively inhibits DGAT2 but not DGAT1 activity in HepG2 cells. J Lipid Res 2004;45:1835‐1845. [DOI] [PubMed] [Google Scholar]
- 19. Lauring B, Taggart AK, Tata JR, Dunbar R, Caro L, Cheng K, et al. Niacin lipid efficacy is independent of both the niacin receptor GPR109A and free fatty acid suppression. Sci Transl Med 2012;4:148ra115. [DOI] [PubMed] [Google Scholar]
- 20. Donovan J, Dunbar R, Biernat L, Logan D, Curtis M, Mancini M, et al. Phase 1 single and multiple ascending dose study of CAT‐2003, a novel activator of lipoprotein lipase, demonstrates reductions in postprandial triglycerides. Journal of the American College of Cardiology 2014;63:A1450. [Google Scholar]
- 21. Zadelaar S, Kleemann R, Verschuren L, de Vries‐Van der Weij J, van der Hoorn J, Princen HM, et al. Mouse models for atherosclerosis and pharmaceutical modifiers. Arterioscler Thromb Vasc Biol 2007;27:1706‐1721. [DOI] [PubMed] [Google Scholar]
- 22. van den Maagdenberg AM, Hofker MH, Krimpenfort PJ, de Bruijn I, van Vlijmen B, van der Boom H, et al. Transgenic mice carrying the apolipoprotein E3‐Leiden gene exhibit hyperlipoproteinemia. J Biol Chem 1993;268:10540‐10545. [PubMed] [Google Scholar]
- 23. McFarlane MR, Liang G, Engelking LJ. Insig proteins mediate feedback inhibition of cholesterol synthesis in the intestine. J Biol Chem 2014;289:2148‐2156. [DOI] [PMC free article] [PubMed] [Google Scholar]
- 24. Kleemann R, van Erk M, Verschuren L, van den Hoek AM, Koek M, Wielinga PY, et al. Time‐resolved and tissue‐specific systems analysis of the pathogenesis of insulin resistance. PLoS One 2010;5:e8817. [DOI] [PMC free article] [PubMed] [Google Scholar]
- 25. Verschuren L, Kleemann R, Offerman EH, Szalai AJ, Emeis SJ, Princen HM, et al. Effect of low dose atorvastatin versus diet‐induced cholesterol lowering on atherosclerotic lesion progression and inflammation in apolipoprotein E*3‐Leiden transgenic mice. Arterioscler Thromb Vasc Biol 2005;25:161‐167. [DOI] [PubMed] [Google Scholar]
- 26. Kooistra T, Verschuren L, de Vries‐van der Weij J, Koenig W, Toet K, Princen HM, et al. Fenofibrate reduces atherogenesis in ApoE*3Leiden mice: evidence for multiple antiatherogenic effects besides lowering plasma cholesterol. Arterioscler Thromb Vasc Biol 2006;26:2322‐2330. [DOI] [PubMed] [Google Scholar]
- 27. Morrison M, van der Heijden R, Heeringa P, Kaijzel E, Verschuren L, Blomhoff R, et al. Epicatechin attenuates atherosclerosis and exerts anti‐inflammatory effects on diet‐induced human‐CRP and NFkappaB in vivo. Atherosclerosis 2014;233:149‐156. [DOI] [PubMed] [Google Scholar]
- 28. Liang W, Menke AL, Driessen A, Koek GH, Lindeman JH, Stoop R, et al. Establishment of a general NAFLD scoring system for rodent models and comparison to human liver pathology. PLoS One 2014;9:e115922. [DOI] [PMC free article] [PubMed] [Google Scholar]
- 29. Adams CM, Reitz J, De Brabander JK, Feramisco JD, Li L, Brown MS, et al. Cholesterol and 25‐hydroxycholesterol inhibit activation of SREBPs by different mechanisms, both involving SCAP and Insigs. J Biol Chem 2004;279:52772‐52780. [DOI] [PubMed] [Google Scholar]
- 30. Langen RC, Haegens A, Vernooy JH, Wouters EF, de Winther MP, Carlsen H, et al. NF‐kappaB activation is required for the transition of pulmonary inflammation to muscle atrophy. Am J Respir Cell Mol Biol 2012;47:288‐297. [DOI] [PMC free article] [PubMed] [Google Scholar]
- 31. Lendon CL, Davies MJ, Born GV, Richardson PD. Atherosclerotic plaque caps are locally weakened when macrophages density is increased. Atherosclerosis 1991;87:87‐90. [DOI] [PubMed] [Google Scholar]
- 32. Istvan ES, Deisenhofer J. Structural mechanism for statin inhibition of HMG‐CoA reductase. Science 2001;292:1160‐1164. [DOI] [PubMed] [Google Scholar]
- 33. Dubuc G, Chamberland A, Wassef H, Davignon J, Seidah NG, Bernier L, et al. Statins upregulate PCSK9, the gene encoding the proprotein convertase neural apoptosis‐regulated convertase‐1 implicated in familial hypercholesterolemia. Arterioscler Thromb Vasc Biol 2004;24:1454‐1459. [DOI] [PubMed] [Google Scholar]
- 34. Careskey HE, Davis RA, Alborn WE, Troutt JS, Cao G, Konrad RJ. Atorvastatin increases human serum levels of proprotein convertase subtilisin/kexin type 9. J Lipid Res 2008;49:394‐398. [DOI] [PubMed] [Google Scholar]
- 35. Stein EA, Mellis S, Yancopoulos GD, Stahl N, Logan D, Smith WB, et al. Effect of a monoclonal antibody to PCSK9 on LDL cholesterol. N Engl J Med 2012;366:1108‐1118. [DOI] [PubMed] [Google Scholar]
- 36. Sullivan D, Olsson AG, Scott R, Kim JB, Xue A, Gebski V, et al. Effect of a monoclonal antibody to PCSK9 on low‐density lipoprotein cholesterol levels in statin‐intolerant patients: the GAUSS randomized trial. JAMA 2012;308:2497‐2506. [DOI] [PubMed] [Google Scholar]
- 37. Kuhnast S, van der Hoorn JW, Pieterman EJ, van den Hoek AM, Sasiela WJ, Gusarova V, et al. Alirocumab inhibits atherosclerosis, improves the plaque morphology, and enhances the effects of a statin. J Lipid Res 2014;55:2103‐2112. [DOI] [PMC free article] [PubMed] [Google Scholar]
- 38. Morrison MC, Liang W, Mulder P, Verschuren L, Pieterman E, Toet K, et al. Mirtoselect, an anthocyanin‐rich bilberry extract, attenuates non‐alcoholic steatohepatitis and associated fibrosis in ApoE(*)3Leiden mice. J Hepatol 2015;62:1180‐1186. [DOI] [PubMed] [Google Scholar]
- 39. Browning JD, Szczepaniak LS, Dobbins R, Nuremberg P, Horton JD, Cohen JC, et al. Prevalence of hepatic steatosis in an urban population in the United States: impact of ethnicity. Hepatology 2004;40:1387‐1395. [DOI] [PubMed] [Google Scholar]
- 40. Sanyal AJ. NASH: a global health problem. Hepatol Res 2011;41:670‐674. [DOI] [PubMed] [Google Scholar]
- 41. Starley BQ, Calcagno CJ, Harrison SA. Nonalcoholic fatty liver disease and hepatocellular carcinoma: a weighty connection. Hepatology 2010;51:1820‐1832. [DOI] [PubMed] [Google Scholar]
- 42. Abu‐Elheiga L, Brinkley WR, Zhong L, Chirala SS, Woldegiorgis G, Wakil SJ. The subcellular localization of acetyl‐CoA carboxylase 2. Proc Natl Acad Sci USA 2000;97:1444‐1449. [DOI] [PMC free article] [PubMed] [Google Scholar]
- 43. Musso G, Cassader M, Bo S, De Michieli F, Gambino R. Sterol regulatory element‐binding factor 2 (SREBF‐2) predicts 7‐year NAFLD incidence and severity of liver disease and lipoprotein and glucose dysmetabolism. Diabetes 2013;62:1109‐1120. [DOI] [PMC free article] [PubMed] [Google Scholar]
- 44. Dongiovanni P, Donati B, Fares R, Lombardi R, Mancina RM, Romeo S, et al. PNPLA3 I148M polymorphism and progressive liver disease. World J Gastroenterol 2013;19:6969‐6978. [DOI] [PMC free article] [PubMed] [Google Scholar]
- 45. Liang H, Xu J, Xu F, Liu H, Yuan D, Yuan S, et al. The SRE motif in the human PNPLA3 promoter (‐97 to ‐88 bp) mediates transactivational effects of SREBP‐1c. J Cell Physiol 2015;230:2224‐2232. [DOI] [PubMed] [Google Scholar]
- 46. Baclig MO, Lozano‐Kuhne JP, Mapua CA, Gopez‐Cervantes J, Natividad FF. Genetic variation I148M in patatin‐like phospholipase 3 gene and risk of non‐alcoholic fatty liver disease among Filipinos. Int J Clin Exp Med 2014;7:2129‐2136. [PMC free article] [PubMed] [Google Scholar]
- 47. Basantani MK, Sitnick MT, Cai L, Brenner DS, Gardner NP, Li JZ, et al. Pnpla3/adiponutrin deficiency in mice does not contribute to fatty liver disease or metabolic syndrome. J Lipid Res 2011;52:318‐329. [DOI] [PMC free article] [PubMed] [Google Scholar]
- 48. Smagris E, BasuRay S, Li J, Huang Y, Lai KM, Gromada J, et al. Pnpla3I148M knockin mice accumulate PNPLA3 on lipid droplets and develop hepatic steatosis. Hepatology 2015;61:108‐118. [DOI] [PMC free article] [PubMed] [Google Scholar]
- 49. Picarella D, Zimmer M, Lee D, Briggs M, Rogers A, Donovan J, et al. CAT‐2003, an analog of CAT‐2054 and a novel oral SREBP inhibitor, inhibits inflammation and fibrosis in a murine model of nonalcoholic steatohepatitis. J Clin Lipidol 2016;10:722‐723. [Google Scholar]
- 50. Ganji SH, Kukes GD, Lambrecht N, Kashyap ML, Kamanna VS. Therapeutic role of niacin in the prevention and regression of hepatic steatosis in rat model of nonalcoholic fatty liver disease. Am J Physiol Gastrointest Liver Physiol 2014;306:G320‐327. [DOI] [PubMed] [Google Scholar]
Associated Data
This section collects any data citations, data availability statements, or supplementary materials included in this article.
Supplementary Materials
Additional Supporting Information may be found at onlinelibrary.wiley.com/doi/10.1002/hep4.1042/suppinfo.
Supporting Information