

Abstract
The clinical presentation of alcoholic hepatitis (AH) can be mimicked by other alcoholic liver diseases. The aim of this study was to identify clinical features that predict AH on liver biopsy. Biopsies from patients hospitalized for presumed severe AH were used to identify a derivation cohort (101 patients) and validation cohort (71 patients). Using histologic scores for hepatocyte ballooning, Mallory‐Denk bodies, and lobular inflammation, 95 patient biopsies (55%) were classified as definite AH, 55 (32%) as possible AH, and 22 (13%) as no AH. Survival was similar among the groups, but mortality was significantly increased for patients with fatty change ≤50% on initial liver biopsy. An analysis limited to uninfected patients with definite AH or no AH in the derivation cohort identified a greater leukocyte count at admission and radiographic evidence of liver surface nodularity as independent predictors of definite AH on biopsy (P < 0.05). In the derivation cohort, the leukocyte count thresholds for ensuring 100% specificity for diagnosing definite AH were 10 × 109/L if the liver surface was nodular and 14 × 109/L if the liver surface was smooth, with a sensitivity of 76% and an area under the receiver operator characteristic curve of 0.88. In the validation cohort, these thresholds had a specificity of 86%, a sensitivity of 59%, and an area under the receiver operator characteristic curve of 0.72. Conclusion: The combination of an elevated leukocyte count and a nodular liver surface in the absence of active infection retrospectively identified patients with a high likelihood of histologic AH for whom liver biopsy may not be necessary. For patients with suspected severe AH who do not fulfill these criteria, liver biopsy is important to exclude other variants of alcoholic liver disease. (Hepatology Communications 2017;1:1070–1084)
Abbreviations
- ABIC
age, bilirubin, international normalized ratio, and creatinine score
- AH
alcoholic hepatitis
- AHHS
alcoholic hepatitis histologic score
- AUROC
area under the receiver operating characteristics curve
- CI
confidence interval
- DF
discriminant function
- GAH
Glasgow alcoholic hepatitis score
- ICC
intraclass correlation coefficient
- MELD
model for end‐stage liver disease score
Introduction
Alcoholic hepatitis (AH) is a major cause of short‐term morbidity and mortality among heavy drinkers.1 Liver biopsy remains the gold standard for the definitive diagnosis of AH,2 defined histologically by the presence of neutrophilic lobular inflammation and hepatocyte degeneration (ballooning and Mallory‐Denk bodies) in a background of steatosis and “chicken‐wire” fibrosis.3 However, biopsy is not routinely recommended because of its associated risks, costs, and lack of availability in many communities.4 In the absence of histology, AH may be overdiagnosed in 25%‐50% of alcoholic patients who have jaundice due to other acute or acute‐on‐chronic patterns of liver injury.5, 6, 7 Misdiagnosis potentially leads to unwarranted treatment and increases the risk of type II error in clinical studies.8 A recent expert consensus statement recommended confirmatory biopsy for patients being considered for inclusion in AH clinical trials if they have “potential confounding factors,” such as possible drug‐induced liver injury, ischemic hepatitis, or “atypical laboratory tests.”9 The statement did not address the potential role of biopsy in differentiating between AH and non‐necroinflammatory variants of acute alcoholic liver injury, specifically alcoholic foamy degeneration, alcoholic fatty liver with jaundice, and acute‐on‐chronic liver injury due to other causes.10 Distinguishing between AH and other histologic phenotypes of alcohol‐related liver disease was recently identified as a major gap in knowledge and research priority.11
The primary aim of this study was to identify clinical predictors of histologically confirmed AH and to use these to develop and validate a clinical model capable of differentiating histologic AH from other forms of alcoholic liver disease. Secondary aims of this study were to (i) describe the spectrum of histologic findings in patients with alcoholic liver disease with jaundice, (ii) compare the outcomes of patients with histologic AH to those of patients without necroinflammation or with only focal histologic findings of AH, and (iii) validate the prognostic use of the alcoholic hepatitis histologic score (AHHS).12
Patients and Methods
PATIENTS AND PROCEDURES
The study population consisted of all patients who were biopsied due to clinical suspicion for AH while admitted to a large, urban, academic hospital. During the years of this study, standard practice at the hospital for patients with a clinical diagnosis of severe AH (except those who were critically ill in the intensive care unit) was to perform liver biopsy for histologic confirmation. We selected two time periods for the purpose of constructing two data sets to develop and validate a prediction model. The model derivation data set included patients admitted between 2008 and 2013. The model validation data set included patients admitted in 2014 and 2015. Both patient cohorts were identified by performing a retrospective search of the hospital's pathology database to identify patients with a histologic diagnosis of alcoholic liver disease. Inclusion criteria were (1) chronic alcoholism with active or recent excessive alcohol consumption; (2) recent onset of jaundice (<3 months) before hospitalization with a total bilirubin of at least 5 mg/dL either at admission or at the date of liver biopsy; and (3) severe alcoholic liver disease either at admission or at the date of liver biopsy defined by a Maddrey's discriminant function (DF)13 of at least 32. Biopsy specimens were excluded if they were insufficient for evaluation or were obtained at autopsy, intraoperatively, during placement of a transjugular intrahepatic portosystemic shunt, during targeted biopsy of a liver mass, more than 14 days after admission, or more than 7 days after receiving systemic corticosteroids. Also excluded were patients who had previously been included in the study based on an earlier biopsy and those with human immunodeficiency virus or any nonalcoholic, non‐hepatitis C causes of liver disease. The Institutional Review Board of the University of Southern California approved this study.
Treatment decisions were at the discretion of the attending physicians. In general, patients with histologically confirmed severe AH were treated with prednisone or prednisolone 40 mg/day orally, unless contraindicated. In all patients, infection was screened at admission by chest x‐ray, urine and blood cultures, and paracentesis if ascites was present. Corticosteroids were initiated at least 48 hours after identified infections were controlled. The Lille score14 was assessed after 7 days, and corticosteroids were withdrawn in nonresponders. Patients with a response to corticosteroids based on a Lille score <0.45 completed a 28‐day course of corticosteroids, with or without a subsequent 4‐week taper period. For any patients treated empirically prior to liver biopsy, treatment was discontinued if AH was not confirmed histologically. Clinical complications, including ascites, spontaneous bacterial peritonitis, renal dysfunction, hepatic encephalopathy, and gastrointestinal hemorrhage, were treated according to current guidelines.
HISTOLOGIC DATA AND DEFINITIONS
Liver specimens were formalin fixed and paraffin embedded. Prepared 3‐μm slides were stained with hematoxylin and eosin, Masson's trichrome, reticulin silver, diastase‐digested periodic acid‐schiff, and Perl's iron stains. The median biopsy length was 18 mm (interquartile range, 14‐23 mm).
Liver specimens were prospectively reviewed by an expert liver pathologist (G.K.) who was blinded to clinical, laboratory, and radiologic data. A detailed histologic analysis of each specimen was performed, and 21 histologic features were scored (Supporting Table S1). The histologic scores were then used to categorize patients as having “definite AH,” “possible AH,” or “no AH.” Definite AH was defined by the presence of (a) at least mild/focal (≥1+) lobular inflammation and (b) hepatocyte degeneration evidenced by moderate/marked (2+) hepatocyte ballooning, easily seen (≥2+) Mallory‐Denk bodies, or both (detailed in Supporting Methods). No AH was defined by (a) absent or mild/focal (≤1+) lobular inflammation, (b) absent hepatocyte ballooning, and (c) absent Mallory‐Denk bodies. Patients not meeting these criteria for either definite AH or no AH were classified as having possible AH. Illustrative examples of patients in each of the three histologic groups are shown in Fig. 1. The histologic scores were also used to calculate each patient's AHHS12 to validate its prognostic use. Megamitochondria were rarely seen in specimens and not scored or included in the AHHS calculations.
Figure 1.
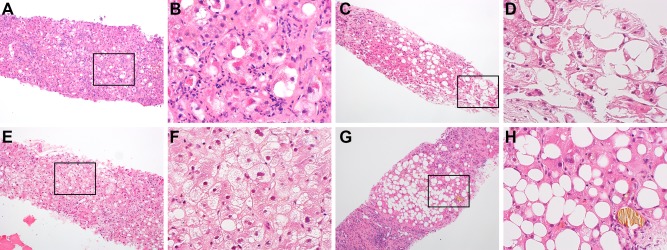
Typical examples of histology (×10 with inset and magnification ×40, hematoxylin and eosin stain). (A,B) Patient with definite AH who was scored as having 3+ lobular inflammation with mostly neutrophils, 2+ hepatocyte ballooning, and 3+ Mallory‐Denk bodies. (C,D) Patient with possible AH who was scored as having 1+ lobular inflammation with mostly lymphocytes, 1+ hepatocyte ballooning, and absent Mallory‐Denk bodies. (E,F) Patient with no AH who was diagnosed with alcoholic foamy degeneration without cirrhosis and who was scored as having 1+ lobular inflammation with mostly lymphocytes, absent hepatocyte ballooning, and absent Mallory‐Denk bodies. (G,H) Patient with no AH who was diagnosed with alcoholic fatty liver with jaundice as well as cirrhosis and who was scored as having 1+ lobular inflammation with mostly lymphocytes, absent hepatocyte ballooning, and absent Mallory‐Denk bodies.
To assess the reliability of the subjective histologic scores, biopsy specimens for patients in the derivation cohort were independently scored by two additional expert liver pathologists (S.G. and S.W.F.). In addition, a separate histologic analysis using digital morphometrics (detailed in Supporting Methods) was performed to collect quantitative data for fatty change, sinusoidal collagen, and Mallory‐Denk bodies for comparison to their respective histologic scores.
CLINICAL DATA AND OUTCOMES
Demographic, clinical, laboratory, radiologic, and treatment data were retrospectively collected by detailed and systematic review of patients' medical records. Although all included patients had active or recent excessive alcohol consumption by history, data regarding patients' amount of alcohol consumption daily or weekly were not consistently recorded in the medical records and not collected. Laboratory data were used to calculate the following disease severity scores: DF and model for end‐stage liver disease (MELD)15; age, serum bilirubin, international normalized ratio, and serum creatinine (ABIC)16; and Glasgow alcoholic hepatitis (GAH) scores.17 Radiologic data were abstracted from ultrasonographic images or, if not available, from computed tomography. Radiologic data were set to missing for patients that did not have an imaging study performed within 30 days before or after the hospitalization when liver biopsy was obtained.
For patients in the derivation cohort, outcomes data were collected regarding in‐hospital development of liver‐related complications, liver transplantation, and mortality. Data on hospitalizations or outpatient follow‐up outside our health care network were not available for review. Therefore, in order to assess survival, linkage of the derivation cohort to the Center for Disease Control National Death Index (a nationwide vital statistics database) was performed to identify all deaths occurring through December 31, 2013. Patients in the validation cohort were not included in outcomes analyses because when we conducted the analyses, National Death Index records were not yet available for those years.
STATISTICAL ANALYSIS
Categorical variables are summarized by percentages, and continuous variables are summarized by medians and interquartile ranges. Comparisons between groups were performed using chi‐squared tests for categorical variables and Kruskal‐Wallis rank‐sum tests for continuous variables.
The derivation cohort was used to develop a model for clinical prediction of biopsy‐proven AH. The validation cohort was used to validate the model. Analyses for model derivation and validation excluded patients classified as possible AH and those with active infection at admission or prior to the date of biopsy. Candidate predictors were age, sex, ethnicity, admission serum laboratory parameters (leukocyte count, neutrophils, lymphocytes, monocytes, platelet count, creatinine, alkaline phosphatase, aspartate aminotransferase, alanine aminotransferase, total protein, albumin, globulins, total bilirubin, and international normalized ratio), radiologic features (liver surface nodularity, hepatomegaly defined as ≥16 cm, splenomegaly defined as ≥13 cm, ascites, portosystemic collaterals, and portal vein thrombosis), and disease severity scores (DF, MELD score, ABIC score, and GAH score) at admission. To avoid the influence of patients' treatments with antibiotics, corticosteroids, or other medications, laboratory parameters from the date of biopsy or temporal changes in laboratory parameters were not used as candidate predictors. Predictors that were significant (P < 0.1) in univariate logistic regression analyses were included in a multivariate logistic regression model and eliminated using backward stepwise elimination. Akaike's information criterion was computed to select the most robust predictors. For the final selected predictors, the area under the receiver operating characteristic curve (AUROC) was computed to determine the diagnostic accuracy of the predictive model. Thresholds were selected that maximized Youden's index (the sum of the sensitivity and specificity) by using the CUTPT program written for STATA.18 To reliably identify patients with AH without the need for liver biopsy, thresholds maximizing only specificity were also identified. The sensitivity, specificity, positive predictive value, negative predictive value, percent correctly classified, and likelihood ratios were computed for the selected thresholds.
Reliability of the histologic scores was assessed by correlating scores with digital morphometrics data using linear regression models and by assessing interobserver agreement for the scores by computing two‐way, mixed, consistency, single‐measures intraclass correlations.19 Finally, for exploratory survival analyses within the derivation cohort, we used Cox proportional hazard regression models to account for varying lengths of follow‐up. Time at risk was from the date of admission to the date of death or censoring. Patients lost to follow‐up were censored as alive on the date of the last known clinic or hospital follow‐up.
All confidence intervals (CIs), significance tests, and resulting P values were two‐sided with an alpha level of 0.05. Statistical analyses were performed using STATA SE version 13.1 for Mac (StataCorp LP, College Station, TX).
Results
CHARACTERISTICS OF PARTICIPANTS
A total of 172 patients met criteria for inclusion in the study (101 in the derivation cohort and 71 in the validation cohort). Biopsies were obtained a median of 6 days after admission (range, 1‐14 days) by transjugular (85%) or percutaneous (15%) approaches. The median age of patients was 45 years (range, 22‐68 years), with a predominance of men (76%) and Hispanic patients (83%). Eight (5%) of the patients had chronic hepatitis C infection with detectable virus in peripheral blood; none received antiviral therapy during or near the dates of hospitalization. Severe disease (DF ≥32) was present at admission in 158 patients (92%) and at the date of liver biopsy in 14 patients (8%). The clinical, laboratory, and radiologic features of the included patients are summarized in Table 1. Baseline characteristics were similar for patients assigned to the derivation and validation cohorts. In the derivation cohort, 34 patients (34%) were exposed to presumptive corticosteroid treatment prior to liver biopsy compared to only 3 patients (4%) in the validation cohort.
Table 1.
CHARACTERISTICS OF THE STUDY POPULATION
| Variable |
Derivation Cohort (n = 101) |
Validation Cohort (n = 71) |
P |
|---|---|---|---|
| Clinical features: | |||
| Male sex, n (%) | 72 (71%) | 59 (83%) | 0.07 |
| Hispanic ethnicity, n (%) | 87 (86%) | 55 (77%) | 0.14 |
| Age (years) | 43 (37‐50) | 46 (40‐51) | 0.17 |
| Pre‐admission alcohol sobriety (days)a | 7 (2‐28) | 10 (3‐21) | 0.65 |
| History of liver disease, n (%) | 33 (33%) | 31 (44%) | 0.14 |
| Chronic hepatitis C infection, n (%) | 6 (6%) | 2 (3%) | 0.34 |
| Infection prior to date of biopsy, n (%) | 20 (20%) | 11 (15%) | 0.47 |
| Corticosteroid treatment prior to biopsy: | <0.001 | ||
| None, n (%) | 67 (66%) | 68 (96%) | |
| 1‐3 days, n (%) | 23 (23%) | 1 (1%) | |
| 4‐7 days, n (%) | 11 (11%) | 2 (3%) | |
| Disease severity scores at admission: | |||
| DF | 56 (39‐67) | 49 (40‐63) | 0.22 |
| MELD | 18 (16‐21) | 18 (16‐21) | 0.86 |
| ABIC | 7.6 (7.1‐9.0) | 8.0 (7.0‐8.8) | 0.65 |
| GAH | 9 (8‐10) | 9 (8‐10) | 0.96 |
| AHHS | 7 (5‐7) | 7 (5‐7) | 0.63 |
| Laboratory parameters at admission: | |||
| Leukocyte count (× 109/L) | 11.6 (8.5‐17.0) | 11.2 (7.3‐16.4) | 0.27 |
| Neutrophils (× 109/L)b | 9.4 (6.8‐14.6) | 9.2 (5.4‐14.0) | 0.50 |
| Lymphocytes (× 109/L)b | 1.0 (0.6‐1.4) | 0.9 (0.4‐1.3) | 0.17 |
| Monocytes (× 109/L)b | 0.9 (0.5‐1.4) | 0.9 (0.5‐1.3) | 0.72 |
| Platelet count (× 109/L)c | 151 (100‐198) | 140 (107‐196) | 0.80 |
| Creatinine (mg/dL) | 0.7 (0.5‐1.1) | 0.7 (0.6‐1.0) | 0.77 |
| Total bilirubin (mg/dL) | 20.1 (15.3‐27.5) | 22.2 (14.4‐26.9) | 0.86 |
| International normalized ratio | 1.8 (1.6‐2.1) | 1.8 (1.6‐2.1) | 0.97 |
| Albumin (g/dL)d | 2.7 (2.3‐3.0) | 2.8 (2.4‐3.0) | 0.17 |
| Globulins (g/dL)d | 3.7 (3.1‐4.4) | 3.7 (3.0‐4.4) | 0.78 |
| Aspartate aminotransferase (U/L)e | 174 (117‐247) | 162 (126‐220) | 0.37 |
| Alanine aminotransferase LT (U/L) | 56 (40‐85) | 52 (32‐77) | 0.22 |
| Alkaline phosphatase (U/L) | 210 (164‐266) | 208 (137‐261) | 0.28 |
| Radiologic features:f | |||
| Nodular liver surface, n (%) | 81 (83%) | 62 (90%) | 0.19 |
| Hepatomegaly ≥16 cm, n (%) | 33 (34%) | 50 (72%) | <0.001 |
| Splenomegaly ≥13 cm, n (%) | 55 (56%) | 44 (64%) | 0.32 |
| Ascites, n (%) | 74 (76%) | 54 (78%) | 0.68 |
| Portosystemic collaterals, n (%) | 39 (40%) | 32 (46%) | 0.40 |
| Portal vein thrombosis, n (%) | 3 (3%) | 5 (7%) | 0.21 |
Quantitative data are expressed as median (25%‐75% quartiles). P values for statistical significance were calculated using chi‐squared tests for categorical variables and Kruskal‐Wallis rank‐sum tests for continuous variables.
Missing data for 28 patients (17 in the derivation cohort and 11 in the validation cohort).
Missing data for 6 patients in the validation cohort.
Missing data for 2 patients in the validation cohort.
Missing data for 1 patient in the validation cohort.
Missing data for 4 patients in the validation cohort.
Missing data for 5 patients (3 in the derivation cohort and 2 in the validation cohort).
HISTOLOGIC SCORES AND DIAGNOSTIC CLASSIFICATION
Using the histologic scores for hepatocyte ballooning, Mallory‐Denk bodies, and lobular inflammation, 95 patients (55%) met criteria for definite AH: 54 (53%) in the derivation cohort and 41 (58%) in the validation cohort. Eleven patients in each cohort (11% of the derivation cohort, 15% of the validation cohort, and 13% overall) had no evidence of AH based on histologic scores. The remaining 55 patients (32%) had possible AH, of whom 54 patients had mild to moderate (1‐2+) lobular inflammation in combination with focal (1+) hepatocyte ballooning and/or rare (1+) Mallory‐Denk bodies. One patient in the derivation cohort had possible AH with moderate (2+) lobular inflammation but without evidence of hepatocyte degeneration. Similar proportions of patients in each diagnostic group were exposed to presumptive corticosteroid treatment prior to biopsy (23% of patients with definite AH, 25% of patients with possible AH, and 5% of patients with no AH; P = 0.11).
Histologic features according to patients' diagnostic classification are summarized in Table 2. All patients had at least mild portal fibrosis, and a majority (61%) had cirrhosis. Compared to patients without AH, patients with definite AH had more advanced portal fibrosis (P = 0.04) and more sinusoidal collagen (P = 0.001). Lobular inflammation tended to be predominantly neutrophils in patients with definite AH (76%) and predominantly lymphocytes or mixed in patients with possible or no AH (59% and 60%, respectively, P < 0.001). Satellitosis was absent in all the patients without AH. Fatty change was seen in all but 1 patient and affected at least 25% of hepatocytes in more than half of patients in each diagnostic group. However, patients without AH were more likely to have 4+ fatty change (68%) and microvesicular or mixed‐type fat (32%) than patients with definite AH (20% with 4+ fatty change, P < 0.001; 6% with microvesicular or mixed fat, P = 0.002). The distributions of histologic features were similar for patients in the derivation and validation cohorts (Supporting Table S2).
Table 2.
HISTOLOGIC SCORES OF PATIENTS STRATIFIED BY THEIR DIAGNOSTIC CLASSIFICATION IN THE COMBINED DERIVATION AND VALIDATION COHORTS
| Histologic feature |
Definite AH (n = 95) |
Possible AH (n = 55) |
No AH (n = 22) |
P |
|---|---|---|---|---|
| Hepatocyte ballooning:a | <0.001 | |||
| 0 (absent) | 2 (2%) | 8 (15%) | 22 (100%) | |
| 1+ (mild/focal) | 46 (48%) | 47 (85%) | 0 (0%) | |
| 2+ (moderate/marked) | 47 (49%) | 0 (0%) | 0 (0%) | |
| Mallory‐Denk bodies:a | <0.001 | |||
| 0 (absent) | 0 (0%) | 14 (25%) | 22 (100%) | |
| 1+ (rare) | 2 (2%) | 41 (75%) | 0 (0%) | |
| 2+ (easily seen) | 64 (67%) | 0 (0%) | 0 (0%) | |
| 3+ (marked/diffuse) | 29 (31%) | 0 (0%) | 0 (0%) | |
| Lobular inflammation, degree:a | <0.001 | |||
| 0 (absent) | 0 (0%) | 0 (0%) | 2 (9%) | |
| 1+ (mild/focal) | 26 (27%) | 42 (76%) | 20 (91%) | |
| 2+ (moderate) | 49 (52%) | 13 (24%) | 0 (0%) | |
| 3+ (severe) | 20 (21%) | 0 (0%) | 0 (0%) | |
| Lobular inflammation, predominant cell type: | <0.001 | |||
| Mostly neutrophils | 72 (76%) | 23 (42%) | 8 (40%) | |
| Mixed (∼50:50) | 21 (22%) | 19 (35%) | 5 (25%) | |
| Mostly lymphocytes | 2 (2%) | 13 (24%) | 7 (35%) | |
| Portal fibrosis: | 0.20 | |||
| 0 (absent) | 0 (0%) | 0 (0%) | 0 (0%) | |
| 1+ (mild) | 6 (6%) | 3 (5%) | 5 (23%) | |
| 2+ (moderate with rare bridging) | 7 (7%) | 6 (11%) | 2 (9%) | |
| 3+ (moderate with severe bridging) | 24 (25%) | 11 (20%) | 3 (14%) | |
| 4+ (cirrhosis) | 58 (61%) | 35 (64%) | 12 (55%) | |
| Sinusoidal collagen: | <0.001 | |||
| 0 (absent) | 0 (0%) | 0 (0%) | 0 (0%) | |
| 1+ (focal and rare) | 12 (13%) | 17 (31%) | 10 (45%) | |
| 2+ (focal and moderate) | 54 (57%) | 38 (69%) | 11 (50%) | |
| 3+ (diffuse) | 29 (31%) | 0 (0%) | 1 (5%) | |
| Fatty change, degree: | 0.001 | |||
| 0 (absent) | 1 (1%) | 0 (0%) | 0 (0%) | |
| <1+ (scanty, <5%) | 9 (9%) | 4 (7%) | 3 (14%) | |
| 1+ (5‐25%) | 25 (26%) | 9 (16%) | 0 (0%) | |
| 2+ (26‐50%) | 19 (20%) | 9 (16%) | 0 (0%) | |
| 3+ (51‐75%) | 22 (23%) | 6 (11%) | 4 (18%) | |
| 4+ (>75%) | 19 (20%) | 27 (49%) | 15 (68%) | |
| Fatty change, predominant cell type: | 0.002 | |||
| Macrovesicular | 89 (94%) | 52 (95%) | 15 (68%) | |
| Mixed (∼50:50) | 5 (5%) | 3 (5%) | 5 (23%) | |
| Microvesicular | 1 (1%) | 0 (0%) | 2 (9%) | |
| Fatty change, zonal accentuation: | 0.001 | |||
| Diffuse | 41 (44%) | 32 (58%) | 19 (86%) | |
| Scattered | 53 (56%) | 23 (42%) | 3 (14%) | |
| Satellitosis: | <0.001 | |||
| Absent | 30 (32%) | 42 (76%) | 22 (100%) | |
| Present | 65 (68%) | 13 (24%) | 0 (0%) | |
| Apoptosis: | 0.37 | |||
| 0 (absent) | 85 (89%) | 51 (93%) | 18 (82%) | |
| 1+ (rare) | 10 (11%) | 4 (7%) | 4 (18%) | |
| 2+ (common) | 0 (0%) | 0 (0%) | 0 (0%) | |
| Cholestasis, degree: | 0.66 | |||
| 0 (absent) | 33 (35%) | 18 (33%) | 9 (41%) | |
| 1+ (infrequent) | 44 (46%) | 22 (40%) | 10 (45%) | |
| 2+ (prominent) | 18 (19%) | 15 (27%) | 3 (14%) | |
| Bile in ductules: | 0.94 | |||
| Absent | 70 (74%) | 39 (71%) | 16 (73%) | |
| Present | 25 (26%) | 16 (29%) | 6 (27%) | |
| Portal inflammation, degree: | 0.03 | |||
| 0 (absent) | 0 (0%) | 0 (0%) | 0 (0%) | |
| 1+ (mild) | 22 (23%) | 23 (42%) | 11 (50%) | |
| 2+ (moderate) | 70 (74%) | 32 (58%) | 11 (50%) | |
| 3+ (marked) | 3 (3%) | 0 (0%) | 0 (0%) | |
| Portal inflammation, predominant cell type: | 0.001 | |||
| Mostly neutrophils | 15 (16%) | 6 (11%) | 0 (0%) | |
| Mixed (∼50:50) | 51 (54%) | 17 (31%) | 6 (27%) | |
| Mostly lymphocytes | 29 (31%) | 32 (58%) | 16 (73%) | |
| Periportal interface inflammation, degree: | 0.08 | |||
| 0 (absent) | 94 (99%) | 54 (98%) | 20 (91%) | |
| 1+ (mild, involving some PTs) | 1 (1%) | 1 (2%) | 2 (9%) | |
| 2+ (moderate/severe, involving most PTs) | 0 (0%) | 0 (0%) | 0 (0%) | |
| Bile duct proliferation: | 0.84 | |||
| 0 (normal bile ducts) | 3 (3%) | 2 (4%) | 1 (5%) | |
| 1+ (mild proliferation/ectasia) | 53 (56%) | 33 (60%) | 10 (45%) | |
| 2+ (moderate/marked proliferation/ectasia) | 39 (41%) | 20 (36%) | 11 (50%) | |
| Bile duct inflammation, degree: | 0.81 | |||
| 0 (absent) | 91 (96%) | 53 (96%) | 22 (100%) | |
| 1+ (periductal without cholangitis) | 3 (3%) | 2 (4%) | 0 (0%) | |
| 2+ (cholangitis) | 1 (1%) | 0 (0%) | 0 (0%) | |
| Bile duct inflammation, predominant cell type: | ‐‐ | |||
| Mostly neutrophils | 4 (100%) | 2 (100%) | ‐‐ | |
| Mixed (∼50:50) | 0 (0%) | 0 (0%) | ||
| Mostly lymphocytes | 0 (0%) | 0 (0%) | ||
| Iron deposition, degree:b | 0.77 | |||
| 0 (absent) | 70 (76%) | 37 (71%) | 15 (68%) | |
| <1+ (scanty, <5%) | 5 (5%) | 3 (6%) | 2 (9%) | |
| 1+ (5‐25%) | 5 (5%) | 6 (12%) | 2 (9%) | |
| 2+ (26‐50%) | 8 (9%) | 3 (6%) | 3 (14%) | |
| 3+ (51‐75%) | 4 (4%) | 2 (4%) | 0 (0%) | |
| 4+ (76‐100%) | 0 (0%) | 1 (2%) | 0 (0%) | |
| Iron deposition, bile duct staining:b | 0.33 | |||
| 0 (absent) | 92 (100%) | 51 (98%) | 22 (100%) | |
| 1+ (some ducts/ductules involved) | 0 (0%) | 1 (2%) | 0 (0%) | |
| 2+ (most ducts/ductules involved) | 0 (0%) | 0 (0%) | 0 (0%) |
Data are expressed as n (%). P values for statistical significance were calculated using chi‐squared tests.
Used for histologic classifications. Definite AH was defined by the presence of (a) 1‐3+ lobular inflammation and (b) 2+ hepatocyte ballooning or 2‐3+ Mallory‐Denk bodies. No AH was defined by (a) 0‐1+ lobular inflammation, (b) absent hepatocyte ballooning, and (c) absent Mallory‐Denk bodies. Patients not meeting these criteria for definite AH or no AH were classified as possible AH.
Missing data for 6 patients (4 in the derivation cohort and 2 in the validation cohort) due to iron stain being inadequate or unavailable.
Abbreviation: PT, portal tract.
MODEL DERIVATION FOR PREDICTING HISTOLOGIC AH
Prediction models excluded patients classified as having possible AH (36 in the derivation cohort and 19 in the validation cohort) whose diagnosis was uncertain. Models also excluded patients with definite AH or no AH but who had active infection at admission or prior to the date of biopsy (13 in the derivation cohort and 10 in the validation cohort).
In order to develop a model for predicting histologic AH, we compared the clinical features of 44 uninfected patients with definite AH and 8 uninfected patients without AH in the derivation cohort (Table 3). Disease severity scores were similar in both groups. The patients with definite AH had a higher median leukocyte count (13.6 × 10⁹/L versus 9.6 × 10⁹/L; Kruskal‐Wallis, P = 0.01), lower median aspartate aminotransferase (158 versus 236 U/L; Kruskal‐Wallis, P = 0.003), and lower median alanine aminotransferase (48 versus 74 U/L; Kruskal‐Wallis, P = 0.04) at admission. Radiologic evidence of liver surface nodularity was more common among uninfected patients with definite AH (83% versus 50%; chi‐squared, P = 0.04). Higher peripheral blood leukocyte or neutrophil counts were not indicative of more recent alcohol consumption (Supporting Fig. S1). A nodular liver surface was present for each of the 25 uninfected patients with histologic evidence of cirrhosis (22 patients with definite AH and 3 patients without AH), as well as for 14 uninfected patients with F1‐F3 portal fibrosis (13 patients with definite AH and 1 patient without AH). In the full derivation cohort (including infected patients and those with possible AH), liver surface nodularity was 98% sensitive and 35% specific for having histologic cirrhosis.
Table 3.
CLINICAL CHARACTERISTICS OF UNINFECTED PATIENTS STRATIFIED BY THEIR DIAGNOSTIC CLASSIFICATION AND ASSOCIATIONS WITH THE PRESENCE OF DEFINITE AH (VERSUS NO AH)
| Derivation Cohort | Validation Cohort | |||||||
|---|---|---|---|---|---|---|---|---|
| Variable |
Definite AH (n = 44) |
No AH (n = 8) |
OR | P |
Definite AH (n = 35) |
No AH (n = 7) |
OR | P |
| Clinical features: | ||||||||
| Male sex, n (%) | 32 (73%) | 6 (75%) | 0.9 | 0.89 | 30 (86%) | 6 (86%) | 1.0 | 1.00 |
| Hispanic ethnicity, n (%) | 39 (89%) | 7 (88%) | 1.1 | 0.93 | 29 (83%) | 5 (71%) | 1.9 | 0.49 |
| Age (years) | 43 (37‐54) | 39 (37‐44) | 1.1 | 0.29 | 46 (40‐49) | 42 (35‐50) | 1.0 | 0.40 |
| Disease severity scores: | ||||||||
| DF | 54 (41‐65) | 55 (32‐84) | 1.0 | 0.64 | 49 (39‐63) | 40 (20‐47) | 1.0 | 0.13 |
| MELD | 18 (16‐21) | 18 (14‐22) | 1.0 | 0.56 | 18 (16‐20) | 16 (10‐18) | 1.1 | 0.33 |
| ABIC | 7.8 (6.9‐9.2) | 7.3 (6.9‐7.6) | 1.6 | 0.17 | 7.8 (6.8‐8.7) | 7.0 (6.3‐8.2) | 1.9 | 0.15 |
| GAH | 9 (8‐10) | 8 (7‐9) | 1.7 | 0.11 | 9 (8‐10) | 7 (7‐9) | 1.6 | 0.14 |
| AHHS | 5 (5‐7) | 7 (4‐8) | 0.8 | 0.27 | 5 (5‐7) | 7 (4‐7) | 0.8 | 0.40 |
| Laboratory parameters: | ||||||||
| Leukocyte count (× 109/L) | 13.6 (10.2‐19.2) | 9.6 (8.8‐10.2) | 1.2 | 0.06 | 14.0 (8.4‐19.6) | 4.9 (4.3‐9.6) | 1.1 | 0.09 |
| Neutrophils (× 109/L)a | 11.0 (8.1‐16.0) | 7.3 (6.9‐9.0) | 1.3 | 0.06 | 10.9 (6.8‐15.7) | 3.4 (2.7‐8.6) | 1.2 | 0.10 |
| Lymphocytes (× 109/L)a | 1.0 (0.7‐1.4) | 0.9 (0.6‐1.5) | 1.1 | 0.88 | 0.9 (0.3‐1.4) | 1.1 (0.2‐1.3) | 1.2 | 0.85 |
| Monocytes (× 109/L)a | 0.9 (0.6‐1.4) | 0.8 (0.3‐1.0) | 3.3 | 0.20 | 0.9 (0.6‐1.3) | 0.6 (0.4‐0.9) | 2.0 | 0.46 |
| Platelet count (× 109/L) | 168 (122‐210) | 121 (75‐164) | 1.0 | 0.12 | 158 (119‐205) | 127 (87‐290) | 1.0 | 0.83 |
| Creatinine (mg/dL) | 0.8 (0.5‐1.0) | 0.5 (0.5‐0.7) | 2.7 | 0.13 | 0.6 (0.5‐0.9) | 0.6 (0.5‐0.8) | 0.9 | 0.89 |
| Total bilirubin (mg/dL) | 22.6 (14.5‐29.1) | 17.7 (16.0‐21.0) | 1.0 | 0.34 | 21.7 (14.1‐29.0) | 17.7 (11.8‐26.9) | 1.0 | 0.36 |
| International normalized ratio | 1.7 (1.6‐2.0) | 1.9 (1.3‐2.6) | 0.5 | 0.33 | 1.8 (1.6‐2.0) | 1.6 (1.4‐1.8) | 5.6 | 0.23 |
| Albumin (g/dL) | 2.7 (2.3‐3.0) | 2.8 (2.4‐3.2) | 0.6 | 0.53 | 2.8 (2.4‐3.0) | 2.5 (2.4‐3.0) | 0.8 | 0.86 |
| Globulins (g/dL) | 3.8 (3.1‐4.4) | 3.4 (3.2‐4.8) | 1.0 | 0.99 | 4.1 (3.6‐4.7) | 3.0 (2.4‐4.7) | 2.2 | 0.10 |
| Aspartate aminotransferase (U/L) | 158 (114‐214) | 236 (213‐387) | 0.9 | 0.04 | 164 (115‐204) | 210 (153‐258) | 0.9 | 0.09 |
| Alanine aminotransferase (U/L) | 48 (40‐74) | 74 (64‐99) | 0.9 | 0.04 | 45 (28‐63) | 52 (48‐90) | 1.0 | 0.17 |
| Alkaline phosphatase (U/L) | 212 (172‐257) | 336 (176‐381) | 1.0 | 0.26 | 222 (156‐268) | 181 (136‐518) | 1.0 | 0.50 |
| Radiologic features:b | ||||||||
| Nodular liver surface, n (%) | 35 (83%) | 4 (50%) | 5.0 | 0.05 | 32 (94%) | 5 (71%) | 6.4 | 0.09 |
| Hepatomegaly ≥16 cm, n (%) | 15 (36%) | 5 (63%) | 0.3 | 0.17 | 26 (76%) | 4 (57%) | 2.4 | 0.30 |
| Splenomegaly ≥13 cm, n (%) | 24 (57%) | 4 (50%) | 1.3 | 0.71 | 25 (74%) | 2 (29%) | 6.9 | 0.04 |
| Ascites, n (%) | 32 (76%) | 5 (63%) | 1.9 | 0.42 | 27 (79%) | 5 (71%) | 1.5 | 0.64 |
| Portosystemic collaterals, n (%) | 18 (43%) | 4 (50%) | 0.8 | 0.71 | 13 (38%) | 4 (57%) | 0.5 | 0.36 |
| Portal vein thrombosis, n (%) | 1 (2%) | 1 (13%) | 0.2 | 0.23 | 4 (12%) | 0 (0%) | ‐‐ | ‐‐ |
Quantitative data are expressed as median (25%‐75% quartiles). Magnitude and significance of associations were calculated using univariate logistic regression models.
Missing data for 2 patients with definite AH in the validation cohort.
Missing data for 3 patients with definite AH in the derivation cohort and 1 patient with definite AH in the validation cohort.
Abbreviation: OR, odds ratio.
In multivariate analysis, only admission leukocyte count and liver surface nodularity were independent predictors of histologic AH. The AUROC of the model that included only the leukocyte count was 0.81 but improved to 0.88 with the addition of liver surface nodularity. The final, multivariate model obtained from the derivation cohort is shown in Table 4. Using this model, the risk scores for individual patients for having AH were calculated using the following formula: 2.02 × liver surface nodularity (no = 0, yes = 1) + 0.31 × leukocyte count at admission (× 109/L) – 3.34. Likewise, AH probability scores were calculated using the following formula: e(risk score) / [1 + e(risk score)] × 100. We identified a risk score threshold of ≥1.76 as maximizing Youden's index (the sum of the model's sensitivity and specificity) as well as ensuring 100% specificity for the diagnosis of AH.
Table 4.
MULTIVARIABLE ASSOCIATIONS BETWEEN PREDICTORS AND PRESENCE OF DEFINITE AH (VERSUS NO AH) AMONG 50 UNINFECTED PATIENTS IN THE DERIVATION COHORT
| Variable | B | OR (95% CI) | P | AIC | AUROC (95% CI) |
|---|---|---|---|---|---|
| Full score | – | – | – | 37.88 | 0.88 (0.77‐0.97) |
| Leukocyte count | 0.31 | 1.36 (1.02‐1.80) | 0.03 | 40.53 | 0.81 (0.68‐0.94) |
| Nodular liver surface | 2.02 | 7.55 (1.13‐50.06) | 0.04 | 44.21 | 0.67 (0.47‐0.86) |
| Intercept | −3.34 | – | – | – | – |
Abbreviations: AIC, Akaike's information criterion; OR, odds ratio.
For practical applications as an alternative to the risk score‐based model, a simplified stratified model using separate leukocyte count thresholds for patients with and without liver surface nodularity was created. Leukocyte count thresholds of ≥10 × 109/L and ≥14 × 109/L for patients with and without liver surface nodularity, respectively, maximized Youden's index (the sum of the model's sensitivity and specificity) and ensured 100% specificity for diagnosis of AH in the derivation cohort. The sensitivities of these thresholds were 79% and 75% in patients with and without liver surface nodularity, respectively. There were no low leukocyte count thresholds that reliably excluded the diagnosis of AH. The AUROC of the stratified model in the derivation cohort was 0.89 (95% CI, 0.83‐0.96).
PERFORMANCE AND VALIDATION OF THE MODELS
The predictive performance of the multivariate (score‐based) model and the stratified model was evaluated in the derivation and validation cohorts using the optimal thresholds identified above (Table 5; Fig. 2). The models had similar performance in the derivation cohort and equal performance in the validation cohort. The AUROC of the models in the validation cohort was 0.72 (95% CI, 0.56‐0.89). Among uninfected patients in the validation cohort, the predictive models correctly classified 86% of patients without AH and 59% of patients with definite AH. Only 1 patient without AH based on histologic scores was incorrectly predicted to have AH based on the predictive models. That patient had been originally diagnosed as having AH and cirrhosis based on the pathology report generated during hospitalization. In a second unblinded review of the patient's biopsy slides, it was determined that Mallory‐Denk bodies had been underscored, resulting in an incorrect classification of no AH.
Table 5.
OPERATING CHARACTERISTICS OF THE SCORE‐BASED PREDICTION MODELa AND STRATIFIED PREDICTION MODELb FOR HISTOLOGIC AH AMONG UNINFECTED PATIENTS
| Derivation Cohort (n = 50) | Validation Cohort (n = 41) | |||
|---|---|---|---|---|
| Score‐Based Model | Stratified Model | Score‐Based Model | Stratified Model | |
| Patients: | ||||
| True positive | 32 | 33 | 20 | 20 |
| False positive | 0 | 0 | 1 | 1 |
| True negative | 8 | 8 | 6 | 6 |
| False negative | 10 | 9 | 14 | 14 |
| Operating characteristics: | ||||
| AUROC | 0.88 (0.82‐0.95) | 0.89 (0.83‐0.96) | 0.72 (0.56‐0.89) | 0.72 (0.56‐0.89) |
| Sensitivity (%) | 76 (61‐88) | 79 (63‐90) | 59 (41‐75) | 59 (41‐75) |
| Specificity (%) | 100 (63‐100) | 100 (63‐100) | 86 (42‐100) | 86 (42‐100) |
| PPV (%) | 100 (89‐100) | 100 (89‐100) | 95 (76‐100) | 95 (76‐100) |
| NPV (%) | 44 (22‐69) | 47 (23‐72) | 30 (12‐54) | 30 (12‐54) |
| LR‐positive | ‐‐ | ‐‐ | 4.1 (0.7‐25.8) | 4.1 (0.7‐25.8) |
| LR‐negative | 0.2 (0.1‐0.4) | 0.2 (0.1‐0.4) | 0.5 (0.3‐0.8) | 0.5 (0.3‐0.8) |
Excluded patients with possible AH based on histologic scores, due to diagnostic uncertainty.
Operating characteristics are shown with 95% confidence intervals.
Identified patients as having AH if they had a risk score ≥1.76 and as having no AH otherwise, where the risk score for an individual patient was calculated using the following formula: 2.02 × liver surface nodularity (no = 0, yes = 1) + 0.31 × leukocyte count at admission (× 109/L) – 3.34.
Identified patients as having AH if they had (a) an admission leukocyte count ≥14 × 109/L or (b) liver surface nodularity and an admission leukocyte count ≥10 × 109/L, and identified patients as having no AH otherwise.
Abbreviations: LR, likelihood ratio; NPV, negative predictive value; PPV, positive predictive value.
Figure 2.
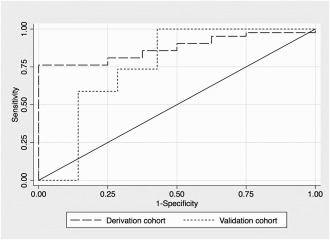
ROC curves for a multivariate score‐based model for prediction of histologic AH in the derivation and validation cohorts.
Using the stratified model, a proposed diagnostic algorithm for patients suspected of having AH was developed (Fig. 3). The algorithm identified 43% of patients in the entire study population as having AH based on clinical criteria alone, including 20 of the 55 patients (36%) who were initially classified as having possible AH based on biopsy. Using this algorithm would have avoided liver biopsy in 43% of the study patients.
Figure 3.
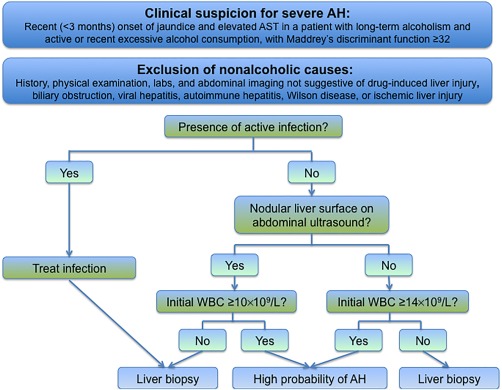
Proposed algorithm for diagnosis of AH, using the stratified prediction model. Abbreviations: AST, aspartate aminotransferase; WBC, white blood count.
RELIABILITY OF THE HISTOLOGIC CLASSIFICATION AND SCORES (DERIVATION COHORT)
Analysis of the interobserver agreement for histologic scores among three liver pathologists showed excellent agreement for the degree of fatty change (intraclass correlation coefficient [ICC], 0.89; 95% CI, 0.85‐0.92), good agreement for the stage of portal fibrosis (ICC, 0.60; 95% CI, 0.49‐0.69), degree of lobular inflammation (ICC, 0.65; 95% CI, 0.55‐0.73), and presence of Mallory‐Denk bodies (ICC, 0.68; 95% CI, 0.59‐0.76) and fair agreement for the presence of hepatocyte ballooning (ICC, 0.40; 95% CI, 0.27‐0.52). The histologic scores from our main study pathologist for Mallory‐Denk bodies, degree of fatty change, and sinusoidal collagen were strongly correlated with the respective quantitative measurements of those features obtained through digital morphometrics (Supporting Fig. S2). Histologic scores for the degree of lobular inflammation were strongly correlated with peripheral blood leukocyte and neutrophil counts at admission (Supporting Fig. S3).
For the diagnostic groups defined based on the histologic scores for patients in the derivation cohort, there was fair agreement among the three pathologists (ICC, 0.48; 95% CI, 0.36‐0.59) and excellent agreement with a diagnosis of AH or its absence from the original pathology reports during hospitalization (ICC excluding patients with possible AH, 0.90; 95% CI, 0.84‐0.94). Of the 11 patients in the derivation cohort classified based on histologic scores as having no AH, only 1 had been originally diagnosed as having AH and cirrhosis. Six patients had alcoholic foamy degeneration (including 2 patients with concomitant cirrhosis). The other 4 patients had alcoholic fatty liver with jaundice (including 3 patients with cirrhosis).
TREATMENT AND OUTCOMES (DERIVATION COHORT)
Almost three quarters (74%) of patients in the derivation cohort were treated with corticosteroids. Compared to patients with possible or no AH, patients with definite AH were more likely to have received steroids (85% versus 67% versus 45%, respectively; P = 0.01) and to have had a treatment duration of at least 7 days (81% versus 44% versus 27%, respectively; P < 0.001). Among those who received treatment with corticosteroids for at least 7 days, 9 of 44 (20%) patients with definite AH and 4 of 16 (25%) patients with possible AH were Lille responders. During hospitalization, the proportions of patients who experienced liver‐related complications were similar for the three groups (Supporting Table S3).
Patients in the derivation cohort had follow‐up for a median of 149 days (interquartile range, 37‐570 days) after admission. One patient, classified as having definite AH, underwent liver transplantation 139 days after admission. Short‐term (60‐day) survival was 72%, and long‐term (180‐day) survival was 65%. There were no significant differences in survival between the three diagnostic groups (Supporting Fig. S4) in univariate models or after adjustment for confounders (adjusted hazard ratio for possible AH versus definite AH, 1.05; 95% CI, 0.51‐2.13; P = 0.90; adjusted hazard ratio for no AH versus definite AH, 1.32; 95% CI, 0.36‐4.75; P = 0.67). No deaths occurred within the first 30 days after admission among patients without AH.
In univariate models among patients with definite or possible AH, age, admission levels of serum creatinine and international normalized ratio, and laboratory‐based disease severity scores at admission were predictive of mortality (Supporting Table S4). Mortality was not predicted by the AHHS (Supporting Fig. S5) or by the histologic scores from which it was calculated (Supporting Table S5). However, after adjustment for the ABIC score, mortality was independently predicted by the degree of fatty change seen histologically (Supporting Fig. S6), with a 2.4 times higher risk of mortality at 180 days for patients with ≤50% fatty change compared to patients with >50% fatty change (adjusted 95% CI, 1.14‐4.92; P = 0.02).
Discussion
The need for liver biopsy in the evaluation of patients with AH is controversial.4 In this study, biopsy revealed a different diagnosis in 13% of patients with a clinical diagnosis of severe AH. This proportion, while lower than reported,5, 6, 7 nonetheless highlights the important role of liver biopsy in distinguishing AH from other causes of acute‐on‐chronic liver injury in heavy drinkers.10
We evaluated the relationships of clinical parameters and obtained histology in a large cohort of patients with clinically apparent severe AH. Results were used to develop and validate a novel model that can be used to noninvasively diagnose AH with near‐perfect specificity. Application of this simple model would obviate the need for liver biopsy in more than a third of patients. The model has similar performance to other noninvasive methods to diagnose AH, including the AshTest20, 21 and the recently proposed measurement of circulating fragments of cytokeratin‐18.7 Unlike those models, our model uses only two simple components, initial serum leukocyte count and ultrasonographic evidence of a nodular liver surface, which are routinely included in the evaluation of patients with jaundice and abnormal liver tests. Our algorithm is a pragmatic approach to diagnosing AH and avoiding universal liver biopsy until new biomarkers become widely available.
Leukocytosis in patients without active infection was highly specific for AH and correlated with the degree of hepatic lobular inflammation. These findings are consistent with prior reports of leukocytosis being more prevalent among patients with biopsy‐proven AH than among patients with alcoholic foamy degeneration22 or alcoholic cirrhosis alone.6 Leukocytosis reflects activation of innate immunity and is one of the criteria for the presence of the systemic inflammatory response syndrome, which is present in almost half of patients with AH and predicts development of multiple organ failure and death.23, 24 In contrast, leukocytosis and hepatic neutrophil infiltration may predict a good prognosis for treated patients with AH,12, 25 possibly by promoting liver regeneration.26 In our study, we were unable confirm prognostic roles for leukocytosis or hepatic lobular inflammation. These associations may have been biased toward the null due to higher rates of corticosteroid treatment in studied patients with marked leukocytosis or prominent hepatic inflammation. Although it has been suggested that elevated circulating levels of neutrophils are an indicator of more recent alcohol consumption,27 we did not observe an inverse correlation between pre‐admission duration of alcohol sobriety and leukocyte or neutrophil counts in our cohort. However, more precise quantitation of alcohol consumption was not available in this retrospective study and might have revealed a relationship to increased neutrophils.
Radiographic liver surface nodularity was associated with increased histologic confirmation of AH. This finding is largely explained by a higher prevalence of advanced fibrosis or cirrhosis among patients with AH compared to those without AH. Liver surface nodularity was highly sensitive for cirrhosis in our population, a characteristic that differs from patients with chronic viral hepatitis.28 Patients with cirrhosis also have a higher prevalence of cytopenias related to hypersplenism than the general population,29 and this might explain why a lower threshold for leukocytosis maintained high specificity for AH for patients in our study with liver surface nodularity. Liver surface nodularity was not, however, specific for cirrhosis and was also present in several patients with AH with less advanced hepatic fibrosis. This may be due to extensive sinusoidal collagen deposition in AH causing formation of “pseudo‐nodules.” We also cannot exclude the possibility of some misclassification as radiographic liver surface nodularity is a somewhat subjective finding that may be influenced by image quality and radiologist experience.
A secondary aim of this study was to describe the outcomes of patients with a clinical diagnosis of AH but with equivocal or no histologic evidence of necroinflammation. No deaths occurred within the first month among patients without histologic AH. This favorable outcome is consistent with the rapid recovery with alcohol abstinence also reported in case series of patients with alcoholic foamy degeneration or alcoholic fatty liver with jaundice.22, 30, 31, 32, 33, 34 There is no proven role for corticosteroids in these patients as alcoholic liver injury without AH does not appear to be related to immune system activation. Alcoholic liver injury in patients with alcoholic foamy degeneration may be related to reactive oxygen species‐mediated mitochondrial DNA damage.35, 36 The distinct mechanism leading to bland cholestasis in patients with alcoholic fatty liver with jaundice has not been reported and deserves further investigation.
Management of patients with equivocal histologic findings of AH, i.e., milder lobular inflammation and only focal evidence of hepatocyte ballooning and Mallory‐Denk bodies, is challenging. Our predictive model identified over a third of the patients in this subset as having AH. All the patients in the group met the minimum diagnostic criteria for biopsy‐proven AH used in recent clinical trials37, 38 and cohort studies.7, 12 In our study, patients with equivocal AH had disease severity scores and transplant‐free survival similar to those of patients with unequivocal AH, but a smaller proportion of patients in the former group received treatment with corticosteroids. It is possible that patients with equivocal histologic findings but meeting clinical criteria for severe AH have other causes of acute‐on‐chronic liver injury, such as bland alcohol‐induced cholestasis or unrecognized infections superimposed on mild AH. Whether this subset of patients benefits from treatment with corticosteroids or other anti‐inflammatory therapies remains unproven. We suggest that future therapeutic studies consider stratifying patients with biopsy‐proven AH into those with unequivocal versus equivocal histology in order to address this important question.
We confirmed the prognostic capability of laboratory‐based AH severity scores, including Maddrey's DF and MELD, ABIC, and GAH scores, but not the histology‐based AHHS.12 Exclusion of megamitochondria (seen infrequently in obtained specimens) from our AHHS calculations limited the score's observed range in patients and may have led to systematic bias toward the null in the observed associations between AHHS and mortality. However, we also failed to find any prognostic associations for the other individual histologic components of the AHHS. On the other hand, we found a strong association between mortality risk and histologic evidence of low‐grade steatosis. A similar association was reported in a French cohort of patients with severe AH who were treated with prednisolone.39 In that report, the 1‐year survival rate was 31% for patients with steatosis <20% compared to 85% among patients with steatosis ≥20%.39 The authors hypothesized that low‐grade steatosis may indicate more advanced fibrosis with gradual disappearance of steatosis as is seen in late stages of nonalcoholic steatohepatitis.40 In our study, a less conservative threshold of steatosis <50% had prognostic value whereas the degree of portal fibrosis was not independently predictive of short‐ or long‐term mortality. Beyond the inverse correlation that exists between the degree of steatosis and the degree of portal fibrosis, low‐grade steatosis may represent a phenotype of acute‐on‐chronic liver injury among alcoholics that is more severe or refractory to treatment.
We were unable to develop a model that reliably excluded AH without liver biopsy. This may have been in part due to the relatively small number of patients without AH in our study and is worthy of future study. Another limitation was that our definitions for the diagnostic groups relied on subjective histologic scores with suboptimal intraobserver and interobserver agreement. This limitation is best illustrated by the patient diagnosed with AH during hospitalization and predicted to have AH based on our model but whose biopsy specimen was underscored with regard to Mallory‐Denk bodies. Underscoring resulted in the patient being incorrectly classified as having no AH and reduced the observed specificity of our model from 100% to 86% in the validation cohort. The reproducibility of our histologic scores might have been improved with use of a training protocol12 or specialized immunohistochemical stains.5 Use of cytokeratin (CAM 5.2) stain aided detection of Mallory‐Denk bodies in our digital morphometrics analysis and has been reported to improve detection of hepatocyte ballooning.5 Finally, sampling error with liver biopsy may have led to underestimation of AH features in patients who we classified as having equivocal or no AH. Studies of paired liver biopsies among patients with nonalcoholic steatohepatitis showed that there is substantial sampling variability for features of necroinflammation, including hepatocyte ballooning, lobular inflammation, and Mallory‐Denk bodies.41, 42 It is unlikely that such misclassification was prevalent in our population, as had it been, we would expect to have seen worse survival among untreated patients without AH.
In summary, the combination of an elevated leukocyte count and a nodular liver surface in the absence of active infection retrospectively identified patients with a high likelihood of histologic AH for whom liver biopsy may not be necessary. For patients with suspected severe AH who do not fulfill these criteria, liver biopsy is important to exclude other variants of alcoholic liver disease.
Supporting information
Additional Supporting Information may be found at onlinelibrary.wiley.com/doi/10.1002/hep4.1119/full
Supporting Information 1
Potential conflict of interest: Nothing to report.
Supported by the National Institute of Diabetes and Digestive and Kidney Diseases (P30DK48522, to A.A.S. and N.K.) and the National Institute on Alcohol Abuse and Alcoholism (5P50AA11999, to S.W.F. and N.K.; U01 AA021884, tor A.A.S, J.A.D., and N.K.).
REFERENCES
- 1. Lucey MR, Mathurin P, Morgan TR. Alcoholic hepatitis. N Engl J Med 2009;360:2758‐2769. [DOI] [PubMed] [Google Scholar]
- 2. European Association for the Study of Liver . EASL clinical practical guidelines: management of alcoholic liver disease. J Hepatol 2012;57:399‐420. [DOI] [PubMed] [Google Scholar]
- 3. Baptista A, Bianchu L, de Groote J, Desmet VJ, Gedigk P, Korb G, et al. Alcoholic liver disease: morphological manifestations. Lancet 1981;1:707‐711. [PubMed] [Google Scholar]
- 4. Forrest EH, Gleeson D. Is a liver biopsy necessary in alcoholic hepatitis? J Hepatol 2012;56:1427‐1428; author reply 1428‐1429. [DOI] [PubMed] [Google Scholar]
- 5. Mookerjee RP, Lackner C, Stauber R, Stadlbauer V, Deheragoda M, Aigelsreiter A, et al. The role of liver biopsy in the diagnosis and prognosis of patients with acute deterioration of alcoholic cirrhosis. J Hepatol 2011;55:1103‐1111. [DOI] [PubMed] [Google Scholar]
- 6. Hardy T, Wells C, Kendrick S, Hudson M, Day CP, Burt AD, et al. White cell count and platelet count associate with histological alcoholic hepatitis in jaundiced harmful drinkers. BMC Gastroenterol 2013;13:55. [DOI] [PMC free article] [PubMed] [Google Scholar]
- 7. Bissonnette J, Altamirano J, Devue C, Roux O, Payancé A, Lebrec D, et al. A prospective study of the utility of plasma biomarkers to diagnose alcoholic hepatitis. Hepatology 2017;66:555‐563. [DOI] [PubMed] [Google Scholar]
- 8. Dhanda AD, Collins PL, McCune CA. Is liver biopsy necessary in the management of alcoholic hepatitis? World J Gastroenterol 2013;19:7825‐7829. [DOI] [PMC free article] [PubMed] [Google Scholar]
- 9. Crabb DW, Bataller R, Chalasani NP, Kamath PS, Lucey M, Mathurin P, et al.; NIAAA Alcoholic Hepatitis Consortia . Standard definitions and common data elements for clinical trials in patients with alcoholic hepatitis: recommendation from the NIAAA Alcoholic Hepatitis Consortia. Gastroenterology 2016;150:785‐790. [DOI] [PMC free article] [PubMed] [Google Scholar]
- 10. Roth N, Kanel G, Kaplowitz N. Alcoholic foamy degeneration and alcoholic fatty liver with jaundice: Often overlooked causes of jaundice and hepatic decompensation that can mimic alcoholic hepatitis. Clin Liver Dis 2015;6:145‐148. [DOI] [PMC free article] [PubMed] [Google Scholar]
- 11. Sanyal AJ, Gao B, Szabo G. Gaps in knowledge and research priorities for alcoholic hepatitis. Gastroenterology 2015;149:4‐9. [DOI] [PMC free article] [PubMed] [Google Scholar]
- 12. Altamirano J, Miquel R, Katoonizadeh A, Abraldes JG, Duarte‐Rojo A, Louvet A, et al. A histologic scoring system for prognosis of patients with alcoholic hepatitis. Gastroenterology 2014;146:1231‐1239.e1‐e6. [DOI] [PMC free article] [PubMed] [Google Scholar]
- 13. Maddrey WC, Boitnott JK, Bedine MS, Weber FL Jr, Mezey E, White RI Jr. Corticosteroid therapy of alcoholic hepatitis. Gastroenterology 1978;75:193‐199. [PubMed] [Google Scholar]
- 14. Louvet A, Naveau S, Abdelnour M, Ramond M‐J, Diaz E, Fartoux L, et al. The Lille model: a new tool for therapeutic strategy in patients with severe alcoholic hepatitis treated with steroids. Hepatology 2007;45:1348‐1354. [DOI] [PubMed] [Google Scholar]
- 15. Dunn W, Jamil LH, Brown LS, Wiesner RH, Kim WR, Menon KV, et al. MELD accurately predicts mortality in patients with alcoholic hepatitis. Hepatology 2005;41:353‐358. [DOI] [PubMed] [Google Scholar]
- 16. Dominguez M, Rincón D, Abraldes JG, Miquel R, Colmenero J, Bellot P, et al. A new scoring system for prognostic stratification of patients with alcoholic hepatitis. Am J Gastroenterol 2008;103:2747‐2756. [DOI] [PubMed] [Google Scholar]
- 17. Forrest EH, Evans CD, Stewart S, Phillips M, Oo YH, McAvoy NC, et al. Analysis of factors predictive of mortality in alcoholic hepatitis and derivation and validation of the Glasgow alcoholic hepatitis score. Gut 2005;54:1174‐1179. [DOI] [PMC free article] [PubMed] [Google Scholar]
- 18. Clayton P. CUTPT: Stata module for empirical estimation of cutpoint for a diagnostic test. Statistical Software Components 2013. http://fmwww.bc.edu/repec/bocode/c/cutpt.ado
- 19. Cicchetti DV. Guidelines, criteria, and rules of thumb for evaluating normed and standardized assessment instruments in psychology. Psychol Assess 1994;6:284‐290. [Google Scholar]
- 20. Thabut D, Naveau S, Charlotte F, Massard J, Ratziu V, Imbert‐Bismut F, et al. The diagnostic value of biomarkers (AshTest) for the prediction of alcoholic steato‐hepatitis in patients with chronic alcoholic liver disease. J Hepatol 2006;44:1175‐1185. [DOI] [PubMed] [Google Scholar]
- 21. Rudler M, Mouri S, Charlotte F, Cluzel P, Ngo Y, Munteanu M, et al. Validation of AshTest as a non‐invasive alternative to transjugular liver biopsy in patients with suspected severe acute alcoholic hepatitis. PLoS One 2015;10:e0134302. [DOI] [PMC free article] [PubMed] [Google Scholar]
- 22. Uchida T, Kao H, Quispe‐Sjogren M, Peters RL. Alcoholic foamy degeneration‐‐a pattern of acute alcoholic injury of the liver. Gastroenterology 1983;84:683‐692. [PubMed] [Google Scholar]
- 23. Michelena J, Altamirano J, Abraldes JG, Affò S, Morales‐Ibanez O, Sancho‐Bru P, et al. Systemic inflammatory response and serum lipopolysaccharide levels predict multiple organ failure and death in alcoholic hepatitis. Hepatology 2015;62:762‐772. [DOI] [PMC free article] [PubMed] [Google Scholar]
- 24. Jaruvongvanich V, Upala S, Sanguankeo A. Association between systemic inflammatory response syndrome and mortality in alcoholic hepatitis: a meta‐analysis. Hepatology 2016;64:696‐697. [DOI] [PubMed] [Google Scholar]
- 25. Mathurin P, Duchatelle V, Ramond MJ, Degott C, Bedossa P, Erlinger S, et al. Survival and prognostic factors in patients with severe alcoholic hepatitis treated with prednisolone. Gastroenterology 1996;110:1847‐1853. [DOI] [PubMed] [Google Scholar]
- 26. Taieb J, Delarche C, Paradis V, Mathurin P, Grenier A, Crestani B, et al. Polymorphonuclear neutrophils are a source of hepatocyte growth factor in patients with severe alcoholic hepatitis. J Hepatol 2002;36:342‐348. [DOI] [PubMed] [Google Scholar]
- 27. Li M, He Y, Zhou Z, Ramirez T, Gao Y, Gao Y, et al. MicroRNA‐223 ameliorates alcoholic liver injury by inhibiting the IL‐6‐p47phox‐oxidative stress pathway in neutrophils. Gut 2017;66:705‐715. [DOI] [PMC free article] [PubMed] [Google Scholar]
- 28. Colli A, Fraquelli M, Andreoletti M, Marino B, Zuccoli E, Conte D. Severe liver fibrosis or cirrhosis: accuracy of US for detection‐‐analysis of 300 cases. Radiology 2003;227:89‐94. [DOI] [PubMed] [Google Scholar]
- 29. Qamar AA, Grace ND, Groszmann RJ, Garcia‐Tsao G, Bosch J, Burroughs AK, et al.; Portal Hypertension Collaborative Group . Incidence, prevalence, and clinical significance of abnormal hematologic indices in compensated cirrhosis. Clin Gastroenterol Hepatol 2009;7:689‐695. [DOI] [PMC free article] [PubMed] [Google Scholar]
- 30. Montull S, Parés A, Bruguera M, Caballería J, Uchida T, Rodés J. Alcoholic foamy degeneration in Spain. Prevalence and clinico‐pathological features. Liver 1989;9:79‐85. [DOI] [PubMed] [Google Scholar]
- 31. Fléjou JF, Degott C, Kharsa G, Soulier A, Rueff B, Potet F. Alcoholic foamy steatosis: study of 3 cases. [in French] Gastroenterol Clin Biol 1987;11:165‐168. [PubMed] [Google Scholar]
- 32. Zieve L. Jaundice, hyperlipemia and hemolytic anemia: a heretofore unrecognized syndrome associated with alcoholic fatty liver and cirrhosis. Ann Intern Med 1958;48:471‐496. [DOI] [PubMed] [Google Scholar]
- 33. Ballard H, Bernstein M, Farrar JT. Fatty liver presenting as obstructive jaundice. Am J Med 1961;30:196‐201. [DOI] [PubMed] [Google Scholar]
- 34. Sataline LR, Matre WJ. Significance of hyperphosphatasemia in alcoholics with liver disease. An analysis of fifty‐eight cases with histologic diagnoses. Am J Med 1963;35:323‐342. [DOI] [PubMed] [Google Scholar]
- 35. Fromenty B, Grimbert S, Mansouri A, Beaugrand M, Erlinger S, Rötig A, et al. Hepatic mitochondrial DNA deletion in alcoholics: association with microvesicular steatosis. Gastroenterology 1995;108:193‐200. [DOI] [PubMed] [Google Scholar]
- 36. Mansouri A, Fromenty B, Berson A, Robin MA, Grimbert S, Beaugrand M, et al. Multiple hepatic mitochondrial DNA deletions suggest premature oxidative aging in alcoholic patients. J Hepatol 1997;27:96‐102. [DOI] [PubMed] [Google Scholar]
- 37. Ramond MJ, Poynard T, Rueff B, Mathurin P, Théodore C, Chaput JC, et al. A randomized trial of prednisolone in patients with severe alcoholic hepatitis. N Engl J Med 1992;326:507‐512. [DOI] [PubMed] [Google Scholar]
- 38. Mathurin P, Louvet A, Duhamel A, Nahon P, Carbonell N, Boursier J, et al. Prednisolone with vs without pentoxifylline and survival of patients with severe alcoholic hepatitis: a randomized clinical trial. JAMA 2013;310:1033‐1041. [DOI] [PubMed] [Google Scholar]
- 39. Duvoux C, Radier C, Roudot‐Thoraval F, Maille F, Anglade M‐C, Van Nhieu JT, et al. Low‐grade steatosis and major changes in portal flow as new prognostic factors in steroid‐treated alcoholic hepatitis. Hepatology 2004;40:1370‐1378. [DOI] [PubMed] [Google Scholar]
- 40. Caldwell SH, Lee VD, Kleiner DE, Al‐Osaimi AM, Argo CK, Northup PG, et al. NASH and cryptogenic cirrhosis: a histological analysis. Ann Hepatol 2009;8:346‐352. [PMC free article] [PubMed] [Google Scholar]
- 41. Ratziu V, Charlotte F, Heurtier A, Gombert S, Giral P, Bruckert E, et al.; LIDO Study Group . Sampling variability of liver biopsy in nonalcoholic fatty liver disease. Gastroenterology 2005;128:1898‐1906. [DOI] [PubMed] [Google Scholar]
- 42. Merriman RB, Ferrell LD, Patti MG, Weston SR, Pabst MS, Aouizerat BE, et al. Correlation of paired liver biopsies in morbidly obese patients with suspected nonalcoholic fatty liver disease. Hepatology 2006;44:874‐880. [DOI] [PubMed] [Google Scholar]
Associated Data
This section collects any data citations, data availability statements, or supplementary materials included in this article.
Supplementary Materials
Additional Supporting Information may be found at onlinelibrary.wiley.com/doi/10.1002/hep4.1119/full
Supporting Information 1