

Abstract
Nonalcoholic fatty liver disease (NAFLD) is an increasingly prevalent chronic liver disease for which no approved therapies are available. Despite intensive research, the cellular mechanisms that mediate NAFLD pathogenesis and progression are poorly understood. Although obesity, diabetes, insulin resistance, and related metabolic syndrome, all consequences of a Western diet lifestyle, are well‐recognized risk factors for NAFLD development, dysregulated bile acid metabolism is emerging as a novel mechanism contributing to NAFLD pathogenesis. Notably, NAFLD patients exhibit a deficiency in fibroblast growth factor 19 (FGF19), an endocrine hormone in the gut–liver axis that controls de novo bile acid synthesis, lipogenesis, and energy homeostasis. Using a mouse model that reproduces the clinical progression of human NAFLD, including the development of simple steatosis, nonalcoholic steatohepatitis (NASH), and advanced “burnt‐out” NASH with hepatocellular carcinoma, we demonstrate that FGF19 as well as an engineered nontumorigenic FGF19 analogue, M70, ameliorate bile acid toxicity and lipotoxicity to restore liver health. Mass spectrometry‐based lipidomics analysis of livers from mice treated with FGF19 or M70 revealed significant reductions in the levels of toxic lipid species (i.e., diacylglycerols, ceramides and free cholesterol) and an increase in levels of unoxidized cardiolipins, an important component of the inner mitochondrial membrane. Furthermore, treatment with FGF19 or M70 rapidly and profoundly reduced levels of liver enzymes, resolved the histologic features of NASH, and enhanced insulin sensitivity, energy homeostasis, and lipid metabolism. Whereas FGF19 induced hepatocellular carcinoma formation following prolonged exposure in these mice, animals expressing M70 showed no evidence of liver tumorigenesis in this model. Conclusion: We have engineered an FGF19 hormone that is capable of regulating multiple pathways to deliver antisteatotic, anti‐inflammatory, and antifibrotic activities and that represents a potentially promising therapeutic for patients with NASH. (Hepatology Communications 2017;1:1024–1042)
Abbreviations
- AAV
adeno‐associated virus
- ALT
alanine transaminase
- AST
aspartate transaminase
- Col
collagens
- CYP7A1
cytochrome P450 family 7 subfamily A member 1
- FGF
fibroblast growth factor
- FXR
farnesoid X receptor
- GFP
green fluorescent protein
- HCC
hepatocellular carcinomas
- HFFCD
high‐fat, high‐fructose, high‐cholesterol diet
- IL‐6
interleukin‐6
- LC‐MS
liquid chromatography‐mass spectrometry
- Mmp
matrix metalloproteinase
- mRNA
messenger RNA
- NAFLD
nonalcoholic fatty liver disease
- NAS
nonalcoholic fatty liver disease activity score
- NASH
nonalcoholic steatohepatitis
- Smpd
sphingomyelinase
- Sptlc
serine palmitoyltransferase
- TGF‐β1
transforming growth factor β1
Introduction
Nonalcoholic fatty liver diseases (NAFLDs) are common chronic liver disorders affecting 20%‐30% of the general adult population in Western countries.1 The more aggressive form of NAFLD, nonalcoholic steatohepatitis (NASH), develops in up to ∼20% of NAFLD patients and has increased in prevalence in recent years. Often associated with obesity, diabetes, and metabolic syndrome, NASH develops when excessive fat accumulates in liver cells (steatosis), followed by inflammatory cell infiltration, hepatocyte damage and degeneration (ballooning), and the deposition of fibrous tissue. As a result of these lesions, patients with NASH suffer increases in liver‐related mortality, liver failure, portal hypertension, cirrhosis, and hepatocellular carcinomas (HCCs), which have led to NASH being projected to be the leading indication for liver transplantation by 2020.2 Currently there is no U.S. Food and Drug Administration‐approved medicine for the treatment of NASH.
The mechanism underlying the development and progression of steatosis to NASH and cirrhosis is poorly understood, although lipotoxic metabolites, such as diacylglycerols, ceramides, free cholesterol, and free fatty acids, are thought to provide the primary insult in the pathogenesis of NASH and its extrahepatic complications.3 In addition to driving local insulin resistance and inflammation, hepatic lipotoxicity may also fuel the circulating proinflammatory milieu and systemic insulin resistance in developing NASH and contribute to the vicious cycle of worsening metabolic dysfunction and increased cardiovascular morbidity and mortality.
In addition to lipotoxic species, evidence supporting a role for bile acids in the pathogenesis of liver inflammation and fibrosis has started to emerge.4 Bile acids are synthesized in the liver and delivered into the intestinal lumen to aid absorption of lipids and lipid‐soluble vitamins. Beyond the essential roles in absorption of dietary fat and cholesterol, bile acids can also activate receptors, such as farnesoid X receptor (FXR) and G protein‐coupled bile acid receptor 1 (also known as TGR5), to exert diverse actions in liver, intestine, and other organs.4 Moreover, gut microbiota can further modify bile acids to produce hydrophobic species that return to the liver through enterohepatic circulation. Accumulation of bile acids within hepatocytes can cause conditions of mitochondrial dysfunction, endoplasmic reticulum stress, and immune cell infiltration that can ultimately lead to inflammation, cell death, and liver injury.5, 6, 7 In addition, bile acids activate hepatic stellate cells and represent an independent profibrogenic factor.8 Indeed, individuals with NASH have elevated hepatic and circulating concentrations of bile acids9, 10 as well as increased levels of fecal and urine bile acids.9, 11 Notably, concentrations of secondary bile acids, which are more hydrophobic and toxic, were significantly higher and correlate with histologic evidence of inflammation and fibrosis in these patients.
As a major hormone from the gut–liver axis responsible for controlling bile acid synthesis,12 Fibroblast growth factor 19 (FGF19) provides a rational target for potential intervention in NAFLD progression. Interestingly, the circulating FGF19 concentration is lower in patients with NAFLD,13, 14, 15 suggesting that dysregulated FGF19 expression may contribute to mechanisms governing NAFLD pathogenesis. Moreover, FGF19 has also been implicated in the systemic control of triglycerides, cholesterol, glucose, and energy homeostasis16 in addition to mediating regulation of de novo bile acid synthesis. Notably, FGF19 has been demonstrated to ameliorate hepatosteatosis in animal models by reducing fatty acid synthesis and increasing fatty acid oxidation.17, 18 However, the potential of FGF19 as a NAFLD/NASH therapeutic has been hindered by its hepatocarcinogenicity, as evidenced by studies in which mice expressing an FGF19 transgene were found to develop HCC.19 To obviate this limitation, we engineered a nontumorigenic FGF19 variant, M70, that differs from wild‐type FGF19 in the amino terminus, a key region of the protein involved in receptor interactions and signaling modulation. In M70, a 5‐amino acid deletion (P24‐S28) coupled with the substitution of three amino acids at critical positions (A30S, G31S, H33L) within the amino terminus enable biased FGF receptor 4 signaling so that M70 retains the ability to potently repress cytochrome P450 family 7 subfamily A member 1 (Cyp7a1) expression but no longer triggers activation of signal transducer and activator of transcription 3 (STAT3), a signaling pathway essential for FGF19‐mediated hepatocarcinogenesis.20, 21 We have previously demonstrated the therapeutic potential of M70 in ameliorating liver injury in mouse models of cholestatic disease and cholangiopathy, including bile duct‐ligated, α‐naphthyl isothiocyanate‐treated, and multidrug resistance (Mdr)‐2‐deficient mice.22, 23
We hypothesize that modulation of hepatic bile acid metabolism by FGF19 may impact bile acid‐dependent signaling and hepatic inflammatory cascades and could be used as a treatment for patients with NASH. In this report, we show that M70, a nontumorigenic analog of FGF19 that inhibits CYP7A1 expression with picomolar potency20 as well as wild‐type human FGF19 profoundly reduce bile acid toxicity and lipotoxicity and effectively mitigate disease in mouse models of NASH. M70 is currently under evaluation in phase 2 clinical trials in patients with NASH (http://www.clinicaltrials.gov, NCT02443116).
Materials and Methods
ANIMALS
Animal procedures were approved by the Institutional Animal Care and Use Committee at NGM Biopharmaceuticals, Inc. All animals received humane care according to the criteria outlined in the “Guide for the care and use of laboratory animals” prepared by the National Academy of Sciences and published by the National Institutes of Health. Male mice were used throughout the studies. All injections and tests were performed during the light cycle. When indicated, 9‐week‐old C57BL6 mice (#000664; Jackson Laboratories) were fed a high‐fat, high‐fructose, high‐cholesterol diet (HFFCD) (40 kcal% fat, 20 kcal% fructose, and 2% cholesterol;#D09100301i; Research Diets, Inc.) to induce NASH. Mice received a single tail vein injection of 3 × 10¹¹ vector genome adeno‐associated virus (AAV)‐FGF19, AAV‐M70, or a control virus encoding green fluorescent protein (GFP; AAV‐GFP) and were maintained on the HFFCD throughout the duration of the study.
HISTOPATHOLOGIC ANALYSIS
Hematoxylin and eosin, Sirius Red, and trichrome staining were performed using standard methods. For oil red O and osmium tetroxide staining, frozen tissues were embedded in optimal cutting temperature compound and directly processed for staining (Premier Laboratories). Histologic scoring on hematoxylin and eosin and Sirius Red‐stained slides was conducted by a pathologist blinded to treatment groups and clinical chemistry information (Nova Pathology).
LIPIDOMICS
Frozen liver tissue (approximately 100 mg) was homogenized in glass vials in cold chloroform/methanol (2:1 volume per volume) with internal standards (Avanti Polar Lipids) for each lipid class (Creative Dynamics); the lower phases were collected, and the solvents were evaporated. The samples were reconstituted in isopropyl alcohol/methanol (1:1 volume per volume) for liquid chromatography–mass spectrometry (LC‐MS) analysis on an Ultimate 3000 ultrahigh‐performance LC system coupled to a Q Exactive hybrid quadrupole‐Orbitrap MS (Thermo Fisher Scientific). A Hypersil GOLD C18 analytic column (100 × 2.1 mm, 1.9 μm) was used for separation of lipids. LipidSearch software (Thermo Fisher) was used for lipid molecular species identification and quantification. The lipid classes selected for the search were triacylglycerol, diacylglycerol, ceramide, cardiolipin, and sphingomyelin. Lipid side‐chain composition is denoted by the a:b convention, where a is the number of carbons in the side chain and b the number of double bonds. Cluster 3.0 and Java Treeview programs were used to generate heat maps for visualizing each lipid species. For detailed information, please refer to the Supporting Information.
Results
MICE FED AN HFFCD DEVELOP BIOCHEMICAL AND HISTOLOGIC FEATURES RECREATING NASH PROGRESSION IN HUMANS
NAFLD represents a spectrum of liver diseases ranging from simple steatosis and NASH to advanced forms that can progress to end‐stage liver disease, cirrhosis, and HCC. As a means of studying this progression and identifying potential interventional therapies, we induced NAFLD in C57Bl6/J mice by feeding the animals with an HFFCD24, 25 (Fig. 1A). Notably, this model of steatohepatitis resembles the underlying etiology of human NASH as well as the concurrent clinical manifestations, including insulin resistance and metabolic syndrome.1 Simple steatosis developed in these mice after only 1 month of HFFCD feeding, as evidenced by staining fixed liver tissues with osmium tetroxide (Fig. 1B). Steatohepatitis, typified by fat accumulation, hepatocyte damage, inflammation, and fibrosis (revealed by Sirius Red or Masson's trichrome staining of collagens) was fully established after 8 months feeding on the HFFCD, as observed by others.24, 25 Advanced liver disease, with symptoms including “burnt‐out” steatosis, extensive fibrosis, and HCC, developed in mice after 20 months on the HFFCD (Fig. 1B).
Figure 1.
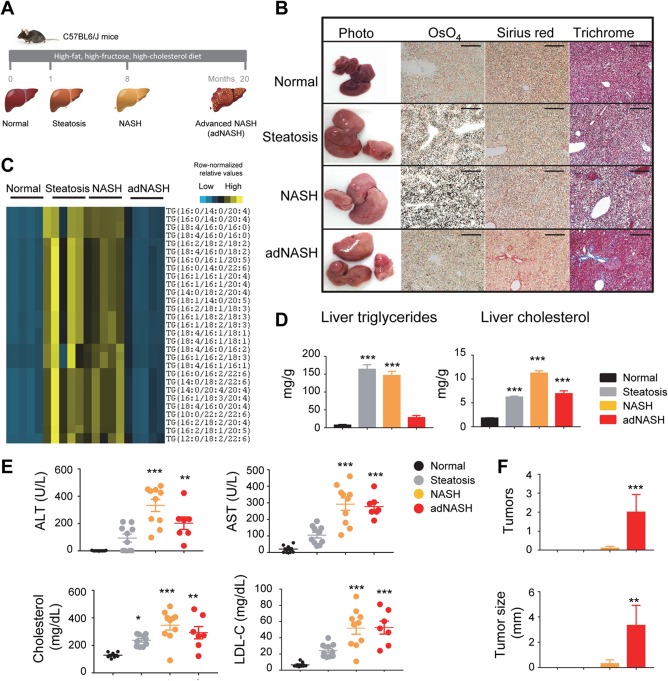
An HFFCD induces NASH resembling human disease progression. (A) Model outline. C57BL6/J mice were fed an HFFCD for 1, 8, and 20 months, representing steatosis, NASH, and advanced NASH stages, respectively. Chow‐fed mice served as normal controls. (B) Representative images of livers from mice of the indicated stages during disease progression. OsO4 stains lipids black. Collagens are stained red by Sirius Red and blue by Masson's trichrome, respectively. Note “burnt‐out” steatosis and tumor formation in the adNASH stage. Scale bars, 100 μm. (C) Heat map of relative abundance of triacylglycerol species between various disease stages. Each column represents an individual mouse; each row represents a different triacylglycerol lipid species. Colored bars represent row‐normalized relative abundance of lipid species. (D) Liver content of triglycerides and cholesterol. (E) Serum concentrations of ALT, AST, cholesterol, and LDL‐C. Each circle represents an individual animal. (F) Liver tumor formation during disease progression. One‐way analysis of variance with Dunnett's post‐hoc test for multigroup comparisons; *P < 0.05, **P < 0.01, ***P < 0.001 versus normal stage; mean ± SEM. Abbreviations: adNASH, advanced NASH; LDL‐C, low‐density lipoprotein cholesterol.
To examine the profile of neutral lipids in detail, we used a high‐performance LC‐MS to quantitate the levels of individual triacylglycerol species isolated from livers of these mice. A heat map comparing levels of hepatic triacylglycerol species in livers assigned to four histologic categories (normal, steatosis, NASH, advanced NASH) is displayed in Fig. 1C. The levels of triacylglycerol were significantly higher in livers of mice that exhibited histologic evidence of steatosis and NASH compared to normal livers. However, these lipids disappeared in livers harvested from mice showing advanced liver disease, with histologic presentations similar to those in patients with “burnt‐out” NASH.26 These findings were independently confirmed using the Folch method (reference 4 in Supporting Information) to measure total triglyceride content in the liver (Fig. 1D).
Compared with normal mice, serum concentrations of alanine aminotransferase (ALT) and aspartate aminotransferase (AST) were increased at all time points in animals that received the HFFCD (Fig. 1E). The elevation of ALT levels in mice with advanced liver disease trended lower than in animals with NASH, consistent with clinical findings of normal ALT levels in some patients with advanced disease.27 Furthermore, HFFCD‐fed animals exhibited significant increases in concentrations of serum total cholesterol and low‐density lipoprotein cholesterol.
NASH predisposes patients to hepatocarcinogenesis, representing a rapidly growing indication for HCC‐related liver transplant.28 HFFCD feeding to mice over 20 months induced liver tumor formation in approximately 40% of the animals. Gross observation of livers during necropsy revealed an average of two tumors per liver with an average maximal tumor diameter of 3.3 ± 1.6 mm (Fig. 1F).
Based on these data, the HFFCD mouse model mimics the progressive changes that characterize the development of worsening NAFLD in humans, including burnt‐out NASH and HCC. In the subsequent studies described in this paper, we challenged C57BL6/J mice with an HFFCD and examined the effects of ectopic FGF19 expression on diet‐induced NAFLD progression.
FGF19 AND M70 RESOLVES BILE ACID TOXICITY
The de novo synthesis of bile acids occurs in the hepatocytes through two pathways comprising more than 16 enzymes that catalyze the conversion of cholesterol into bile acids: the classic (neutral) pathway and the alternative (acidic) pathway29 (Fig. 2A). As FGF19 is a key regulator of bile acid synthesis in the liver, we examined the effects of FGF19 and M70 on the expression of genes encoding key bile acid biosynthetic enzymes in the HFFCD mouse model of NASH. To that end, AAV‐mediated gene delivery was used to administer FGF19, M70, or a control gene (GFP) by tail vein injection. Using reverse transcription followed by quantitative polymerase chain reaction, we demonstrated that hepatic messenger RNA (mRNA) levels of Cyp7a1, which catalyzes the first step in the classic bile acid synthetic pathway, were markedly suppressed by FGF19 and M70 in HFFCD‐fed mice (Fig. 2B). mRNA levels of Cyp8b1, which controls the synthesis of cholic acid, were similarly reduced by exposure to FGF19 and M70. In contrast, hepatic expression of Cyp27a1 and Cyp7b1, encoding key enzymes in the alternate pathway of bile acid synthesis, were not affected by FGF19 or M70.
Figure 2.
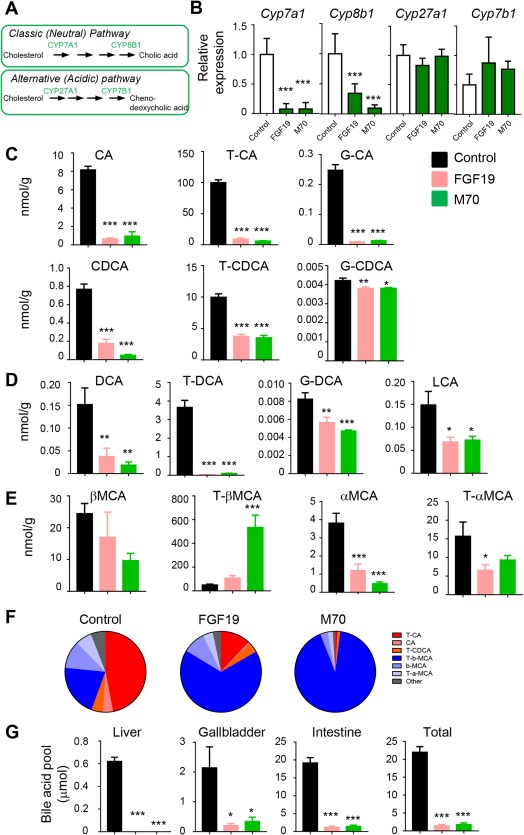
FGF19 and M70 eliminate bile acid toxicity. We injected 25‐week‐old C57BL6/J mice on an HFFCD with AAV‐FGF19 (n = 9), AAV‐M70 (n = 9), or a control virus (n = 9) through tail veins. Bile acids were quantified from liver extracts on a 4000 QTRAP mass spectrometer via electrospray ionization in the negative ion mode. (A) Bile acid synthetic pathways. Genes evaluated in qRT‐PCR are in green. (B) qRT‐PCR analysis of the expression of key enzymes in bile acid synthetic pathways. (C) Hepatic concentrations of primary bile acids. Unconjugated, taurine‐, and glycine‐conjugated bile acids are shown as individual graphs. (D) Hepatic concentrations of DCA, a secondary bile acid. (E) Concentrations of muricholic acids. (F) Relative abundance of bile acids as a percentage of total bile acid concentrations. Pie charts show a marked improvement in hepatic bile acid hydrophobicity by FGF19 and M70 treatment (hydrophobic bile acids are in red and orange, hydrophilic bile acids are in blue and light blue). (G) Bile acid pool size. One‐way analysis of variance with Dunnett's post‐hoc test for multigroup comparisons; *P < 0.05, **P < 0.01, ***P < 0.001 versus control group; mean ± SEM. Abbreviations: CA, cholic acid; CDCA, chenodeoxycholic acid; DCA, deoxycholic acid; G, glycine; LCA, lithocholic acid; qRT‐PCR, quantitative reverse transcription polymerase chain reaction; T, taurine.
We next assessed the functional consequence of down‐regulating Cyp7a1 and Cyp8b1 expression on bile acid metabolism by using LC‐MS to measure the hepatic content of primary and secondary bile acids. Consistent with the observed suppression of Cyp7a1 and Cyp8b1 mRNA levels, the hepatic concentrations of cholic acid and chenodeoxycholic acid in taurine‐ or glycine‐conjugated forms or unconjugated forms were significantly reduced by FGF19 or M70 treatment (Fig. 2C).
Subsequent to their release into the small intestine, primary bile acids are metabolized by bacteria to more hydrophobic bile acid species through dehydroxylation to form secondary bile acids, such as deoxycholic acid and lithocholic acid. These hydrophobic bile acids can return to the liver by direct diffusion or enterohepatic circulation. The retention and accumulation of hydrophobic bile acids in hepatocytes have been implicated as a cause of liver damage, with hydrophobicity as an important determinant of cellular toxicity. We found hepatic concentrations of the most hydrophobic bile acids, including both deoxycholic acid and lithocholic acid, to be markedly reduced in mice expressing FGF19 or M70 (Fig. 2D).
In addition to enteric metabolism by bacteria, primary and secondary bile acid species can be further modified in mice by hepatic addition of hydrophilic hydroxyl groups to form muricholic acid (MCA). We detected marked elevation of tauro (T)‐βMCA but not other MCA species in livers of FGF19‐ or M70‐treated mice (Fig. 2E). Because T‐βMCA is one of the most hydrophilic bile acids, the overall hydrophobicity of hepatic bile acids was dramatically improved by FGF19 or M70 treatment, as shown in pie charts representing the relative abundance of each bile acid species (Fig. 2F). Consistent with our prior studies,22 administration of FGF19 or M70 resulted in significant reductions in total bile acid pool size (Fig. 2G). Therefore, exposure to FGF19 and M70 improved the overall hydrophilicity profile of hepatic bile acids and profoundly reduced the levels of hydrophobic bile acids associated with liver toxicity in a mouse model of NASH.
FGF19 AND M70 REVERSE LIPOTOXICITY
While cellular ballooning, degeneration, and inflammation are histologic hallmarks of NASH, mechanistic connections to inflammatory lipids have only recently been examined.3 Previous studies demonstrated significant hepatic accumulation of triacylglycerol, diacylglycerol, free cholesterol, but not free fatty acids in patients with NASH.30 An independent lipidomics study showed marked increases in diacylglycerol species in steatotic human livers, whereas no clear trend was observed for changes in levels of glycerolphosphatidic acids, glycerolphosphatidylcholines, glycerophosphatidylethanolamines, glycerolphosphatidylglycerol, glycerolphosphatidylinositol, and glycerolphosphatidylserines.31 Consistent with reports that FGF19 acts directly on hepatocytes to inhibit fatty acid synthesis,32 we observed significant reductions in hepatic mRNA levels of ATP citrate lyase (Acly), acetyl‐coA carboxylase beta (Acacb), fatty acid synthase (Fasn), stearoyl‐Coenzyme A desaturase 1 (Scd1), ELOVL family member 6 (Elovl6), and diacylglycerol O‐acyltransferase 2 (Dgat2), encoding key enzymes responsible for de novo lipogenesis and fatty acid synthesis, following acute dosing with FGF19 or M70 proteins (Fig. 3A).
Figure 3.
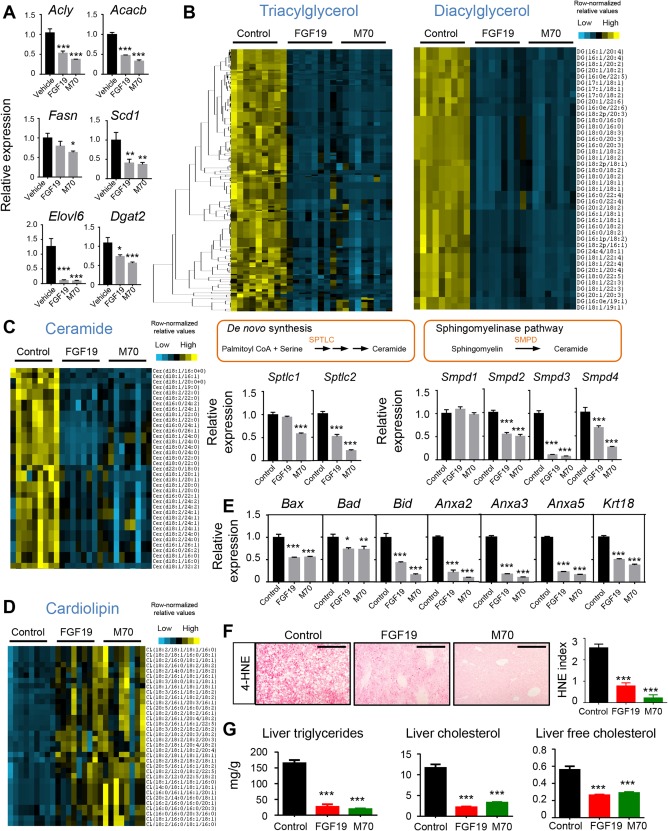
FGF19 and M70 abolish lipotoxicity. (A) Effect of FGF19 and M70 on key genes in de novo lipogenesis and fatty acid synthesis. We injected 18‐week‐old diet‐induced obese C57BL6/J mice with 1 mg/kg recombinant FGF19 protein (n = 3), M70 protein (n = 3), or vehicle (n = 3) intraperitoneally. Livers were harvested 4 hours later for RNA extraction and hepatic gene expression analysis by qRT‐PCR. (B‐G) We injected 25‐week‐old C57BL6/J mice on HFFCD with AAV‐FGF19 (n = 9), AAV‐M70 (n = 9), or a control virus (n = 9) through tail veins. Lipid extracts from the livers were analyzed on an Ultimate 3000 ultrahigh‐performance liquid chromatography system coupled to a Q Exactive hybrid quadrupole‐Orbitrap mass spectrometer. (B) Heat map of hierarchical clustering of triacylglycerol and diacylglycerol species performed on Euclidean distance between various treatment groups. Each column represents an individual mouse. Each row represents a different lipid species. Colored bars represent row‐normalized relative abundance of lipid species. (C) Heat map of ceramide species and qRT‐PCR analysis of key genes in ceramide biosynthetic pathways. (D) Heat map of unoxidized cardiolipin species showing marked elevation after FGF19 or M70 treatment. (E) Relative expression of key genes in cell‐death pathways. (F) Staining for intrahepatic 4‐HNE, a marker of reactive oxygen species. Shown are representative photos with 4‐HNE‐positive signals as punctate red staining. Scale bars, 200 μm. HNE index was calculated as described by Seki et al. (reference 3 in Supporting Information). (G) Intrahepatic concentrations of triglycerides, total cholesterol, and free cholesterol. One‐way analysis of variance with Dunnett's post‐hoc test for multigroup comparisons; *P < 0.05, **P < 0.01, ***P < 0.001 versus control group; mean ± SEM. Abbreviations: 4‐HNE, 4‐hydroxynonenal; Cer, ceramide; CL, cardiolipin; DG, diacylglycerol; qRT‐PCR, quantitative reverse transcription polymerase chain reaction.
To systematically monitor the effects of FGF19 on the hepatic lipid profile in a NASH disease model, we conducted a lipidomics analysis directly on liver tissue harvested from HFFCD‐fed mice by using an LC‐tandem‐MS method. Triacylglycerol was the dominant lipid that accumulated in livers during diet‐induced steatosis. Species‐level comparison revealed robust and significant decreases (P < 0.01) in triacylglycerol species in mice expressing either the FGF19 or M70 transgenes (Fig. 3B; Supporting Fig. S1). Diacylglycerol derived from de novo lipogenesis is a key lipid species mediating protein kinase C activation in the liver and plays an instrumental role in triggering hepatic insulin resistance.33 Mice expressing either FGF19 or M70 showed robust and significant reductions (P < 0.01) in diacylglycerol species compared with animals in the control cohort (Fig. 3B; Supporting Fig. S2).
Ceramides and related sphingolipids represent minor components of the accumulated lipids but play pivotal roles as mediators of cell death, inflammation, and insulin resistance.34 Hepatic accumulation of ceramides has been associated with NASH and hypothesized to contribute to disease progression.35, 36 We observed a substantial decrease in hepatic ceramide levels in FGF19‐ and M70‐treated mice (Fig. 3C; Supporting Fig. S3). To determine whether this reduction in ceramides arises from changes in ceramide synthesis or breakdown, we examined the expression of genes encoding specific enzymes that catalyze these processes. Expression of the serine palmitoyltransferase (Sptlc)1 and Sptlc2 genes, which encode initial rate‐limiting enzymes in de novo synthesis of ceramide from palmitoyl‐coenyzme A and serine, was reduced by M70 treatment (Fig. 3C). Moreover, expression of sphingomyelin phosphodiesterases (Smpd)2‐4, encoding key enzymes in the alternative route of the sphingomyelinase pathway, was significantly reduced in mice expressing M70. Increased levels of sphingomyelins were observed in both treatment groups, consistent with the inhibition of Smpd expression by administration of the M70 and FGF19 transgenes (Supporting Fig. S4). Together, these results suggest that treatment with FGF19 or M70 leads to a reduction in hepatic ceramide biosynthesis and likely contributes to the observed improvements in liver health.
Interestingly, we observed pronounced increases in unoxidized cardiolipin species in livers of mice treated with FGF19 and M70 relative to GFP‐treated mice (Fig. 3D; Supporting Fig. S5). Rich in unsaturated fatty acids, cardiolipin is a phospholipid component of the inner mitochondrial membrane37 that is located in close proximity to the electron transport chain complexes and the sites of reactive oxygen species (ROS) generation. As a result of this susceptibility to ROS attack, cardiolipin can be oxidized and depleted from the mitochondria, causing release of cytochrome c from the inner membrane and the acceleration of apoptosis.38 The elevation of unoxidized cardiolipin species by FGF19 and M70 treatment is consistent with a cellular environment in which oxidative stress is reduced and the integrity of the inner mitochondrial membrane is improved. Moreover, both FGF19 and M70 treatments reduced levels of key factors of the cell death machinery (BCL2 associated X apoptosis regulator [Bax], BCL2 associated agonist of cell death [Bad], BH3 interacting domain death agonist [Bid]) and markers of cell death (Annexins [Anxa2,3,5] and cytokeratin‐18 [Krt18]) (Fig. 3E). Further corroborating a state of reduced oxidative stress in the liver, levels of 4‐hydroxynonenal, an aldehyde product of lipid peroxidation and a marker of cytosolic ROS production, were decreased in livers of FGF19‐ and M70‐treated mice (Fig. 3F).
We further confirmed the dramatic reduction in hepatic triglyceride content following FGF19 or M70 treatment in HFFCD‐fed mice using the Folch method (Fig. 3G). Similarly, significant decreases in intrahepatic cholesterol content and lipotoxic free cholesterol in particular were noted in FGF19‐ or M70‐treated animals (Fig. 3G).
In summary, FGF19 and M70 reduced hepatic accumulation of “toxic” lipid species, such as diacylglycerol, ceramides, and free cholesterol, and increased levels of beneficial lipids, such as unoxidized cardiolipins, indicating the reversal of a lipotoxic state in a mouse model of diet‐induced NASH.
FGF19 AND M70 DEMONSTRATE ANTISTEATOSIS, ANTI‐INFLAMMATORY, AND ANTIFIBROTIC ACTIVITY
Given the demonstrated improvements in bile acid toxicity and lipotoxicity in mice expressing the FGF19 and M70 transgenes, we next examined the effect of these factors on resolution of the NASH disease state and improvement in liver fibrosis. Nine‐week‐old C57BL6/J mice were placed on an HFFCD to induce NASH. Treatment was initiated after 16 weeks of HFFCD feeding, when NASH is fully developed,24 by injecting mice with AAV‐FGF19, AAV‐M70, or a control virus. HFFCD feeding was continued for an additional 34 weeks, at which time the mice were euthanized for histology and gene expression analysis (Fig. 4A).
Figure 4.
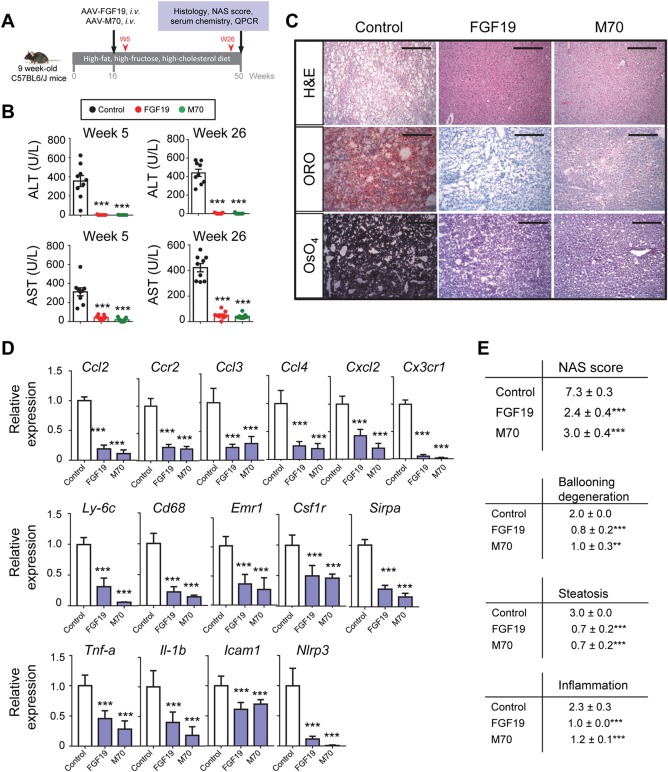
FGF19 and M70 demonstrate antisteatotic and anti‐inflammatory activities leading to resolution of NASH. (A) Study design. We fed 9‐week‐old C57BL6/J mice an HFFCD to induce NASH. Treatment was initiated after 16 weeks of HFFCD feeding by injecting mice with AAV‐FGF19 (n = 9), AAV‐M70 (n = 9), or a control virus (n = 9) through tail veins. HFFCD feeding was continued for an additional 34 weeks when mice were euthanized for histology and gene expression analysis. Serum concentrations of ALT and AST were measured 5 and 26 weeks after AAV injection (red arrowheads). (B) Rapid and sustained reductions in ALT and AST by FGF19 and M70. Shown are serum levels of ALT and AST 5 and 26 weeks after treatment initiation. (C) Representative images of liver histology. Oil red O and OsO4 stain lipids red and black, respectively. Scale bars, 100 μm. (D) qRT‐PCR analysis of proinflammatory chemokines, cytokines, and markers of infiltrating monocytes/macrophages. (E) NAS and individual components of NAS. Total NAS scores were assessed on a scale of 0‐8, with higher scores indicating more severe disease; the individual components are steatosis (assessed on a scale of 0‐3), lobular inflammation (assessed on a scale of 0‐3), and hepatocellular ballooning (assessed on a scale of 0‐2). One‐way analysis of variance with Dunnett's post‐hoc test for multigroup comparisons; ***P < 0.001 versus control group; mean ± SEM. Abbreviations: H&E, hematoxylin and eosin; i.v., intravenous; ORO, oil red O; qRT‐PCR, quantitative reverse transcription polymerase chain reaction; W, week.
At 5 weeks after AAV injection, a profound improvement in serum levels of liver enzymes (ALT and AST) was observed in mice treated with FGF19 or M70 compared to mice injected with a control virus (Fig. 4B). In fact, reduction in ALT and AST levels was detected in a separate cohort of mice after only 2 weeks of treatment (Supporting Fig. S6), signaling a rapid response to FGF19 and M70 administration. Furthermore, the beneficial effects of FGF19 and M70 on liver enzyme concentrations were sustained throughout the treatment period (Fig. 4B).
Excess lipid accumulation is a key feature of many metabolic diseases, including NASH. Using Oil red O and osmium tetroxide to detect neutral lipids and lipid droplet morphology in sections of harvested liver tissues, evidence of severe macrovesicular and microvesicular fat deposition was observed in the control groups of the HFFCD‐fed mice (Fig. 4C). In contrast, steatosis was completely abolished from livers harvested from mouse cohorts treated with FGF19 or M70 (Fig. 4C).
NASH is characterized by immune‐cell infiltration and tissue damage in the liver. Recruitment of extrahepatic immune cells to the site of hepatic injury is largely mediated by interactions between chemokines/cytokines and their receptors, eventually leading to inflammation and cell death (as evidenced by ballooning degeneration of hepatocytes). Expression of FGF19 or M70 markedly reduced hepatic expression of C‐C motif chemokine ligand 2 (Ccl2), C‐C motif chemokine receptor 2 (Ccr2), C‐C motif chemokine ligand 3 (Ccl3), C‐C motif chemokine ligand 4 (Ccl4), C‐X‐C motif chemokine ligand 2 (Cxcl2), and C‐X3‐C motif chemokine receptor 1 (Cx3cr1) (Fig. 4D). Consistent with the observed decrease in inflammation, mRNA levels for markers of monocytes/macrophages, including lymphocyte antigen 6 complex locus C1 (Ly6c), Cd68, adhesion G protein‐coupled receptor E1 (Emr1), colony stimulating factor 1 receptor (Csf1r), and signal regulatory protein alpha (Sirp‐α), were substantially reduced in the livers of mice expressing either FGF19 or M70 (Fig. 4D), suggesting that the infiltration of monocytes/macrophages into the liver had been reduced. Furthermore, FGF19‐ and M70‐treated animals showed significantly reduced hepatic expression of proinflammatory cytokines tumor necrosis factor alpha (Tnf‐α), interleukin 1β (Il‐1β), intercellular cell adhesion molecule 1 (Icam1), and NLR family pyrin domain containing 3 (Nlrp3) (Fig. 4D). Taken together, these molecular changes are consistent with treatment‐related anti‐inflammatory effects in mice exposed to FGF19 and M70 in the context of NASH.
The NAFLD activity score (NAS) is a composite histologic score that has been used as a primary end point in multiple NASH clinical trials. We used this same tool to evaluate features of NAFLD in the HFFCD‐fed mice as a means to measure treatment‐related changes in liver histopathology. As shown in Fig. 4E, mice injected with AAV‐FGF19 or AAV‐M70 had significantly improved NAS scores. Importantly, all three individual components of NAS score (steatosis, ballooning, and inflammation) were significantly improved after treatment with FGF19 or M70.
Steatohepatitis drives fibrogenesis, a slow process of hepatic scar formation that can result in cirrhosis and related deadly complications. Notably, the percentage area of hepatic fibrosis, as shown by Sirius Red staining of collagens, was significantly decreased by expression of either the FGF19 or M70 transgenes (Fig. 5A,B). Using a histologic fibrosis score commonly used in NASH clinical trials,39 we showed that fibrosis had progressed to stage F4 in HFFCD‐fed mice in the control group but was constrained to stage F1 in FGF19 or M70‐treated mice (Fig. 5C).
Figure 5.
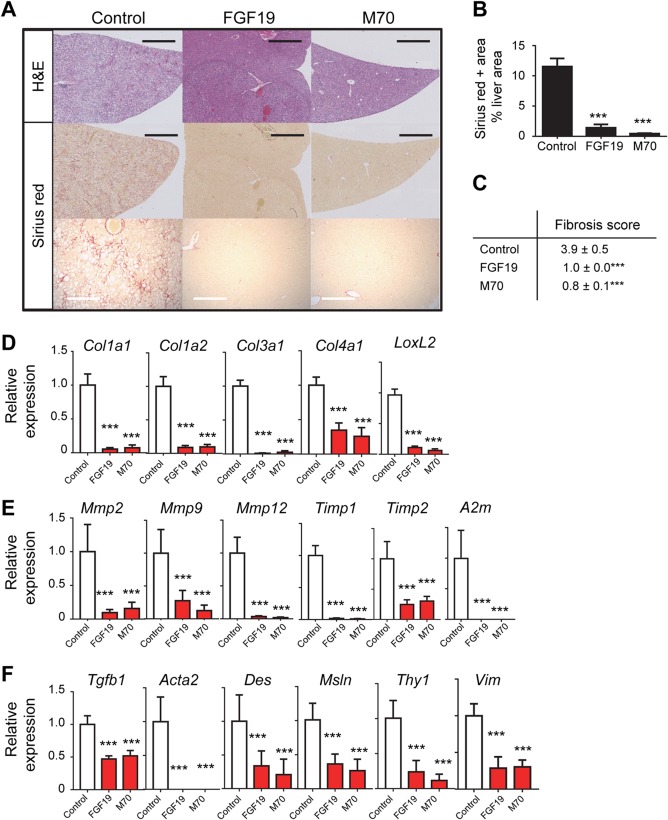
FGF19 and M70 demonstrate robust antifibrotic efficacy. We fed 9‐week‐old C57BL6/J mice an HFFCD to induce NASH. Treatment was initiated after 16 weeks of HFFCD feeding by injecting mice with AAV‐FGF19 (n = 9), AAV‐M70 (n = 9), or a control virus (n = 9) through tail veins. HFFCD feeding was continued for an additional 34 weeks when mice were euthanized for histology and gene expression analysis. (A) Representative H&E and Sirius Red images of the liver. Scale bars, 2 mm (black bars) and 100 μm (white bars). (B) Morphometric quantification of Sirius Red‐positive area as a percentage of liver area. (C) Kleiner fibrosis scores. Fibrosis was assessed on a scale of 0‐4, with higher scores showing more severe fibrosis. (D) Relative gene expression by qRT‐PCR for collagen isoforms and enzyme responsible for collagen crosslinking. (E) Relative expression of genes in matrix remodeling. (F) Relative expression of markers of activated hepatic stellate cells and myofibroblasts. One‐way analysis of variance with Dunnett's post‐hoc test for multigroup comparisons; ***P < 0.001 versus control group; mean ± SEM. Abbreviations: H&E, hematoxylin and eosin; qRT‐PCR, quantitative reverse transcription polymerase chain reaction.
To confirm the histologic observations of fibrosis improvement at a molecular level, we also measured the hepatic mRNA levels of a panel of fibrosis‐related gene expression by reverse transcription followed by quantitative polymerase chain reaction. FGF19 and M70 treatment significantly reduced the expression of collagens (Col1a1, Col1a2, Col3a1, Col4a1) and lysyl oxidase‐like 2 (Loxl2), a gene encoding the key enzyme that controls collagen crosslinking, typically elevated in the context of NASH (Fig. 5D). Compared to the control mice, significant reductions in hepatic production of matrix metalloproteinase (Mmp)2, Mmp9, Mmp12, tissue inhibitor of metalloproteinase (Timp)1, Timp2, as well as α2‐macroglobulin (A2m) mRNAs were evident in FGF19‐ and M70‐treated animals (Fig. 5E).
Transforming growth factor β1 (TGF‐β1), a major fibrogenic cytokine produced by hepatocytes, Kupffer cells, and infiltrating immune cells, has been shown to promote transdifferentiation of hepatic stellate cells into myofibroblasts, which serve as the primary source of scar‐forming matrix proteins.40 We found that Tgf‐β1 expression in the liver was significantly reduced after AAV‐FGF19 or AAV‐M70 administration (Fig. 5F). Moreover, the number of activated stellate cells and myofibroblasts, as characterized by the expression levels of genes encoding α‐smooth muscle actin (Acta2), desmin (Des), mesothelin (Msln), thymus cell antigen 1 (Thy1), and vimentin (Vim),41 were notably decreased by FGF19 or M70 treatment. Overall, these results are consistent with the histopathologic observations indicating improvements in fibrosis in response to FGF19 and M70.
Collectively, these findings demonstrate that FGF19 and M70 robustly and consistently resolve the NASH disease state in HFFCD‐fed mice. Ectopic expression of these factors reduces blood concentrations of liver enzymes, improves the histopathologic features associated with NASH (including steatosis, hepatocellular ballooning, and lobular inflammation), and mitigates the development of fibrosis in a mouse model of diet‐induced NASH.
FGF19 AND M70 IMPROVE INSULIN SENSITIVITY, ENERGY HOMEOSTASIS, AND LIPID METABOLISM
NASH has been strongly associated with metabolic syndrome, particularly obesity, insulin resistance, and type 2 diabetes,1 providing a compelling rationale for potential NASH therapeutics that address these comorbidities and also induce weight loss and improve insulin sensitivity.
Treatment of HFFCD‐fed mice with AAV‐FGF19 or AAV‐M70 but not a control virus resulted in significant reductions in body weight and blood glucose levels (Fig. 6A). Moreover, as early as 2 weeks after initiating treatment, mice expressing either FGF19 or M70 showed improved responses to an oral glucose challenge (Fig. 6B). Indicative of improved insulin sensitivity, these mice also had lower fasting plasma insulin concentrations and reduced homeostasis model assessment of insulin resistance values (Fig. 6C). In addition, FGF19 and M70 expression decreased relative fat mass but not relative lean mass in the mouse NASH model (Fig. 6D). Serum concentrations of total cholesterol, low‐density lipoprotein cholesterol, and triglycerides were lower in FGF19‐ and M70‐treated animals compared with the control cohort, suggesting an improved lipid profile in these mice (Fig. 6E). At the end of the study, the circulating levels of FGF19 and M70 were 426 ± 40 ng/mL and 148 ± 20 ng/mL, respectively (Fig. 6F).
Figure 6.
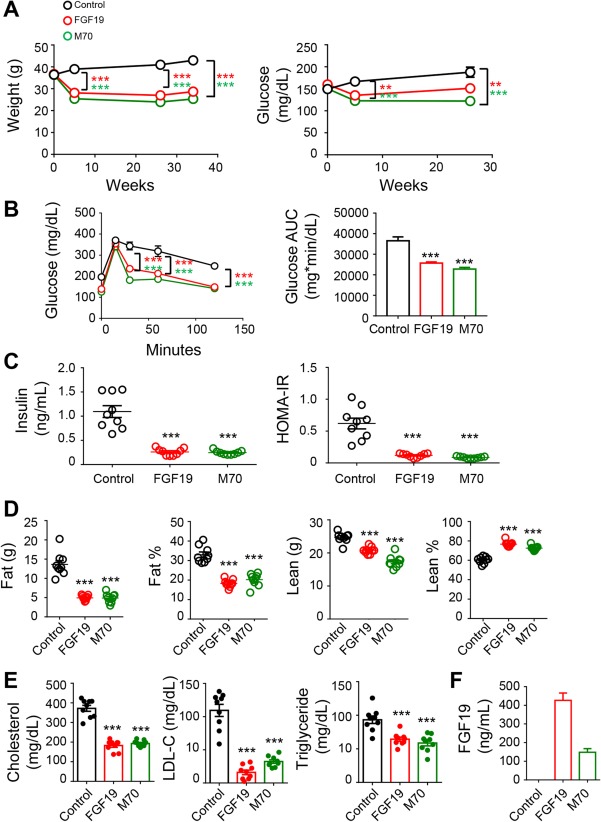
FGF19 and M70 improve insulin sensitivity, glucose, and energy homeostasis. We fed 9‐week‐old C57BL6/J mice an HFFCD to induce NASH. Treatment was initiated after 16 weeks of HFFCD feeding by injecting mice with AAV‐FGF19 (n = 9), AAV‐M70 (n = 9), or a control virus (n = 9) through tail veins. HFFCD feeding was continued for an additional 34 weeks when mice were euthanized for analysis. (A) Body weight and blood glucose over time. (B) Oral glucose tolerance tests conducted 2 weeks after AAV administration. Shown are blood glucose concentrations at various time points following glucose gavage and the AUC values. (C) Serum concentrations of insulin and HOMA‐IR. (D) Body composition determined by magnetic resonance imaging. (E) Serum lipid profile. (F) Circulating concentrations of FGF19 and M70 at the end of the study. Two‐way analysis of variance with Bonferroni's post‐hoc test for time x group comparisons; one‐way analysis of variance with Dunnett's post‐hoc test for multigroup comparisons; ***P < 0.001 versus control group; mean ± SEM. Abbreviations: AUC, area under the curve; HOMA‐IR, homeostasis model assessment of insulin resistance; LDL‐C, low‐density lipoprotein cholesterol.
Based on these data, FGF19 and M70 treatments lead to improvements in glycemic control, insulin sensitivity, body weight, and circulating lipids in HFFCD‐fed mice and could potentially provide additional therapeutic benefits in patients with NASH.
FGF19 BUT NOT M70 INDUCES HCC FORMATION IN A DIET‐INDUCED MOUSE MODEL OF NASH
It is well established that FGF19 promotes the formation of hepatocellular tumors in a variety of mouse strains.19, 20, 21 Tumors staining positive for glutamine synthetase can be detected in livers harvested from HFFCD‐fed mice 34 weeks after intravenous administration of AAV‐FGF19 (Fig. 7A); tumor penetrance was approximately 80% in these mice (Fig. 7B). Consistent with an essential role of IL‐6/ STAT3 signaling in FGF19‐driven hepatocarcinogenesis,21 serum concentrations of IL‐6 were lower in HFFCD‐fed mice treated with M70 when compared with mice treated with FGF19 (Fig. 7C). Despite liver tumor formation, mice expressing the FGF19 transgene showed reduced liver weight when compared with the control group of HFFCD‐fed mice, which presented with pale, enlarged, fat‐engorged livers. In contrast, livers of mice treated with AAV‐M70 remained tumor free for the duration of the experiment and furthermore showed treatment‐related reductions in liver and spleen weight (Fig. 7D,E).
Figure 7.
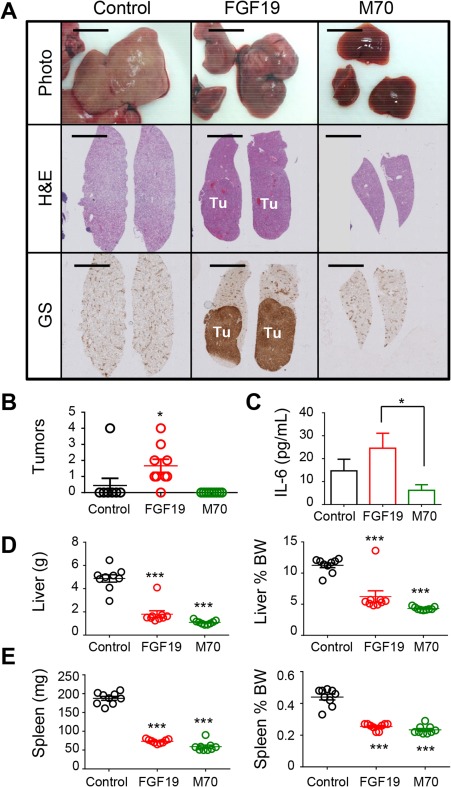
FGF19 but not M70 induces HCC after prolonged exposure in a mouse NASH model. (A) Representative images of livers from HFFCD‐fed C57BL6/J mice. Mice were euthanized 34 weeks after injection with AAV‐FGF19, AAV‐M70, or a control virus. Shown are macroscopic views and liver sections stained with H&E or anti‐glutamine synthetase. DAB substrates (brown color) were used for immunohistochemistry. Scale bars, 5 mm. (B) Liver tumor scores of HFFCD‐fed C57BL6/J mice. Each circle represents an individual mouse. (C) Serum concentrations of IL‐6. (D) Liver weight and ratios of liver to body weight. (E) Spleen weight and ratios of spleen to body weight. One‐way analysis of variance with Dunnett's post‐hoc test for multigroup comparisons; unpaired, two‐tailed t test when comparing two groups; *P < 0.05, **P < 0.01, ***P < 0.001 versus control group; mean ± SEM. Abbreviations: BW, body weight; DAB, 3,3′‐diaminobenzidine; GS, glutamine synthetase; H&E, hematoxylin and eosin; Tu, tumors.
Despite similarly robust therapeutic efficacy in the mouse models, FGF19 and M70 displayed striking differences in tumorigenicity. In particular, FGF19 but not M70, an engineered analogue of FGF19, promoted liver tumorigenesis following prolonged exposure in a mouse model of diet‐induced NASH.
Discussion
In this report, we showed that FGF19 and M70, an engineered nontumorigenic FGF19 variant, demonstrate robust efficacy in a mouse model of diet‐induced NASH. AAV delivery of FGF19 or M70 transgenes in these mice resulted in a rapid and robust reduction in ALT and AST concentrations and a clear improvement in all histologic features associated with NASH, including hepatic steatosis, inflammation, and ballooning degeneration. Furthermore, we showed that FGF19 and M70 engage a variety of pathways to improve overall liver health. Importantly, we showed that prolonged exposure to FGF19 but not M70 in mice induced liver tumor formation in the context of diet‐induced NASH.
In the current study, we demonstrated that treatment with FGF19 and M70 leads to resolution of NASH and improvement in fibrosis through multifactorial mechanisms. NAFLD is fundamentally a disease characterized by marked derangements in lipid storage and metabolism. It is noteworthy, therefore, that in addition to suppressing de novo bile acid synthesis, FGF19 and M70 inhibit fatty acid synthesis and de novo lipogenesis. Hepatic lipotoxicity is believed to be essential for the progression of NASH to advanced liver diseases. “Toxic” lipids are also important mediators of inflammatory signals. Using MS‐based lipidomic analysis, we showed that FGF19 and M70 profoundly reduce intrahepatic triacylglycerol and diacylglycerol lipid species, suppress the expression of key genes in ceramide biosynthetic pathways (including serine palmitoyltransferases and sphingomyelinases), and reduce the levels of hepatic ceramide. A recent metabolomics study showed that hepatic and plasma concentrations of ceramides were increased in patients with NASH and constituted a marker signature distinguishing NASH from simple steatosis.36 Furthermore, ceramide is proposed as a common molecular intermediate linking metabolic stress to the induction of insulin resistance.42 Recent reports have shown that genes that increase ceramide production, including Smpd3 and Sptlc2, have upstream FXR binding sites and were identified as direct FXR target genes in reporter gene assays.43 Notably, T‐βMCA, a naturally occurring FXR antagonist, was enriched in livers harvested from FGF19‐ and M70‐treated mice and could directly suppress hepatic ceramide production through FXR inhibition. Interestingly, we found that FGF19‐ and M70‐treated livers contained significantly elevated levels of unoxidized cardiolipin, a phospholipid component of the inner mitochondrial membrane. Mitochondrial metabolism occupies the nexus connecting steatosis, oxidative stress, insulin resistance, and metabolic dysregulation and is indispensable for liver function. Chronic activation of mitochondria in the setting of lipid overload could predispose the liver to oxidative stress, leading to oxidation and depletion of cardiolipin and accelerated cell death.38 FGF19 and M70 treatment increased unoxidized cardiolipin species and reduced hepatic ROS, indicating conditions of reduced oxidative stress and improved mitochondrial inner membrane integrity. Furthermore, a recent study revealed that FGF19 can stimulate transintestinal cholesterol excretion through the sterol‐exporting heterodimer ABCG5/ABCG8 located in the intestine.44 Finally, we demonstrated that FGF19 and M70 improve glucose tolerance and enhance insulin sensitivity and energy homeostasis in the context of diet‐induced NASH. Therefore, FGF19‐based therapies and nontumorigenic variants of FGF19 in particular can engage and amend multiple dysregulated pathways in NASH to confer liver protection.
NASH can progress to liver fibrosis, the key determinant of a variety of clinical outcomes, including cirrhosis, liver failure, HCC, and liver transplantation.45 Overall mortality as well as liver‐related mortality increase with fibrosis in patients with NASH. In this study, we showed that FGF19 and M70 demonstrated robust antifibrotic activity as evidenced by both histologic assessment and molecular characterization. We further showed that markers of activated stellate cells and myofibroblasts, the primary cell types responsible for the synthesis of collagen in liver fibrogenesis, are reduced with FGF19 and M70 treatment. Although it remains unknown whether FGF19 directly acts on stellate cells, bile acids have an established role in hepatic stellate cell activation.8 The antifibrotic effects of FGF19 and M70 could be an outcome of modulating bile acid synthesis within the hepatic milieu.
Although much of its biological activity is manifested in the liver, FGF19 expression is induced in response to FXR activation in the ileum.12 It is well established that FXR is a master regulator of bile acid metabolism, but conflicting reports have been published on the role of intestinal FXR in glucose metabolism and insulin sensitivity. While activation of intestinal FXR by gut‐restricted fexaramine reduces obesity and insulin resistance by promoting adipose tissue browning,46 intestinal FXR activation was also reported to promote NAFLD.47 We showed here that FGF19 can rapidly and robustly resolve NASH, despite hepatic FXR inhibition through T‐βMCA accumulation. It is therefore possible that intestinal FXR activation and the resulting induction of FGF19 is the major contributor to the anti‐NASH effects of systemic FXR ligands, such as obeticholic acid.48 Our findings also inform a long‐standing debate regarding the roles and contributions of intestinal and liver FXR in bile acid, glucose, and cholesterol metabolism. Together, our data argue against approaches aiming at intestinal FXR inhibition, which reduces FGF19 production, as a means for treating metabolic disorders.
In summary, we provide compelling evidence that an engineered form of FGF19, M70, demonstrates robust and profound antisteatotic, anti‐inflammatory, and antifibrotic activities in diet‐induced mouse models of NASH, representing a potentially promising approach to treat NASH, a condition for which there are no approved therapies. Further studies are needed to evaluate whether the benefits we observed in this report can be translated in humans. Clinical trials testing the impact of M70 in human patients with NASH are underway (www.clinicaltrials.gov, NCT02443116).
Author names in bold designate shared co‐first authorship.
Supporting information
Additional Supporting Information may be found at onlinelibrary.wiley.com/doi/10.1002/hep4.1108/full.
Supporting Information 1
Acknowledgment
We thank Drs. Jin‐Long Chen, Jian Luo, and Maria Deato for advice and insightful discussions. We thank Hong Yang, Danielle Holland, and Iris Ngan for technical assistance and the NGM vivarium staff for the care of animals used in the studies.
Potential conflict of interest: All authors are employees and stockholders of NGM Biopharmaceuticals, Inc.
Supported by NGM Biopharmaceuticals, Inc.
REFERENCES
- 1. Rinella M, Charlton M. The globalization of nonalcoholic fatty liver disease: prevalence and impact on world health. Hepatology 2016;64:19‐22. [DOI] [PubMed] [Google Scholar]
- 2. Wong RJ, Aguilar M, Cheung R, Perumpail RB, Harrison SA, Younossi ZM, et al. Nonalcoholic steatohepatitis is the second leading etiology of liver disease among adults awaiting liver transplantation in the United States. Gastroenterology 2015;148:547‐555. [DOI] [PubMed] [Google Scholar]
- 3. Cusi K. Role of obesity and lipotoxicity in the development of nonalcoholic steatohepatitis: pathophysiology and clinical implications. Gastroenterology 2012;142:711‐725.e716. [DOI] [PubMed] [Google Scholar]
- 4. Arab JP, Karpen SJ, Dawson PA, Arrese M, Trauner M. Bile acids and nonalcoholic fatty liver disease: molecular insights and therapeutic perspectives. Hepatology 2017;65:350‐362. [DOI] [PMC free article] [PubMed] [Google Scholar]
- 5. Allen K, Jaeschke H, Copple BL. Bile acids induce inflammatory genes in hepatocytes: a novel mechanism of inflammation during obstructive cholestasis. Am J Pathol 2011;178:175‐186. [DOI] [PMC free article] [PubMed] [Google Scholar]
- 6. Sokol RJ, Straka MS, Dahl R, Devereaux MW, Yerushalmi B, Gumpricht E, et al. Role of oxidant stress in the permeability transition induced in rat hepatic mitochondria by hydrophobic bile acids. Pediatr Res 2001;49:519‐531. [DOI] [PubMed] [Google Scholar]
- 7. Adachi T, Kaminaga T, Yasuda H, Kamiya T, Hara H. The involvement of endoplasmic reticulum stress in bile acid‐induced hepatocellular injury. J Clin Biochem Nutr 2014;54:129‐135. [DOI] [PMC free article] [PubMed] [Google Scholar]
- 8. Svegliati‐Baroni G, Ridolfi F, Hannivoort R, Saccomanno S, Homan M, De Minicis S, et al. Bile acids induce hepatic stellate cell proliferation via activation of the epidermal growth factor receptor. Gastroenterology 2005;128:1042‐1055. [DOI] [PubMed] [Google Scholar]
- 9. Ferslew BC, Xie G, Johnston CK, Su M, Stewart PW, Jia W, et al. Altered bile acid metabolome in patients with nonalcoholic steatohepatitis. Dig Dis Sci 2015;60:3318‐3328. [DOI] [PMC free article] [PubMed] [Google Scholar]
- 10. Aranha MM, Cortez‐Pinto H, Costa A, da Silva IB, Camilo ME, de Moura MC, et al. Bile acid levels are increased in the liver of patients with steatohepatitis. Eur J Gastroenterol Hepatol 2008;20:519‐525. [DOI] [PubMed] [Google Scholar]
- 11. Mouzaki M, Wang AY, Bandsma R, Comelli EM, Arendt BM, Zhang L, et al. Bile acids and dysbiosis in non‐alcoholic fatty liver disease. PLoS One 2016;11:e0151829. [DOI] [PMC free article] [PubMed] [Google Scholar]
- 12. Kliewer SA, Mangelsdorf DJ. Bile acids as hormones: the FXR‐FGF15/19 pathway. Dig Dis 2015;33:327‐331. [DOI] [PMC free article] [PubMed] [Google Scholar]
- 13. Wojcik M, Janus D, Dolezal‐Oltarzewska K, Kalicka‐Kasperczyk A, Poplawska K, Drozdz D, et al. A decrease in fasting FGF19 levels is associated with the development of non‐alcoholic fatty liver disease in obese adolescents. J Pediatr Endocrinol Metab 2012;25:1089‐1093. [DOI] [PubMed] [Google Scholar]
- 14. Eren F, Kurt R, Ermis F, Atug O, Imeryuz N, Yilmaz Y. Preliminary evidence of a reduced serum level of fibroblast growth factor 19 in patients with biopsy‐proven nonalcoholic fatty liver disease. Clin Biochem 2012;45:655‐658. [DOI] [PubMed] [Google Scholar]
- 15. Alisi A, Ceccarelli S, Panera N, Prono F, Petrini S, De Stefanis C, et al. Association between serum atypical fibroblast growth factors 21 and 19 and pediatric nonalcoholic fatty liver disease. PLoS One 2013;8:e67160. [DOI] [PMC free article] [PubMed] [Google Scholar]
- 16. Degirolamo C, Sabba C, Moschetta A. Therapeutic potential of the endocrine fibroblast growth factors FGF19, FGF21 and FGF23. Nat Rev Drug Discov 2016;15:51‐69. [DOI] [PubMed] [Google Scholar]
- 17. Tomlinson E, Fu L, John L, Hultgren B, Huang X, Renz M, et al. Transgenic mice expressing human fibroblast growth factor‐19 display increased metabolic rate and decreased adiposity. Endocrinology 2002;143:1741‐1747. [DOI] [PubMed] [Google Scholar]
- 18. Alvarez‐Sola G, Uriarte I, Latasa MU, Fernandez‐Barrena MG, Urtasun R, Elizalde M, et al. Fibroblast growth factor 15/19 (FGF15/19) protects from diet‐induced hepatic steatosis: development of an FGF19‐based chimeric molecule to promote fatty liver regeneration. Gut 2017;66:1818‐1828. [DOI] [PubMed] [Google Scholar]
- 19. Nicholes K, Guillet S, Tomlinson E, Hillan K, Wright B, Frantz GD, et al. A mouse model of hepatocellular carcinoma: ectopic expression of fibroblast growth factor 19 in skeletal muscle of transgenic mice. Am J Pathol 2002;160:2295‐2307. [DOI] [PMC free article] [PubMed] [Google Scholar]
- 20. Zhou M, Wang X, Phung V, Lindhout DA, Mondal K, Hsu JY, et al. Separating tumorigenicity from bile acid regulatory activity for endocrine hormone FGF19. Cancer Res 2014;74:3306‐3316. [DOI] [PubMed] [Google Scholar]
- 21. Zhou M, Yang H, Learned RM, Tian H, Ling L. Non‐cell‐autonomous activation of IL‐6/STAT3 signaling mediates FGF19‐driven hepatocarcinogenesis. Nat Commun 2017;8:15433. [DOI] [PMC free article] [PubMed] [Google Scholar]
- 22. Luo J, Ko B, Elliott M, Zhou M, Lindhout DA, Phung V, et al. A nontumorigenic variant of FGF19 treats cholestatic liver diseases. Sci Transl Med 2014;6:247ra100. [DOI] [PubMed] [Google Scholar]
- 23. Zhou M, Learned RM, Rossi SJ, DePaoli AM, Tian H, Ling L. Engineered fibroblast growth factor 19 reduces liver injury and resolves sclerosing cholangitis in Mdr2‐deficient mice. Hepatology 2016;63:914‐929. [DOI] [PMC free article] [PubMed] [Google Scholar]
- 24. Charlton M, Krishnan A, Viker K, Sanderson S, Cazanave S, McConico A, et al. Fast food diet mouse: novel small animal model of NASH with ballooning, progressive fibrosis, and high physiological fidelity to the human condition. Am J Physiol Gastrointest Liver Physiol 2011;301:G825‐G834. [DOI] [PMC free article] [PubMed] [Google Scholar]
- 25. Clapper JR, Hendricks MD, Gu G, Wittmer C, Dolman CS, Herich J, et al. Diet‐induced mouse model of fatty liver disease and nonalcoholic steatohepatitis reflecting clinical disease progression and methods of assessment. Am J Physiol Gastrointest Liver Physiol 2013;305:G483‐G495. [DOI] [PubMed] [Google Scholar]
- 26. van der Poorten D, Samer CF, Ramezani‐Moghadam M, Coulter S, Kacevska M, Schrijnders D, et al. Hepatic fat loss in advanced nonalcoholic steatohepatitis: are alterations in serum adiponectin the cause? Hepatology 2013;57:2180‐2188. [DOI] [PubMed] [Google Scholar]
- 27. Verma S, Jensen D, Hart J, Mohanty SR. Predictive value of ALT levels for non‐alcoholic steatohepatitis (NASH) and advanced fibrosis in non‐alcoholic fatty liver disease (NAFLD). Liver Int 2013;33:1398‐1405. [DOI] [PubMed] [Google Scholar]
- 28. Starley BQ, Calcagno CJ, Harrison SA. Nonalcoholic fatty liver disease and hepatocellular carcinoma: a weighty connection. Hepatology 2010;51:1820‐1832. [DOI] [PubMed] [Google Scholar]
- 29. Russell DW. Fifty years of advances in bile acid synthesis and metabolism. J Lipid Res 2009;50 (Suppl:)S120‐S125. [DOI] [PMC free article] [PubMed] [Google Scholar]
- 30. Puri P, Baillie RA, Wiest MM, Mirshahi F, Choudhury J, Cheung O, et al. A lipidomic analysis of nonalcoholic fatty liver disease. Hepatology 2007;46:1081‐1090. [DOI] [PubMed] [Google Scholar]
- 31. Gorden DL, Ivanova PT, Myers DS, McIntyre JO, VanSaun MN, Wright JK, et al. Increased diacylglycerols characterize hepatic lipid changes in progression of human nonalcoholic fatty liver disease; comparison to a murine model. PLoS One 2011;6:e22775. [DOI] [PMC free article] [PubMed] [Google Scholar]
- 32. Bhatnagar S, Damron HA, Hillgartner FB. Fibroblast growth factor‐19, a novel factor that inhibits hepatic fatty acid synthesis. J Biol Chem 2009;284:10023‐10033. [DOI] [PMC free article] [PubMed] [Google Scholar]
- 33. Perry RJ, Samuel VT, Petersen KF, Shulman GI. The role of hepatic lipids in hepatic insulin resistance and type 2 diabetes. Nature 2014;510:84‐91. [DOI] [PMC free article] [PubMed] [Google Scholar]
- 34. Chavez JA, Summers SA. A ceramide‐centric view of insulin resistance. Cell Metab 2012;15:585‐594. [DOI] [PubMed] [Google Scholar]
- 35. Pagadala M, Kasumov T, McCullough AJ, Zein NN, Kirwan JP. Role of ceramides in nonalcoholic fatty liver disease. Trends Endocrinol Metab 2012;23:365‐371. [DOI] [PMC free article] [PubMed] [Google Scholar]
- 36. Alonso C, Fernandez‐Ramos D, Varela‐Rey M, Martinez‐Arranz I, Navasa N, Van Liempd SM, et al. Metabolomic identification of subtypes of nonalcoholic steatohepatitis. Gastroenterology 2017;152:1449‐1461.e1447. [DOI] [PMC free article] [PubMed] [Google Scholar]
- 37. Kuwana T, Mackey MR, Perkins G, Ellisman MH, Latterich M, Schneiter R, et al. Bid, Bax, and lipids cooperate to form supramolecular openings in the outer mitochondrial membrane. Cell 2002;111:331‐342. [DOI] [PubMed] [Google Scholar]
- 38. Choi SY, Gonzalvez F, Jenkins GM, Slomianny C, Chretien D, Arnoult D, et al. Cardiolipin deficiency releases cytochrome c from the inner mitochondrial membrane and accelerates stimuli‐elicited apoptosis. Cell Death Differ 2007;14:597‐606. [DOI] [PubMed] [Google Scholar]
- 39. Kleiner DE, Brunt EM, Van Natta M, Behling C, Contos MJ, Cummings OW, et al.; Nonalcoholic Steatohepatitis Clinical Research Network . Design and validation of a histological scoring system for nonalcoholic fatty liver disease. Hepatology 2005;41:1313‐1321. [DOI] [PubMed] [Google Scholar]
- 40. Friedman SL. Mechanisms of hepatic fibrogenesis. Gastroenterology 2008;134:1655‐1669. [DOI] [PMC free article] [PubMed] [Google Scholar]
- 41. Kisseleva T. The origin of fibrogenic myofibroblasts in fibrotic liver. Hepatology 2017;65:1039‐1043. [DOI] [PMC free article] [PubMed] [Google Scholar]
- 42. Holland WL, Brozinick JT, Wang LP, Hawkins ED, Sargent KM, Liu Y, et al. Inhibition of ceramide synthesis ameliorates glucocorticoid‐, saturated‐fat‐, and obesity‐induced insulin resistance. Cell Metab 2007;5:167‐179. [DOI] [PubMed] [Google Scholar]
- 43. Gonzalez FJ, Jiang C, Patterson AD. An Intestinal microbiota‐farnesoid X receptor axis modulates metabolic disease. Gastroenterology 2016;151:845‐859. [DOI] [PMC free article] [PubMed] [Google Scholar]
- 44. de Boer JF, Schonewille M, Boesjes M, Wolters H, Bloks VW, Bos T, et al. Intestinal farnesoid X receptor controls transintestinal cholesterol excretion in mice. Gastroenterology 2017;152:1126‐1138.e1126. [DOI] [PubMed] [Google Scholar]
- 45. Angulo P, Kleiner DE, Dam‐Larsen S, Adams LA, Bjornsson ES, Charatcharoenwitthaya P, et al. Liver fibrosis, but no other histologic features, is associated with long‐term outcomes of patients with nonalcoholic fatty liver disease. Gastroenterology 2015;149:389‐397.e310. [DOI] [PMC free article] [PubMed] [Google Scholar]
- 46. Fang S, Suh JM, Reilly SM, Yu E, Osborn O, Lackey D, et al. Intestinal FXR agonism promotes adipose tissue browning and reduces obesity and insulin resistance. Nat Med 2015;21:159‐165. [DOI] [PMC free article] [PubMed] [Google Scholar]
- 47. Jiang C, Xie C, Li F, Zhang L, Nichols RG, Krausz KW, et al. Intestinal farnesoid X receptor signaling promotes nonalcoholic fatty liver disease. J Clin Invest 2015;125:386‐402. [DOI] [PMC free article] [PubMed] [Google Scholar]
- 48. Neuschwander‐Tetri BA, Loomba R, Sanyal AJ, Lavine JE, Van Natta ML, Abdelmalek MF, et al.; NASH Clinical Research Network . Farnesoid X nuclear receptor ligand obeticholic acid for non‐cirrhotic, non‐alcoholic steatohepatitis (FLINT): a multicentre, randomised, placebo‐controlled trial. Lancet 2015;385:956‐965. [DOI] [PMC free article] [PubMed] [Google Scholar]
Associated Data
This section collects any data citations, data availability statements, or supplementary materials included in this article.
Supplementary Materials
Additional Supporting Information may be found at onlinelibrary.wiley.com/doi/10.1002/hep4.1108/full.
Supporting Information 1