

Abstract
Alcohol consumption is a well‐established risk factor for the onset and progression of fatty liver disease. An estimated 90% of heavy drinkers are thought to develop significant liver steatosis. For these reasons, an increased understanding of the molecular basis for alcohol‐induced hepatic steatosis is important. It has become clear that autophagy, a catabolic process of intracellular degradation and recycling, plays a key role in hepatic lipid metabolism. We have shown that Rab7, a small guanosine triphosphatase known to regulate membrane trafficking, acts as a key orchestrator of hepatocellular lipophagy, a selective form of autophagy in which lipid droplets (LDs) are specifically targeted for turnover by the autophagic machinery. Nutrient starvation results in Rab7 activation on the surface of the LD and lysosomal compartments, resulting in the mobilization of triglycerides stored within the LDs for energy production. Here, we examine whether the steatotic effects of alcohol exposure are a result of perturbations to the Rab7‐mediated lipophagic pathway. Rats chronically fed an ethanol‐containing diet accumulated significantly higher levels of fat in their hepatocytes. Interestingly, hepatocytes isolated from these ethanol‐fed rats contained juxtanuclear lysosomes that exhibited impaired motility. These changes are similar to those we observed in Rab7‐depleted hepatocytes. Consistent with these defects in the lysosomal compartment, we observed a marked 80% reduction in Rab7 activity in cultured hepatocytes as well as a complete block in starvation‐induced Rab7 activation in primary hepatocytes isolated from chronic ethanol‐fed animals. Conclusion: A mechanism is supported whereby ethanol exposure inhibits Rab7 activity, resulting in the impaired transport, targeting, and fusion of the autophagic machinery with LDs, leading to an accumulation of hepatocellular lipids and hepatic steatosis. (Hepatology Communications 2017;1:140‐152)
- ALD
alcoholic liver disease
- BODIPY
boron‐dipyrromethene
- EtOH
ethanol
- GST
glutathione S‐transferase
- GTP
guanosine 5′‐triphosphate
- GTPase
guanosine triphosphatase
- HEPES
4‐(2‐hydroxyethyl)‐1‐piperazine ethanesulfonic acid
- KRH
Krebs‐Ringer‐HEPES
- LAMP2A
lysosome‐associated membrane protein 2
- LD
lipid droplet
- MVB
multivesicular body
- NIH
National Institutes of Health
- PBS
phosphate‐buffered saline
- RILP
Rab‐interacting lysosomal protein
- SQSTM1
sequestosome 1
Introduction
An early manifestation of alcoholic liver disease (ALD) is the appearance of significant quantities of fat in the liver (hepatic steatosis). With continued chronic consumption of alcohol (>40 g/day), ALD can eventually progress from relatively benign liver steatosis to more severe sequelae, including alcoholic steatohepatitis, fibrosis, or cirrhosis.1, 2 The initial accumulation of large amounts of triglyceride during ALD may prime the liver to become hypersensitive to damaging conditions, such as alcohol‐induced oxidative stress.3 This early accrual of lipid in the steatotic liver may therefore represent a “first hit” in the progression of ALD and can consequently be considered a principal target for intervention in liver disease. Importantly, simple steatosis represents a readily reversible and self‐limiting early stage of ALD. As such, it is critical that the molecular mechanisms of hepatic fat accumulation be understood in greater detail to prevent downstream damage and compromised liver function.
In most cells, neutral lipids (i.e., triglycerides and cholesterol esters) and fat‐soluble vitamins are sequestered within a specialized storage organelle, the lipid droplet (LD).4 These unique cytoplasmic structures are thought to be derived from the endoplasmic reticulum and comprise a lipid‐enriched core enclosed within a phospholipid monolayer. LDs are additionally thought to have a defined subproteome possessing a limiting membrane decorated with a dynamic protein coat that can vary with exposure to changing cellular environments.5, 6 During periods of elevated nutritional demand or cell growth, LDs can be readily catabolized for bioenergetic and biosynthetic purposes. Despite extensive knowledge regarding the synthesis and use of these organelles within the context of the adipocyte, comparatively little is known about how LDs accumulate or are degraded in other cell types, including the hepatocyte. Additionally, it is not completely understood how continuous exposure to the damaging effects of ethanol (EtOH) augments LD homeostasis at the molecular level.
A number of reports (for reviews, see Lieber7 and Donohue8) have demonstrated that EtOH exposure directly contributes to the accumulation of fat within the liver. For example, EtOH is known to activate transcription factors that in turn up‐regulate the expression of lipogenic genes.9 Furthermore, ingested EtOH can be rapidly metabolized into acetaldehyde, resulting in increased cellular levels of reduced nicotinamide adenine dinucleotide, ultimately compromising the process of β‐oxidation and further contributing to the retention of neutral lipids within the hepatocyte.10 Additionally, long‐term EtOH exposure has been shown to affect microtubule acetylation. In both primary hepatocytes and cultured hepatocyte cell models, chronic EtOH exposure was found to result in reduced levels of assembly‐competent tubulin, microtubule hyperacetylation, and stalled movement of transcytotic vesicles.11, 12 Together, these data suggest that EtOH disrupts genetic and membrane trafficking networks by varied means to elicit LD accumulation.
Another mechanism recently identified to play a key role in the regulated metabolism of hepatic LDs is autophagy, a lysosome‐driven catabolic process that can specifically target cellular cargo and organelles for breakdown.13 Evidence supports a role for EtOH intake in altered hepatic autophagy. For example, animals chronically fed an alcohol‐containing diet exhibit decreased biogenesis and proteolytic activity of lysosomes.14, 15, 16 On the other hand, acute treatments in animal binge models of EtOH exposure appear to result in elevated autophagic flux, presumably an immediate‐onset hepatoprotective response.17, 18 Short‐term alcohol exposure has additionally been shown to result in up‐regulation of selective forms of macroautophagy (i.e., mitochondria‐specific autophagy [or mitophagy]), possibly as a defense mechanism against oxidative damage.19 Alterations to other types of selective autophagy, including LD‐specific autophagy (lipophagy), however, have been poorly studied in the context of ALD.
We recently demonstrated a key role for an LD‐localized small guanosine triphosphatase (GTPase), Rab7, in hepatocellular lipophagy.20 This GTPase “switch” is well known to mediate interactions between the multivesicular body (MVB) and the lysosome, in part through linkages of these membrane‐bound compartments to a microtubule‐based motor (dynein), thereby facilitating membrane fusion.21, 22 In our previous study, we found an important role for Rab7 in mediating the recruitment of degradative compartments to the LD during hepatocellular lipophagy and that depletion of Rab7 resulted in severe morphological defects to the MVB and lysosomal compartments, resulting in LD accumulation.20 These findings suggest that this small GTPase could act as a central regulator for lipophagy in the liver.23
To determine whether EtOH exerts its damage through inhibition of key lipophagic proteins, we have examined the effects of chronic alcohol consumption on the function of Rab7 in the context of alcohol‐induced fatty liver. In this study, we find that chronic EtOH administration results in a significant accumulation of LDs in primary rat hepatocytes that are resistant to starvation‐induced turnover. The degradative components of the autophagic machinery appear morphologically altered with an aberrant distribution that is likely to prove functionally disruptive. Importantly, we find that these defects coincide with a marked inhibition of the GTPase activity of Rab7. These findings suggest that the effects of these perturbations contribute to defective hepatic lipophagy and expand our understanding of the detrimental consequences of EtOH intake at the molecular level.
Materials and Methods
ANIMALS, DIET ADMINISTRATION, HEPATOCYTE COLLECTION, CELL LINES, CONSTRUCTS, AND ANTIBODIES
Male Wistar rats weighing 175‐200 g were purchased from Charles River Laboratories (Portage, MI), paired according to weight, and fed control and ethanol‐containing Lieber‐DeCarli diets24 for 5‐8 weeks as described.25 At the termination of the feeding period, rats were sacrificed by exsanguination. Hepatocytes were isolated in Dr. Carol Casey's laboratory (Omaha, NE ) by collagenase perfusion of the livers as described25 and transported to Rochester, MN, overnight on ice. All animals received humane care according to the criteria outlined in the Guide for the Care and Use of Laboratory Animals prepared by the National Academy of Sciences and published by the National Institutes of Health (NIH publication 86‐23, revised 1985). All protocols were approved by the Institutional Animal Care and Use Committee at the VA Nebraska‐Western Iowa Health Care System Research Service. Adh1‐expressing VA‐13 hepatocytes26 were kindly provided by Terrence Donohue (University of Nebraska Medical Center) and cultured in Dulbecco's modified Eagle's medium containing 400 µg/mL zeocin. Glutathione S‐transferase (GST)–Rab‐interacting lysosomal protein (RILP) was a gift from C. Bucci (University of Salente, Lecce, Italy). The construct was expressed in Escherichia coli BL21 cells and purified using glutathione‐coated beads (Amersham‐Pharmacia) according to the manufacturer's instructions. Antibodies used for immunoblotting included actin (Sigma #A2066), GST (Santa Cruz #sc‐138), sequestosome 1 (SQSTM1)/p62 (Cell Signaling #5114), LC3B (Novus #NB600‐1384), and Rab7 (Cell Signaling #9367).
HEPATOCYTE TREATMENT AND MEASUREMENT OF TRIGLYCERIDE LOSS
Primary rat hepatocytes isolated from control and ethanol‐fed animals were cultured as described.25 Briefly, hepatocytes suspended in Williams’ E media were seeded onto collagen‐coated six‐well plates with or without coverslips. After 2 hours at 37°C, cells were washed with phosphate‐buffered saline (PBS) and incubated for 4 hours in either Williams’ E media with 5% fetal bovine serum or in the nutrient‐free buffer Krebs‐Ringer‐4‐(2‐hydroxyethyl)‐1‐piperazine ethanesulfonic acid (HEPES) (KRH) either with or without 80 µM CID1067700 (Rab7‐specific inhibitor).20, 27 Following the incubation period, cells were collected and the pellets reconstituted in PBS. An aliquot was saved for DNA and protein determination, and the remaining was used for triglyceride extraction by using the method of Folch et al.28 Aliquots of lipid extract were saponified to quantify the triglycerides using a triglyceride diagnostic kit (Thermo DMA kit; Thermo Electron Clinical Chemistry, Louisville, CO). Triglyceride levels were normalized to total DNA content. The fat loss from the cells was determined as described29 by comparing the triglyceride amount in the cell pellet after 4 hours. Percent loss from the initial (0 hour) triglyceride value was then calculated.
IMMUNOFLUORESCENT ANALYSIS OF LDs/FLUORESCENCE MICROSCOPY
For fluorescence microscopy, isolated hepatocytes were cultured on glass coverslips or glass‐bottom imaging dishes (MatTek Corporation, Ashland, MA) and subjected to the various treatments described in the results section. Lysosomes were stained in live cells using LysoTracker Blue DND‐22 (Thermo Fisher Scientific, Waltham, MA) or by first culturing cells in the presence of 100 µM tetramethylrhodamine‐dextran (3,000 molecular weight; Thermo Fisher) for 2 hours, followed by extensive washing in label‐free media and further culture for an additional 24 hours to ensure that the dextran had accumulated in a terminal endocytic compartment. Cells were fixed for microscopy in 3% formaldehyde for 20 minutes. LDs were stained for 2 minutes with Oil Red O in 60% isopropanol. Alternatively, cells were permeabilized with 0.1% Triton X‐100 for 2 minutes, washed with PBS, stained with 1 μg/mL boron‐dipyrromethene (BODIPY)493/503 fluorophore for 20 minutes at room temperature, and followed by three washes in PBS. Lysosomes were detected by immunofluorescence using a commercially available rabbit polyclonal antibody targeting lysosome‐associated membrane protein 2 (LAMP2A; Abcam #Ab18528). Coverslips were mounted on glass slides using either ProLong Gold (Thermo Fisher) or UltraCruz mounting media (Vector Laboratories, Burlingame, CA). Images were acquired using a Zeiss 510 Meta or Zeiss LSM 780 confocal laser scanning microscope (Carl Zeiss, Thornwood, NY). Quantification of LD number and size was carried out using ImageJ software (NIH, Bethesda, MD). Time‐lapse measurements of LysoTracker movement were also performed using ImageJ. A nuclear mask was applied to avoid incorporation of this region into the calculation of the Pearson's correlation coefficient.
DETERMINATION OF ACTIVE RAB7 BY GST‐RILP OR GUANOSINE 5′‐TRIPHOSPHATE BEAD PULLDOWN ASSAYS
Primary rat hepatocytes or VA‐13 hepatocytes were cultured in media as appropriate, and cell lysates were used to measure active Rab7 content using a GST‐RILP‐mediated active Rab7 pulldown assay as described.20 As an alternative, we used guanosine 5′‐triphosphate (GTP) agarose beads (Sigma‐Aldrich) to pull down active GTP‐binding proteins. VA‐13 hepatocytes were lysed in binding buffer (1 mM dithiothreitol, 20 mM HEPES pH 8.0, 150 mM NaCl, 10 mM MgCl2, and complete protease inhibitor [Roche]). GTP‐agarose beads were prewashed 3 times with binding buffer and then incubated together with cell lysate for 2 hours at 4°C, followed by a further two quick washes with binding buffer. The amount of active Rab7 in the pulldown samples was normalized to the total levels of Rab7 protein.
Results
ETHANOL EXPOSURE RESULTS IN LD ACCUMULATION AND DECREASED LYSOSOMAL MOTILITY IN PRIMARY RAT HEPATOCYTES
To evaluate the impact of chronic alcohol exposure on hepatocellular lipid accumulation, we measured LD content in primary rat hepatocytes exposed to EtOH in vivo and cultured ex vivo. Male Wistar rats were provided a Lieber‐DeCarli liquid diet containing EtOH (36% of total calories) or pair fed an isocaloric control EtOH‐free diet for a total of 6 weeks. As expected, hepatocytes isolated from alcohol‐fed animals and subsequently cultured in normal growth media on glass coverslips exhibited a significant accumulation of LDs (Fig. 1A) as quantified by measurement of the mean Oil Red O‐stained area per cell using confocal microscopy (Fig. 1B). To address the effects of continuous EtOH insult on the LD catabolic capacity of the cells, primary hepatocytes were subjected to nutrient deprivation (starvation) conditions by incubation in KRH buffer. Culture of control hepatocytes in starvation conditions resulted in a significant reduction (∼30%) in the number of BODIPY‐stained LDs after just 4 hours (Fig. 1C,D). In contrast, hepatocytes derived from alcohol‐fed animals lost noticeably fewer LDs when subjected to the same starvation conditions (Fig. 1C,D). These observations suggest that EtOH exposure attenuates the process of starvation‐induced LD breakdown.
Figure 1.
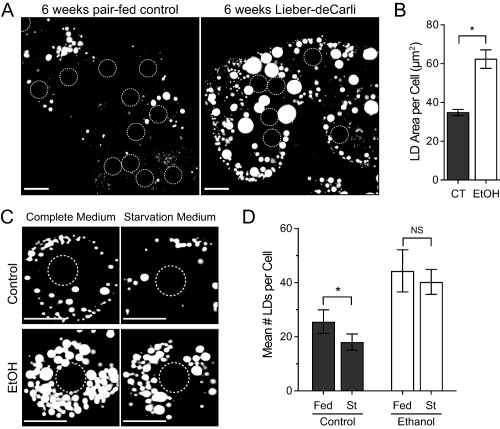
Ethanol exposure promotes LD accumulation and decreased starvation‐induced LD turnover in hepatocytes. (A) ORO staining of LDs from primary hepatocytes isolated from rats fed an ethanol‐containing (Lieber‐DeCarli) or isocaloric control diet for 6 weeks (scale bars = 20 μm). Position of nuclei are indicated by dashed circles. (B) Quantification of mean ORO‐stained LD area per cell (μm2) from n = 3 independent experiments; error bars represent the mean ± SD. Asterisks denote statistical significance as determined by two‐tailed Student t test (*P ≤ 0.05). (C) Representative images of BODIPY493/503‐stained hepatocytes isolated from control or EtOH‐fed rats subjected to 4‐hour culture in Williams’ E medium (Complete Medium) or KRH buffer (Starvation Medium). Scale bars = 20 μm. Position of nuclei are indicated by dashed circles. (D) Quantification of mean number of LDs per cell from n = 3 independent experiments; error bars represent the SD. Asterisks denote statistical significance as determined by two‐tailed Student t test (*P ≤ 0.05). Abbreviations: CT, control; NS, not significant; ORO, Oil Red O; St, starved.
Nutrient starvation is well characterized as a cue for the initiation of prosurvival catabolic pathways, such as autophagy.30 Previous reports have demonstrated an inhibitory role for EtOH in hepatocyte autophagy.31 As the LD‐selective form of autophagy (lipophagy) plays a critical role in LD turnover, we examined the effects of EtOH exposure on lysosomal morphology in live hepatocytes to determine whether this key autophagic compartment was compromised. Acidic organelles (i.e., late endosomes and lysosomes) were stained with LysoTracker Blue and imaged. The size and aggregation of individual LysoTracker‐positive puncta were accentuated in hepatocytes isolated from EtOH‐fed rats (Fig. 2A). The mean area of individual LysoTracker‐positive puncta in live cells was increased by approximately 25% in hepatocytes isolated from EtOH‐fed rats (P = 0.057).
Figure 2.
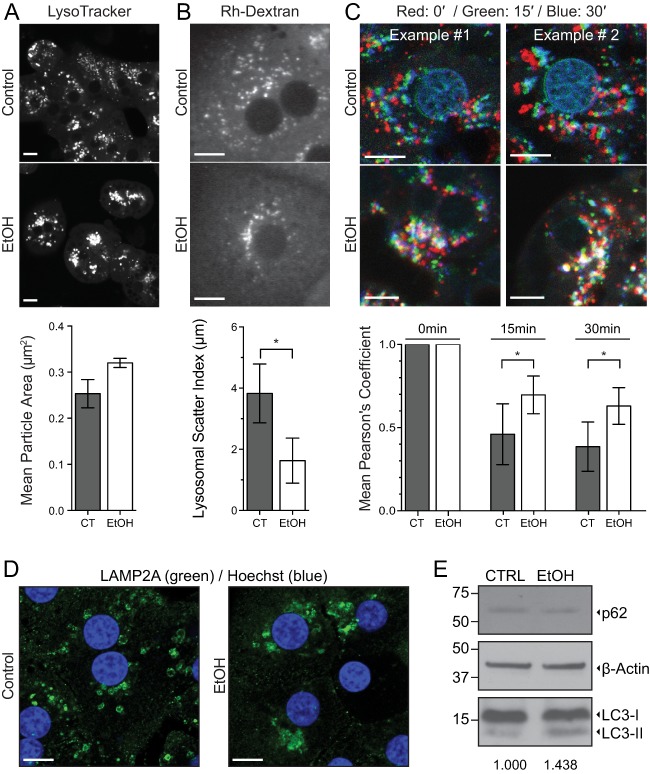
Ethanol exposure results in decreased lysosomal motility in primary rat hepatocytes. (A) LysoTracker staining of acidic compartments in live primary hepatocytes isolated from EtOH‐ or control pair‐fed rats (scale bar = 20 μm). Measurement of the mean area (μm2) of individual LysoTracker‐positive structures was calculated and is displayed beneath representative images. The mean area of LysoTracker‐positive puncta was increased by nearly 25% in hepatocytes isolated from EtOH‐fed rats (P = 0.057). (B) Primary hepatocytes isolated from EtOH‐ or control pair‐fed rats were pulse labeled with Rh‐Dextran and chased in label‐free medium for 24 hours to identify terminal endocytic compartments (scale bar = 10 μm). As a readout for positioning and mobility (scatter) of lysosomes within the cell, the distances of individual Rh‐Dextran‐positive particles were measured from the center of the nucleus. The range of values between the twenty‐fifth and seventy‐fifth percentile of distances (in micrometers) is displayed below representative images, indicative of juxtanuclear clustering of lysosomes in hepatocytes from alcohol‐treated rats. (C) As an alternative approach for visualization of lysosomal mobility within the hepatocyte, LysoTracker was used for staining of acidic compartments in live cells. Positions of the lysosomes at three time points (0′, 15′, and 30′) have been overlaid and pseudocolored in the red, green, and blue channels, respectively (scale bar = 10 μm). Average overlap of the channels between the initial and labeled time point from four independent time‐lapse series was quantified by Pearson's correlation coefficient and is displayed below the images. For panels A and B, data represent n = 3 independent experiments; error bars represent the mean ± SD. Asterisks denote statistical significance as determined by two‐tailed Student t test (*P ≤ 0.05). (D) Immunofluorescence analysis of lysosome positioning in formaldehyde‐fixed primary hepatocytes isolated from control pair‐fed or chronic EtOH‐fed rats. Lysosomes were detected using a polyclonal antibody targeting LAMP2A. Nuclei are stained with DAPI and depicted in blue (scale bar = 10 μm). (E) Immunoblotting analysis of cell lysates from control pair‐fed or chronic EtOH‐fed rats. The mean LC3‐II:actin ratio from three independent pairs of rats (normalized to the control condition) is shown below the panel. Abbreviations: CT, control; Rh‐Dextran, rhodamine‐dextran.
This juxtanuclear localization of LysoTracker‐positive structures (Fig. 2A) suggested a direct effect of alcohol exposure on lysosomal mobility and dispersion. Therefore, primary rat hepatocytes from control or EtOH‐fed animals were isolated and incubated with rhodamine‐labeled dextran for 2 hours, followed by a 24‐hour chase in label‐free medium (to specifically label terminal endocytic compartments) prior to fixation and imaging. The average distances of fluorescently labeled puncta from the nucleus were subsequently measured and quantified. Lysosomal scatter was calculated by examining the spread of lengths between the twenty‐fifth and seventy‐fifth percentiles of lysosome–nuclear distances. These data indicated that lysosomes from EtOH‐exposed hepatocytes showed considerably greater variability in distance to the nucleus (i.e., scatter) compared to control (Fig. 2B). We monitored this effect further in live cells stained with LysoTracker Blue and imaged for 30 minutes (Fig. 2C). We found that after just 15 minutes of imaging, a significant defect in lysosomal movement throughout the cell could be observed. Positions of lysosomes at three time points (0 minute, 15 minutes, and 30 minutes) were overlaid and pseudocolored in the red, green, and blue channels, respectively. White color, therefore, represents overlap and defective motility. Hepatocytes isolated from EtOH‐treated rats exhibited significantly decreased lysosomal motility, as shown in the quantification below the representative images. To verify that the clustering phenotype observed in live cells represented the lysosomal compartment, we performed immunofluorescence on formaldehyde‐fixed hepatocytes isolated from chronic EtOH‐ or pair‐fed rats. Antibody staining against the lysosome‐associated membrane glycoprotein LAMP2A (Fig. 2D) revealed the same juxtanuclear distribution observed in Fig. 2A‐C.
To assess whether global autophagic flux is affected in response to chronic EtOH consumption, hepatocytes were isolated from three pairs of alcohol‐ or pair‐fed rats. Cell lysates were prepared and blotted for classic markers of autophagy (LC3B and p62). Interestingly, only modest increases (∼1.4‐fold) in the LC3‐II:actin ratio were observed in hepatocytes isolated from chronic EtOH‐fed rats (Fig. 2E). This result is in agreement with LC3 immunoblotting data from chronic EtOH feeding in mice14 and suggests that canonical macroautophagy may not be affected by chronic EtOH exposure to the same degree as alternative autophagic pathways, such as microautophagy, which involve direct interactions between the lysosomal compartment and the cargo targeted for degradation (i.e., the LD). Taken together, these results show that EtOH severely compromises subcellular lysosomal distribution, ultimately contributing to hepatic LD accumulation over time.
INHIBITION OF THE SMALL GTPASE RAB7 MIMICS ETOH EXPOSURE AND PREVENTS STARVATION‐INDUCED LD BREAKDOWN IN PRIMARY RAT HEPATOCYTES
To further investigate potential connections between an EtOH‐induced impairment of the lysosomal compartment and increased LD accumulation in hepatocytes, the capacity of cultured primary hepatocytes to undergo starvation‐induced LD breakdown was analyzed. Livers were harvested from rats fed a control or EtOH‐containing diet, and hepatocytes were isolated and cultured for 4 hours in the presence of full‐serum medium (10% fetal bovine serum) or serum‐free KRH buffer to stimulate starvation‐induced LD breakdown. The number and size of LDs (stained with BODIPY493/502 in Fig. 3A) were increased substantially in hepatocytes isolated from EtOH‐fed animals compared to control, in agreement with the results from Fig. 1C,D. Following 4 hours of nutrient depletion, visible turnover of LDs had occurred in control hepatocytes, whereas the magnitude of LD breakdown was muted dramatically in EtOH‐treated hepatocytes. These observations were supported by biochemical measurements of total cellular triglycerides after culture in the same media conditions (Fig. 3B). Importantly, we found that the starvation‐induced triacylglycerol turnover was blunted nearly 4‐fold in primary hepatocytes isolated from EtOH‐fed rats, indicating that chronic ETOH exposure markedly disrupts LD catabolism in these cells.
Figure 3.
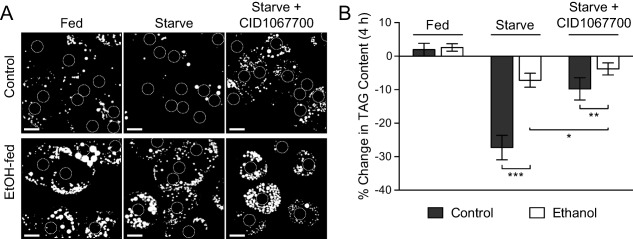
Ethanol feeding or Rab7 inhibition prevents starvation‐induced LD breakdown in primary rat hepatocytes. (A) Hepatocytes were isolated from rats fed an EtOH‐containing or isocaloric control diet for 6 weeks and subsequently plated and cultured for 4 hours in full‐serum medium (fed) or KRH buffer (starved) ± the Rab7 inhibitor CID1067700. Cells were then incubated with BODIPY493/502 to label LDs and imaged by confocal microscopy. Note the significant reduction of LDs in the control hepatocytes in response to starvation that is not seen in cells isolated from EtOH‐fed animals. Treatment of control cells with the Rab7 inhibitory drug CID1067700 prevents the starvation‐mediated loss of LDs, similar to the effects of chronic EtOH exposure alone. Position of nuclei are indicated by dashed circles. Scale bars = 20 μm. (B) Biochemical measurement of the percentage change in triglyceride content after 4 hours of culture in the same conditions as in Fig. 3A. Control cells exhibit a 25% reduction in TAG content upon starvation while the response in cells from EtOH‐damaged livers is significantly inhibited. Treatment of control cells with the Rab7 inhibitory drug CID1067700 reduces LD catabolism 2‐3‐fold in both control and EtOH‐exposed hepatocytes. Data represent n = 5 independent experiments; error bars represent the mean ± SD. Asterisks denote statistical significance as determined by two‐tailed Student t test (*P ≤ 0.05; **P ≤ 0.01; ***P ≤ 0.001). Abbreviation: TAG, triacylglycerol.
Our finding that EtOH exposure inhibits starvation‐induced LD turnover is reminiscent of effects we recently observed upon inhibition of the small regulatory GTPase Rab7 in cultured cell lines.20 We demonstrated that Rab7 functions as a key orchestrator of starvation‐induced lipophagic turnover of LDs in cultured cells, indicating that this switch could provide a central regulatory function for lipophagy in hepatocytes.23 We confirmed that pharmacological inhibition of Rab7 with CID1067700, a guanine nucleotide‐binding inhibitor with particular efficacy against Rab7,32 attenuated starvation‐induced LD breakdown and triacylglycerol turnover in primary rat hepatocytes (Fig. 3A,B). Treatment with the Rab7 inhibitor resulted in a significant attenuation of starvation‐induced LD breakdown that was on the same order of magnitude as chronic EtOH exposure alone (Fig. 3A). The similarities between the effects of either EtOH treatment or Rab7 inhibition on the morphology of the lysosomal compartment and LD breakdown, as observed above and previously,20 suggested that EtOH possibly exerts its detrimental effects through the inhibition of key lipophagic regulators, such as Rab7.
ETHANOL EXPOSURE DECREASES RAB7 ACTIVITY IN CULTURED CELLS AND PREVENTS STARVATION‐INDUCED RAB7 ACTIVATION IN PRIMARY RAT HEPATOCYTES
The findings described above show that hepatocytes damaged by EtOH exposure or subjected to pharmacological inhibition of Rab7 share similar phenotypic defects. To further connect these perturbations in a functional way, it was important to test if EtOH damage directly attenuated the activity of Rab7. To this end, we used an established assay to monitor the GTPase activity of Rab7. Upon nucleotide loading, members of the Rab family of small GTPases become activated, allowing for the recruitment of specific adaptors, membrane tethering factors, and motor proteins (referred to as effectors) that together support the numerous vesicular trafficking events occurring within the cell.33 In the case of Rab7, the GTP‐loaded and active form of this protein exhibits a strong affinity for the RILP, an effector that promotes the recruitment of dynein–dynactin complexes to lysosomes for subsequent transport and fusion.22, 34 Accordingly, a GST‐tagged form of RILP was used in a pulldown assay to measure total Rab7 activity in EtOH‐metabolizing VA‐13 cells, a widely used HepG2 hepatoma‐derived cell line that stably expresses alcohol dehydrogenase.26, 35 An EtOH exposure of 24 hours led to a dramatic decrease in the activity of Rab7 (Fig. 4A), as measured by the decreased affinity of this GTPase for the RILP effector. As an alternative approach, agarose‐immobilized GTP beads were used to assess Rab7 activity.20 In support of the RILP binding assay, EtOH‐treated VA‐13 cells exhibited a > 80% reduction in active Rab7 compared to control (Fig. 4B). Importantly, the amount of total Rab7 was unchanged in these cells following acute alcohol exposure.
Figure 4.
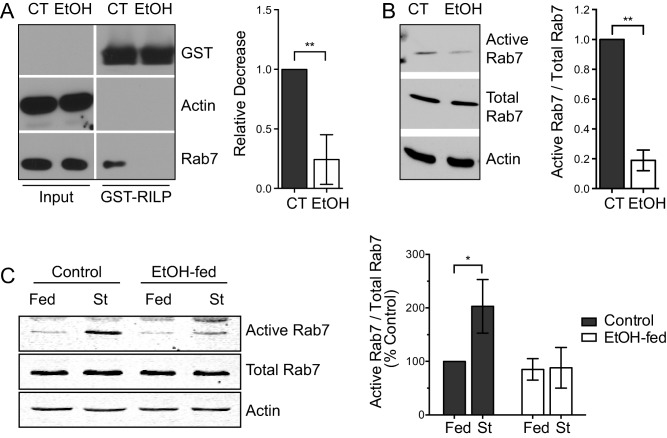
Ethanol exposure decreases Rab7 activity in cultured cells and prevents starvation‐induced activation of Rab7 in primary rat hepatocytes. (A) VA‐13 hepatoma cells were cultured in the presence or absence of 50 mM EtOH for 24 hours. Rab7 activity was assayed by employing an effector pulldown strategy using RILP‐GST to assess GTP‐loaded (active) Rab7 content. Rab7 activity was found to be significantly inhibited in EtOH‐treated cells. (B) As an alternative approach, GTP‐conjugated agarose beads were used to pull down active Rab7 from the same cells. A similar ∼80% reduction in activity following alcohol exposure was observed using this assay. (C) GST‐RILP pulldowns were used to analyze the effects of starvation‐induced Rab7 activation in primary hepatocytes isolated from control or EtOH‐fed rats. Following isolation, cells were plated and cultured for an additional 4 hours in either full‐serum medium or KRH buffer (starved). The starvation‐induced activation of Rab7 in control hepatocytes was found to be almost completely abrogated in hepatocytes isolated from EtOH‐fed animals. Experiments represent n = 3 independent experiments; error bars represent the mean ± SD. Asterisks denote statistical significance as determined by two‐tailed Student t test (*P ≤ 0.05; **P ≤ 0.01). Abbreviation: CT, control; St, starved.
As Rab7 is activated upon nutrient depletion to promote LD turnover by lipophagy,20 we next examined whether long‐term chronic exposure to EtOH directly perturbed this activation step in primary cells. Hepatocytes were isolated from the livers of rats fed either a control or alcohol‐containing diet and cultured for 4 hours in the presence of full‐serum medium or KRH buffer to induce starvation‐induced LD turnover. GST‐RILP pulldowns were again used to monitor the levels of Rab7 activity in these cells. In support of the studies with acute EtOH exposure, significantly more Rab7 (2‐3‐fold) was pulled down from hepatocytes isolated from control rat livers following nutrient depletion (Fig. 4C) compared to EtOH‐damaged cells, which exhibited essentially no activation of this Rab GTPase.
Discussion
The goal of this study was to determine the effects of chronic EtOH consumption on the activity of known regulators of hepatocellular lipophagy. We provide evidence that Rab7, a small GTPase known to mediate membrane trafficking within the late endocytic pathway33 as well as lipophagy,20 represents a novel target of long‐term EtOH consumption that ultimately results in reduced hepatic lipid turnover. Following a 6‐week period of chronic EtOH feeding, a significant accumulation of LDs was observed in primary rat hepatocytes that are resistant to starvation‐induced turnover. Importantly, we found that lysosomes, the key degradative compartments of the autophagic machinery, exhibited diminished motility coupled with an aberrant cytoplasmic distribution. The net effect of these perturbations likely contributes to the compromised turnover of autophagic cargo. Furthermore, these defects occurred concomitantly with a severe inhibition to the activation potential of the small GTPase Rab7, also known to participate in LD and lysosome dynamics. Indeed, nutrient deprivation of hepatocytes derived from animals chronically administered EtOH have a diminished capacity for Rab7 activation. Together with our previous data highlighting the importance of Rab7 activity in mediating interactions between lysosomes/MVBs and the LD,20 we showed that EtOH‐induced inhibition of this small GTPase is detrimental to hepatic lipophagy, expanding our understanding of the consequences of long‐term alcohol consumption and its relationship to lipid homeostasis at the molecular level.
IMPORTANCE OF LYSOSOMAL MOTILITY DURING HEPATIC LIPOPHAGY
The findings reported here provide further evidence that an intact system of autophagic machinery is essential to facilitate hepatic LD turnover. It is likely that the existence of a functional degradative compartment (i.e., the lysosome) is key to the efficient autophagic catabolism of cargo. Perturbations to lysosomes as a result of EtOH exposure, whether by impaired degradative capacity or an inability to traffic to or fuse with autophagosomes, would likely result in the accumulation of cargo within the cell. Indeed, one report alluded to the effects of chronic EtOH consumption on fusion between the lysosome and autophagosome, although no specific molecular targets of EtOH were identified.36 Here, we propose that the small GTPase Rab7 may function as an important downstream target of alcohol overuse and may simultaneously affect lysosomal function as well as recruitment of autophagic cargo to the LD surface during lipophagic flux.
EtOH‐mediated inhibition of lysosomal motility throughout the cell may exacerbate other consequences of alcohol consumption, including reduced lysosomal numbers and decreased activity of lysosomal enzymes.37 In addition to decreased movement of degradative compartments along the microtubule network, the effects of EtOH are likely to inhibit motility of LDs themselves, organelles also known to exhibit direct links to the microtubule network. In fact, nutrient limitation was shown to promote LD dispersion along detyrosinated microtubules to the cell periphery, promoting interactions between the LD and mitochondria for β‐oxidation.38 Proteins regulating the movement of LDs are only now beginning to be understood. For example, the kinesin‐1‐binding protein Halo is resident on LDs and was recently demonstrated to promote plus‐end microtubule‐based transport of LDs in Drosophila embryos.39 Further identification of proteins necessary for bringing the lysosome and LD into close apposition (and how these interactions are altered by EtOH exposure) is an important focus of future studies.
RAB7 AS A NEW TARGET OF ETOH‐INDUCED DAMAGE
A unique feature of the LD, a key organelle in the biology of ALD, is the dynamic protein complement associated with its phospholipid monolayer. Because the LD membrane is not a bilayer, stably associated transmembrane proteins are not a feature of this organelle. Instead, LD‐linked proteins are found to associate through alternative mechanisms (i.e., lipid modifications, hairpin loops, or amphipathic helices4). Numerous proteomic studies have shown that a significant number of Rab family members are consistently associated with the LD monolayer,5, 6, 40, 41, 42, 43, 44 likely through interactions occurring though C‐terminal prenylation sites. Among the Rabs, Rab7 and Rab18 appear to be especially prominent on the LD, as evidenced by their repeated presence in the diverse proteomic analyses listed above. Because the LD proteome is known to be altered as a result of changing cellular environments (i.e., in response to lipolytic stimulation5), we characterized the effects of EtOH on protein levels of different LD‐resident Rabs. These experiments showed that Rabs 1, 2, 5, and 7 do not exhibit EtOH‐altered changes in cellular content; Rabs 3d and 18, however, were found to be significantly reduced following chronic EtOH exposure.45 Going forward, it will be important to determine whether EtOH exposure affects the LD‐specific levels of other LD‐resident components. Such studies may provide further insights into the mechanisms whereby this triglyceride storage depot associates with other organelles and give additional clues as to the mechanisms whereby EtOH disrupts LD homeostasis.
With respect to Rab7, the exact mechanism by which EtOH might modulate the activity of this small GTPase remains unclear. Other small GTPases, including RhoA, Rac1, and Sar1a, have been found to be impaired by exposure to EtOH.46, 47, 48, 49 It is possible that EtOH directly acts on these GTPases (e.g., interfering with posttranslational lipid modifications) or perhaps functions indirectly on known guanine nucleotide exchange factors, preventing appropriate GTP cycling and an inability of these enzymes to bind nucleotide. Alternatively, secondary metabolites or oxygen radicals may result in lysine acetylation, causing structural perturbations that alter GTPase function.50 These effects will require further examination to determine the precise mechanisms whereby Rab7 might be inactivated by EtOH exposure.
Among Rab family members, studies from our laboratory and others have demonstrated only that EtOH exposure modulates the expression or cellular distribution of a subset of Rabs.45, 51, 52, 53 Therefore, the findings presented in this study are perhaps the first to demonstrate that the GTPase activity of a given Rab family member is diminished with EtOH exposure. An obvious result of reduced Rab7 GTPase activity is that cargo attachment to the dynein–dynactin complex (mediated by Rab7‐RILP) interactions) would be abrogated.22, 34 A carryover effect of this reduced trafficking would be that late endosome/lysosomal trafficking and interaction with cargo during the autophagic process would also be affected.
In summary, our findings reveal that Rab7 is an important EtOH‐sensitive node in the process of hepatic LD homeostasis. As the early fatty liver stage of ALD represents a reversible point in the progression of the disease, a better understanding of the molecular mechanisms underlying the initial accumulation of fat in the hepatocyte will be important for potential therapeutic intervention.
Author names in bold designate shared co‐first authorship.
Acknowledgment
We are grateful to Terrence Donohue (University of Nebraska Medical Center–Department of Veterans Affairs, Omaha, NE) and to members of the McNiven and Casey laboratories for helpful discussion. The content is solely the responsibility of the authors and does not necessarily represent the official views of the NIH.
Potential conflict of interest: Nothing to report.
Supported by the Department of Veterans Affairs (C.A.C.), grants 5R37DK044650 (to M.A.M.), 5R01AA020735 (to M.A.M. and C.A.C.), 5T32DK007352 (to R.J.S. and M.B.S.), National Institutes of Health Challenge Grant AA19032 (to M.A.M. and C.A.C.), the Robert and Arlene Kogod Center on Aging, and the Optical Morphology Core of the Mayo Clinic Center for Cell Signaling in Gastroenterology (P30DK084567).
REFERENCES
- 1. O'Shea RS, Dasarathy S, McCullough AJ, Practice Guideline Committee of the American Association for the Study of Liver Disease. Hepatology 2010;51:307‐328. [DOI] [PubMed] [Google Scholar]
- 2. Teli MR, Day CP, Burt AD, Bennett MK, James OF. Determinants of progression to cirrhosis or fibrosis in pure alcoholic fatty liver. Lancet 1995;346:987‐990. [DOI] [PubMed] [Google Scholar]
- 3. Mantena SK, King AL, Andringa KK, Eccleston HB, Bailey SM. Mitochondrial dysfunction and oxidative stress in the pathogenesis of alcohol‐ and obesity‐induced fatty liver diseases. Free Radic Biol Med 2008;44:1259‐1272. [DOI] [PMC free article] [PubMed] [Google Scholar]
- 4. Walther TC, Farese RV, Jr. Lipid droplets and cellular lipid metabolism. Annu Rev Biochem 2012;81:687‐714. [DOI] [PMC free article] [PubMed] [Google Scholar]
- 5. Brasaemle DL, Dolios G, Shapiro L, Wang R. Proteomic analysis of proteins associated with lipid droplets of basal and lipolytically stimulated 3T3‐L1 adipocytes. J Biol Chem 2004;279:46835‐46842. [DOI] [PubMed] [Google Scholar]
- 6. Yang L, Ding Y, Chen Y, Zhang S, Huo C, Wang Y, et al. The proteomics of lipid droplets: structure, dynamics, and functions of the organelle conserved from bacteria to humans. J Lipid Res 2012;53:1245‐1253. [DOI] [PMC free article] [PubMed] [Google Scholar]
- 7. Lieber CS. Alcoholic fatty liver: its pathogenesis and mechanism of progression to inflammation and fibrosis. Alcohol 2004;34:9‐19. [DOI] [PubMed] [Google Scholar]
- 8. Donohue TM, Jr. Alcohol‐induced steatosis in liver cells. World J Gastroenterol 2007;13:4974‐4978. [DOI] [PMC free article] [PubMed] [Google Scholar]
- 9. You M, Fischer M, Deeg MA, Crabb DW. Ethanol induces fatty acid synthesis pathways by activation of sterol regulatory element‐binding protein (SREBP). J Biol Chem 2002;277:29342‐29347. [DOI] [PubMed] [Google Scholar]
- 10. Grunnet N, Kondrup J. The effect of ethanol on the beta‐oxidation of fatty acids. Alcohol Clin Exp Res 1986;10:64S‐68S. [DOI] [PubMed] [Google Scholar]
- 11. Groebner JL, Fernandez DJ, Tuma DJ, Tuma PL. Alcohol‐induced defects in hepatic transcytosis may be explained by impaired dynein function. Mol Cell Biochem 2014;397:223‐233. [DOI] [PMC free article] [PubMed] [Google Scholar]
- 12. Yoon Y, Torok N, Krueger E, Oswald B, McNiven MA. Ethanol‐induced alterations of the microtubule cytoskeleton in hepatocytes. Am J Physiol 1998;274:G757‐766. [DOI] [PubMed] [Google Scholar]
- 13. Singh R, Kaushik S, Wang Y, Xiang Y, Novak I, Komatsu M, et al. Autophagy regulates lipid metabolism. Nature 2009;458:1131‐1135. [DOI] [PMC free article] [PubMed] [Google Scholar]
- 14. Thomes PG, Trambly CS, Fox HS, Tuma DJ, Donohue TM, Jr. Acute and chronic ethanol administration differentially modulate hepatic autophagy and transcription factor EB. Alcohol Clin Exp Res 2015;39:2354‐2363. [DOI] [PubMed] [Google Scholar]
- 15. Donohue TM, Jr. , McVicker DL, Kharbanda KK, Chaisson ML, Zetterman RK. Ethanol administration alters the proteolytic activity of hepatic lysosomes. Alcohol Clin Exp Res 1994;18:536‐541. [DOI] [PubMed] [Google Scholar]
- 16. Kharbanda KK, McVicker DL, Zetterman RK, Donohue TM, Jr. Ethanol consumption reduces the proteolytic capacity and protease activities of hepatic lysosomes. Biochim Biophys Acta 1995;1245:421‐429. [DOI] [PubMed] [Google Scholar]
- 17. Ding WX, Li M, Chen X, Ni HM, Lin CW, Gao W, et al. Autophagy reduces acute ethanol‐induced hepatotoxicity and steatosis in mice. Gastroenterology 2010;139:1740‐1752. [DOI] [PMC free article] [PubMed] [Google Scholar]
- 18. Ni HM, Du K, You M, Ding WX. Critical role of FoxO3a in alcohol‐induced autophagy and hepatotoxicity. Am J Pathol 2013;183:1815‐1825. [DOI] [PMC free article] [PubMed] [Google Scholar]
- 19. Williams JA, Ni HM, Ding Y, Ding WX. Parkin regulates mitophagy and mitochondrial function to protect against alcohol‐induced liver injury and steatosis in mice. Am J Physiol Gastrointest Liver Physiol 2015;309:G324‐340. [DOI] [PMC free article] [PubMed] [Google Scholar]
- 20. Schroeder B, Schulze RJ, Weller SG, Sletten AC, Casey CA, McNiven MA. The small GTPase Rab7 as a central regulator of hepatocellular lipophagy. Hepatology 2015;61:1896‐1907. [DOI] [PMC free article] [PubMed] [Google Scholar]
- 21. Torok N, Marks D, Hsiao K, Oswald BJ, McNiven MA. Vesicle movement in rat hepatocytes is reduced by ethanol exposure: alterations in microtubule‐based motor enzymes. Gastroenterology 1997;113:1938‐1948. [DOI] [PubMed] [Google Scholar]
- 22. Jordens I, Fernandez‐Borja M, Marsman M, Dusseljee S, Janssen L, Calafat J, et al. The Rab7 effector protein RILP controls lysosomal transport by inducing the recruitment of dynein‐dynactin motors. Curr Biol 2001;11:1680‐1685. [DOI] [PubMed] [Google Scholar]
- 23. Carmona‐Gutierrez D, Zimmermann A, Madeo F. A molecular mechanism for lipophagy regulation in the liver. Hepatology 2015;61:1781‐1783. [DOI] [PubMed] [Google Scholar]
- 24. Lieber CS, DeCarli LM. Liquid diet technique of ethanol administration: 1989 update. Alcohol Alcohol 1989;24:197‐211. [PubMed] [Google Scholar]
- 25. Casey CA, McVicker BL, Donohue TM, Jr. , McFarland MA, Wiegert RL, Nanji AA. Liver asialoglycoprotein receptor levels correlate with severity of alcoholic liver damage in rats. J Appl Physiol (1985) 2004;96:76‐80. [DOI] [PubMed] [Google Scholar]
- 26. Clemens DL, Forman A, Jerrells TR, Sorrell MF, Tuma DJ. Relationship between acetaldehyde levels and cell survival in ethanol‐metabolizing hepatoma cells. Hepatology 2002;35:1196‐1204. [DOI] [PubMed] [Google Scholar]
- 27. Agola JO, Hong L, Surviladze Z, Ursu O, Waller A, Strouse JJ, et al. A competitive nucleotide binding inhibitor: in vitro characterization of Rab7 GTPase inhibition. ACS Chem Biol 2012;7:1095‐1108. [DOI] [PMC free article] [PubMed] [Google Scholar]
- 28. Folch J, Lees M, Sloane Stanley GH. A simple method for the isolation and purification of total lipides from animal tissues. J Biol Chem 1957;226:497‐509. [PubMed] [Google Scholar]
- 29. McVicker BL, Rasineni K, Tuma DJ, McNiven MA, Casey CA. Lipid droplet accumulation and impaired fat efflux in polarized hepatic cells: consequences of ethanol metabolism. Int J Hepatol 2012;2012:978136. [DOI] [PMC free article] [PubMed] [Google Scholar]
- 30. Mizushima N, Klionsky DJ. Protein turnover via autophagy: implications for metabolism. Annu Rev Nutr 2007;27:19‐40. [DOI] [PubMed] [Google Scholar]
- 31. Donohue TM, Jr. Autophagy and ethanol‐induced liver injury. World J Gastroenterol 2009;15:1178‐1185. [DOI] [PMC free article] [PubMed] [Google Scholar]
- 32. Hong L, Guo Y, BasuRay S, Agola JO, Romero E, Simpson DS, et al. A pan‐GTPase inhibitor as a molecular probe. PLoS One 2015;10:e0134317. [DOI] [PMC free article] [PubMed] [Google Scholar]
- 33. Stenmark H. Rab GTPases as coordinators of vesicle traffic. Nat Rev Mol Cell Biol 2009;10:513‐525. [DOI] [PubMed] [Google Scholar]
- 34. Cantalupo G, Alifano P, Roberti V, Bruni CB, Bucci C. Rab‐interacting lysosomal protein (RILP): the Rab7 effector required for transport to lysosomes. EMBO J 2001;20:683‐693. [DOI] [PMC free article] [PubMed] [Google Scholar]
- 35. Peralta ER, Martin BC, Edinger AL. Differential effects of TBC1D15 and mammalian Vps39 on Rab7 activation state, lysosomal morphology, and growth factor dependence. J Biol Chem 2010;285:16814‐16821. [DOI] [PMC free article] [PubMed] [Google Scholar]
- 36. Cho HI, Choi JW, Lee SM. Impairment of autophagosome‐lysosome fusion contributes to chronic ethanol‐induced liver injury. Alcohol 2014;48:717‐725. [DOI] [PubMed] [Google Scholar]
- 37. Thomes PG, Ehlers RA, Trambly CS, Clemens DL, Fox HS, Tuma DJ, et al. Multilevel regulation of autophagosome content by ethanol oxidation in HepG2 cells. Autophagy 2013;9:63‐73. [DOI] [PMC free article] [PubMed] [Google Scholar]
- 38. Herms A, Bosch M, Reddy BJ, Schieber NL, Fajardo A, Ruperez C, et al. AMPK activation promotes lipid droplet dispersion on detyrosinated microtubules to increase mitochondrial fatty acid oxidation. Nat Commun 2015;6:7176. [DOI] [PMC free article] [PubMed] [Google Scholar]
- 39. Arora GK, Tran SL, Rizzo N, Jain A, Welte MA. Temporal control of bidirectional lipid‐droplet motion in Drosophila depends on the ratio of kinesin‐1 and its co‐factor Halo. J Cell Sci 2016;129:1416‐1428. [DOI] [PMC free article] [PubMed] [Google Scholar]
- 40. Hodges BD, Wu CC. Proteomic insights into an expanded cellular role for cytoplasmic lipid droplets. J Lipid Res 2010;51:262‐273. [DOI] [PMC free article] [PubMed] [Google Scholar]
- 41. Khan SA, Wollaston‐Hayden EE, Markowski TW, Higgins L, Mashek DG. Quantitative analysis of the murine lipid droplet‐associated proteome during diet‐induced hepatic steatosis. J Lipid Res 2015;56:2260‐2272. [DOI] [PMC free article] [PubMed] [Google Scholar]
- 42. Wang W, Wei S, Li L, Su X, Du C, Li F, et al. Proteomic analysis of murine testes lipid droplets. Sci Rep 2015;5:12070. [DOI] [PMC free article] [PubMed] [Google Scholar]
- 43. Liu P, Ying Y, Zhao Y, Mundy DI, Zhu M, Anderson RG. Chinese hamster ovary K2 cell lipid droplets appear to be metabolic organelles involved in membrane traffic. J Biol Chem 2004;279:3787‐3792. [DOI] [PubMed] [Google Scholar]
- 44. Ozeki S, Cheng J, Tauchi‐Sato K, Hatano N, Taniguchi H, Fujimoto T. Rab18 localizes to lipid droplets and induces their close apposition to the endoplasmic reticulum‐derived membrane. J Cell Sci 2005;118:2601‐2611. [DOI] [PubMed] [Google Scholar]
- 45. Rasineni K, McVicker BL, Tuma DJ, McNiven MA, Casey CA. Rab GTPases associate with isolated lipid droplets (LDs) and show altered content after ethanol administration: potential role in alcohol‐impaired LD metabolism. Alcohol Clin Exp Res 2014;38:327‐335. [DOI] [PMC free article] [PubMed] [Google Scholar]
- 46. Joshi S, Guleria RS, Pan J, Bayless KJ, Davis GE, Dipette D, et al. Ethanol impairs Rho GTPase signaling and differentiation of cerebellar granule neurons in a rodent model of fetal alcohol syndrome. Cell Mol Life Sci 2006;63:2859‐2870. [DOI] [PMC free article] [PubMed] [Google Scholar]
- 47. Petrosyan A, Cheng PW, Clemens DL, Casey CA. Downregulation of the small GTPase SAR1A: a key event underlying alcohol‐induced Golgi fragmentation in hepatocytes. Sci Rep 2015;5:17127. [DOI] [PMC free article] [PubMed] [Google Scholar]
- 48. Thakur V, Pritchard MT, McMullen MR, Wang Q, Nagy LE. Chronic ethanol feeding increases activation of NADPH oxidase by lipopolysaccharide in rat Kupffer cells: role of increased reactive oxygen in LPS‐stimulated ERK1/2 activation and TNF‐alpha production. J Leukoc Biol 2006;79:1348‐1356. [DOI] [PMC free article] [PubMed] [Google Scholar]
- 49. Lindsley TA, Shah SN, Ruggiero EA. Ethanol alters BDNF‐induced Rho GTPase activation in axonal growth cones. Alcohol Clin Exp Res 2011;35:1321‐1330. [DOI] [PMC free article] [PubMed] [Google Scholar]
- 50. Shepard BD, Tuma PL. Alcohol‐induced protein hyperacetylation: mechanisms and consequences. World J Gastroenterol 2009;15:1219‐1230. [DOI] [PMC free article] [PubMed] [Google Scholar]
- 51. Marmillot P, Rao MN, Lakshman MR. Chronic ethanol exposure in rats affects rabs‐dependent hepatic trafficking of apolipoprotein E and transferrin. Alcohol 2001;25:195‐200. [DOI] [PubMed] [Google Scholar]
- 52. Ren JC, Zhu Q, Lapaglia N, Emanuele NV, Emanuele MA. Ethanol‐induced alterations in Rab proteins: possible implications for pituitary dysfunction. Alcohol 2005;35:103‐112. [DOI] [PubMed] [Google Scholar]
- 53. Larkin JM, Oswald B, McNiven MA. Ethanol‐induced retention of nascent proteins in rat hepatocytes is accompanied by altered distribution of the small GTP‐binding protein rab2. J Clin Invest 1996;98:2146‐2157. [DOI] [PMC free article] [PubMed] [Google Scholar]