Abstract
This study investigated the role of ethanol‐inducible cytochrome P450‐2E1 (CYP2E1) in enhancing CYP2E1 and other P450 proteins in extracellular vesicles (EVs) from alcohol‐exposed rodents and human patients with alcoholism and their effects on oxidative hepatocyte injury. Female Fischer rats and wild‐type or Cyp2e1‐null mice were exposed to three oral doses of binge ethanol or dextrose control at 12‐hour intervals. Plasma EV and hepatic proteins from alcohol‐exposed rodents, patients with alcoholism, and their respective controls were isolated and characterized. The number of EVs and the amounts of EV CYP2E1, CYP2A, CYP1A1/2, and CYP4B proteins were markedly elevated in both patients with alcoholism and alcohol‐exposed rats and mice. The number of EVs and EV P450 proteins were significantly reduced in ethanol‐exposed rats fed a diet containing polyunsaturated fatty acids. The increased number of EVs and EV CYP2E1 and other P450 isoforms in alcohol‐exposed wild types were significantly reduced in the corresponding Cyp2e1‐null mice. EV CYP2E1 amounts depended on increased oxidative and endoplasmic reticulum (ER) stress because their levels were decreased by cotreatment with the antioxidant N‐acetylcysteine or the CYP2E1 inhibitor chlormethiazole but increased by ER stress‐inducer thapsigargin, which was blocked by 4‐phenylbutyric acid. Furthermore, cell death rates were elevated when primary hepatocytes or human hepatoma cells were exposed to EVs from alcohol‐exposed rodents and patients with alcoholism, demonstrating that EVs from alcohol‐exposed rats and patients with alcoholism are functional and can promote cell death by activating the apoptosis signaling pathway, including phospho‐c‐Jun N‐terminal kinase, proapoptotic Bax, and activated caspase‐3. Conclusion: CYP2E1 has an important role in elevating EV CYP2E1 and other P450 isoforms through increased oxidative and ER stress. Elevated EV‐CYP2E1 detected after withdrawal from alcohol or exposure to the CYP2E1 inducer pyrazole can be a potential biomarker for liver injury. (Hepatology Communications 2017;1:675–690)
Abbreviations
- ADH
alcohol dehydrogenase
- AFLD
alcoholic fatty liver disease
- ALD
alcoholic liver disease
- ALT
alanine aminotransferase
- APAP
acetaminophen
- BC
base‐control
- BE
base‐ethanol
- CMZ
chlormethiazole
- CYP
cytochrome P450
- CYP2E1
ethanol‐inducible cytochrome P450‐2E1
- Cyto‐D
cytochalacin‐D
- ER
endoplasmic reticulum
- EV
extracellular vesicle
- Grp78
78‐kDa glucose‐regulated protein
- iNOS
inducible nitric oxide synthase
- miRNA
microRNA
- PC
PUFA‐control
- PDI
protein disulfide isomerase
- PE
PUFA‐ethanol
- PUFA
polyunsaturated fatty acid
- ROS
reactive oxygen species
- TG
triglyceride
- TNF‐α
tumor necrosis factor‐alpha
- WT
wild‐type
Introduction
Alcohol induced liver disease (ALD) is an important cause of preventable deaths in the United States with a relatively high (30%‐40%) mortality rate within 1 month after diagnosis of alcoholic hepatitis.1 Alcohol (ethanol) is oxidized to the reactive intermediate acetaldehyde and then to acetate by the cytosolic alcohol dehydrogenase (ADH) and the mitochondrial low‐Michaelis‐Menten constant (Km) aldehyde dehydrogenase, respectively, primarily in the liver.2 Excessive amounts of alcohol can also be oxidized to acetaldehyde by ethanol‐inducible cytochrome P450‐2E1 (CYP2E1), which has a relatively high Km (9‐10 mM ethanol) and generates reactive oxygen species (ROS), including superoxide anion and hydrogen peroxide.3 Alcohol‐related medical illnesses result directly or indirectly from these toxic alcohol metabolites and changes in redox balance in target cells and tissues.
Cytochrome P450 (CYP) is a superfamily of enzymes involved in the metabolism of endogenous and exogenous compounds, such as steroids, fatty acids, alcohol, many drugs, and various small molecule chemicals, including procarcinogens.4, 5 Most of the CYP isoenzymes are located in the endoplasmic reticulum (ER), although some of the P450s, including CYP2E1,6, 7 are also localized in the mitochondria of hepatocytes and many other tissues. CYP2E1‐mediated metabolism of its substrates produces ROS and reactive metabolites, leading to increased oxidative stress and cellular toxicity.8, 9
Extracellular vesicles (EVs) are membranous rounded structures, including exosomes (40‐150 nm in diameter) and microvesicles (50‐1,000 nm).10 They are released from a variety of cells into biological fluids, such as blood (serum/plasma),11 urine,12 and cell culture media.13 In addition to lipids and proteins, EVs also contain messenger RNA, small RNAs (including microRNA [miRNA]), mitochondrial DNA, and even genomic DNA.14, 15, 16 The content of EVs and their biological functions depend on the parental cells or original cell type, such as hepatocytes and monocytes.14 Recent research indicates that EVs can influence the development and progression of diseases, such as cancer11, 13 or immunological diseases.17 The role of EV and the presence of P450 isoforms in exosomes from alcohol‐exposed rodents and humans has not been systematically studied.
This study investigated whether plasma EVs from alcohol‐exposed rodents and human patients with alcoholism contain elevated levels of CYP2E1 and other P450 isoforms and their role in oxidative stress and hepatocyte injury. In addition, we studied the underlying mechanisms by which EV CYP2E1 and other P450 isoforms are elevated through increased oxidative and ER stress. We also showed the functional role of exogenous EVs in regulating cell death rates of cultured primary hepatocytes or hepatoma cells. Finally, we evaluated whether EV CYP2E1 can be used as a potential biomarker of alcohol exposure or alcoholic fatty liver disease (AFLD) by determining its specificity for alcohol versus drug‐ or chemical‐induced liver injury and the persistence of elevated levels of EV CYP2E1 after alcohol withdrawal.
Patients and Methods
HUMAN SUBJECTS
This study was approved by the Human Subjects Institutional Review Board of the Johns Hopkins University Medical Institutions, Baltimore, MD. The clinical characteristics of the healthy controls and patients with alcoholism are the same as described.18 Individual EV proteins were prepared from the serum samples of the study subjects as described.18
STATISTICAL ANALYSIS
Statistical significance was determined using the two‐tailed t test; analysis of variance and Dunnet's multiple comparison posttest were used to compare the means of multiple groups. Data are shown as means ± SD and were considered statistically significant at P < 0.05. GraphPad Prism 7.0 (GraphPad Software Inc., La Jolla, CA) was used for analysis.
All other methods are described in detail in the http://onlinelibrary.wiley.com/doi/10.1002/hep4.1066/suppinfo.
Results
EV CYP2E1 PROTEIN AND OTHER P450 ISOFORMS WERE INCREASED IN THE PLASMA FROM PATIENTS WITH ALCOHOLISM
EVs were isolated from the plasma of patients with alcoholism and control individuals in order to evaluate the increased secretion of P450 proteins, including CYP2E1, in EVs by alcohol exposure.18 Compared to the age‐matched controls (n = 9, 17.2 ± 3.3), serum aspartate aminotransferase levels in patients with alcoholism (n = 14, 69.9 ± 33.4) were significantly increased, indicating alcohol‐induced liver damage. EVs in the plasma of patients with alcoholism and controls indicated an abundance of smaller vesicles with similar sizes (Fig. 1A,B). The numbers and total EV protein amounts were significantly increased in the plasma of patients with alcoholism compared to the controls (Fig. 1C,D). The levels of CYP2E1, CYP2A6, CYP1A/2, and CYP4B proteins were elevated in the plasma EVs from patients with alcoholism relative to those of controls (Fig. 1E); however, the amount of CYP4A protein was unchanged. These results suggest that alcohol (ethanol) and/or its metabolites increased the amounts of EV proteins, including CYP2E1 and other P450 isoforms, that were secreted possibly from damaged hepatocytes.
Figure 1.
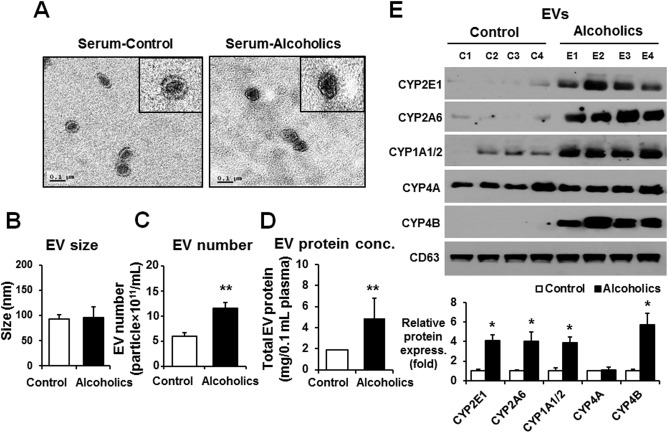
The amounts of total and cytochrome P450 proteins in circulating EVs were increased in human patients with alcoholism. (A) Analysis of the size of circulating EVs isolated from the sera of healthy controls (n = 9) who never drank alcohol due to religious reasons and patients with alcoholism (n = 14) with hepatitis. The inset figures represent transmission electron microscopy images. (B) EV size was determined by a Nanoparticle Tracking analysis (Nanosight).18 (C) Total number of EVs in the sera of healthy controls or patients with alcoholism was measured by Nanosight. (D) Analysis of the total protein amounts in circulating EVs isolated from the sera of healthy controls or patients with alcoholism. (E) Detection of the cytochrome P450 proteins (i.e., CYP2E1, CYP2A6, CYP1A1/2, CYP4A, and CYP4B) in circulating EVs from the different groups by immunoblot analyses, as indicated. CD63 was used as a loading control for the same amounts of total EV proteins in all samples. Densitometric quantitation of the immunoblots for CYP2E1, CYP2A6, CYP1A1/2, CYP4A, and CYP4 relative to CD63 (n = 4/group) is shown. *P < 0.05, **P < 0.01. Data are shown as means ± SD.
AMOUNTS OF EV P450 PROTEINS WERE INCREASED BY BINGE ALCOHOL EXPOSURE IN RATS
To confirm the elevated secretion of EV P450 proteins by alcohol exposure in rodent models, female Fischer F344 wild‐type (WT) rats (n ≥ 6/group) were exposed to three consecutive oral doses of binge alcohol (6 g/kg/dose) or isocaloric dextrose (as control) at 12‐hour intervals. Binge alcohol exposure significantly elevated hepatic fat accumulation with mild necrosis and infiltration of inflammatory cells compared to those of the dextrose‐fed control rats (Fig. 2A; http://onlinelibrary.wiley.com/doi/10.1002/hep4.1066/suppinfo). Consistently, plasma alanine aminotransferase (ALT) and liver triglyceride (TG) levels were significantly increased in alcohol‐treated rats compared to control animals (http://onlinelibrary.wiley.com/doi/10.1002/hep4.1066/suppinfo, respectively). In addition, binge alcohol exposure elevated the hepatic levels of proinflammatory cytokines/chemokines, such as tumor necrosis factor‐alpha (TNF‐α) (http://onlinelibrary.wiley.com/doi/10.1002/hep4.1066/suppinfo) and monocyte chemoattractant protein 1 (http://onlinelibrary.wiley.com/doi/10.1002/hep4.1066/suppinfo).
Figure 2.
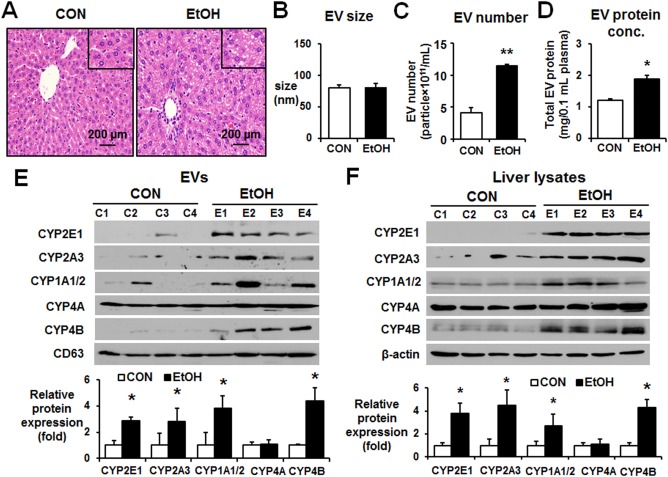
Binge alcohol increased the levels of P450 isoforms in circulating EVs in rats. (A) Representative hematoxylin and eosin staining of formalin‐fixed liver sections for the indicated groups (magnification ×100). The inset figures represent larger (×200) magnification images. (B) Analysis of the size of circulating EVs isolated from the control or binge ethanol‐exposed Fischer rats performed by Nanosight. (C) Total number of EVs in the control or binge ethanol‐exposure rats was measured by Nanosight. (D) Total protein amounts of EV derived from the control or binge ethanol‐exposure rats. (E) Detection of the cytochrome P450 proteins (e.g., CYP2E1, CYP2A3, CYP1A1/2, CYP4A, and CYP4B) in circulating EVs from the different groups by immunoblot analyses, as indicated. CD63 was used as a loading control for the same amounts of total EV proteins in all samples. Densitometric quantitation of the immunoblots for P450 isoforms relative to CD63 (n = 4/group) is shown. *P < 0.05. (F) Detection of the P450 proteins in liver lysates from the different groups by immunoblot analyses, as indicated. β‐Actin, used as a loading control, is shown. Densitometric quantitation of the immunoblots for CYP proteins relative to β‐actin (n = 4/group) is shown. *P < 0.05, **P < 0.01. Abbreviations: CON, control; EtOH, ethanol. Data are shown as means ± SD.
The properties of EVs isolated from binge alcohol‐treated rats and dextrose‐exposed controls were further characterized. The sizes of EVs from alcohol‐exposed rats and controls were similar (Fig. 2B). The number of EVs and their protein concentration were significantly increased in the plasma of alcohol‐exposed rats compared to those of the controls (Fig. 2C,D, respectively). The amounts of CYP2E1, CYP2A3, CYP1A/2, and CYP4B proteins were significantly elevated in the EVs from the plasma of alcohol‐treated rats compared to those of the dextrose controls (Fig. 2E), while similar levels of EV CYP4A and CD63 were detected in both groups, consistent with the results observed with human plasma (Fig. 1E). Furthermore, we observed that the levels of CYP2E1, CYP2A3, CYP1A/2, and CYP4B proteins were also elevated in the liver lysates of binge alcohol‐exposed Fischer rats compared to the corresponding controls (Fig. 2F). Again, the amounts of CYP4A protein were similar in the liver lysates of alcohol‐exposed rats and dextrose‐treated controls. These results suggest that greater amounts of EV proteins were produced in alcohol‐exposed rat hepatocytes and that there were parallel increases in the protein levels of hepatic and EV CYP2E1, CYP2A3, CYP1A/2, and CYP4B. In contrast, the amounts of hepatic and EV CYP4A were unchanged despite alcohol exposure, indicating that alcohol exposure selectively up‐regulated hepatic and EV CYP2E1 and a few other P450 isoforms, but not CYP4A.
ALCOHOL‐INDUCED INCREASES OF EV AND HEPATIC P450 ISOFORMS WERE PREVENTED BY POLYUNSATURATED FATTY ACIDS
Our previous results showed that the addition of physiologically relevant amounts of polyunsaturated fatty acids (PUFAs) prevented AFLD and mitochondrial dysfunction through blocking the oxidatively modified (and inactivated) mitochondrial proteins in rats fed an alcohol liquid diet for 9 weeks.19 Further, PUFAs inhibited the elevated activities and amounts of CYP2E1 and inducible nitric oxide synthase (iNOS) following chronic alcohol exposure, suggesting important roles of CYP2E1 and iNOS in AFLD,19 consistent with the previous reports.20, 21, 22, 23, 24 Therefore, in this study, we specifically evaluated the role of CYP2E1 in preventing the increased amounts of EV proteins, including CYP2E1 and other P450 isoforms, in Long‐Evans rats fed an alcohol or dextrose‐control liquid diet with or without the addition of PUFAs, including docosahexaenoic and arachidonic acids, in a pair‐feeding paradigm.19 Chronic alcohol feeding increased the plasma ALT and hepatic TG contents, while PUFA supplementation to the alcohol liquid diet significantly decreased their levels (http://onlinelibrary.wiley.com/doi/10.1002/hep4.1066/suppinfo), similar to the previous report.19 In this model, alcohol exposure alone also increased the amounts of hepatic TG and TNF‐α (http://onlinelibrary.wiley.com/doi/10.1002/hep4.1066/suppinfo, respectively). Furthermore, the levels of this cytokine were normalized in rats fed the alcohol‐liquid diet supplemented with PUFAs.
To further determine the effects of PUFAs on EV contents of P450 isoforms, EVs were isolated from individual rat plasma in the four different groups of animals: base control (BC), base ethanol (BE), PUFA control (PC), and PUFA ethanol (PE). The sizes of EVs from the BC, BE, PC, and PE groups were similar (Fig. 3A). The number and protein amounts of EVs were increased in the plasma from the BE group compared to those of the BC group (Fig. 3B,C, respectively). However, the elevated EV number and amounts were significantly reduced in the PE group despite ethanol feeding (Fig. 3B,C, respectively). The amounts of CYP2E1, CYP2A3, CYP1A/2, or CYP4B protein were increased in the EVs from the plasmas of the BE group compared to the BC group (Fig. 3D). The increased EV CYP2E1, CYP2A3, CYP1A/2, and CYP4B proteins observed in the BE group returned to control levels in the PE group, similar to those in the BC or PC group. In parallel, the amounts of hepatic CYP2E1, CYP2A3, CYP1A/2, and CYP4B proteins were increased in the BE group, but the elevated protein concentrations were decreased to basal levels in the PE group (Fig. 3E). However, EV and hepatic CYP4A proteins were unchanged and showed similar amounts among all four groups (Fig. 3D,E, respectively). These data demonstrated parallel changes in some specific P450 proteins, including CYP2E1, between the liver extracts and EVs and showed that chronic alcohol administration increased the EV P450 proteins while the PUFA supplementation blocked the elevated secretion of EV P450 proteins from hepatocytes, possibly by preventing CYP2E1 and iNOS‐related oxidative stress.
Figure 3.
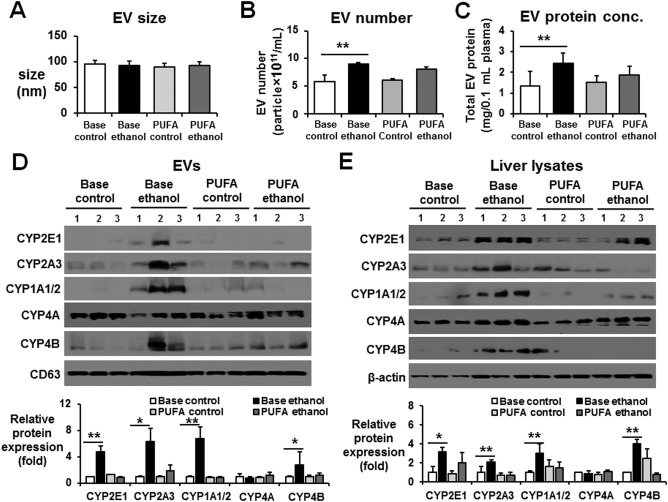
PUFA supplementation prevented the total protein amounts and CYP proteins in circulating EVs. (A) Analysis of the size of circulating EVs isolated from Long‐Evans rat plasma of the BC, BE, PC, or PE group performed by Nanosight.19 (B) Total number of EVs in plasma of the BC, BE, PC, and PE groups was measured by Nanosight. (C) Analysis of the total protein amounts in circulating EVs isolated from rat plasma of the BC, BE, PC, or PE group. (D) Detection of the cytochrome P450 proteins (e.g., CYP2E1, CYP2A3, CYP1A1/2, CYP4A, and CYP4B) in circulating EVs from the different groups by immunoblot analyses, as indicated. Densitometric quantitation of the immunoblots for EV CYP proteins relative to CD63, used as a loading control for the same amounts of total EV proteins, is shown. n = 3/group. (E) Detection of the CYP proteins in liver lysates from the different groups by immunoblot analyses, as indicated. Densitometric quantitation of the immunoblots for CYP proteins relative to β‐actin, used as a loading control, is shown. n = 4/group. *P < 0.05, **P < 0.01. Data are shown as means ± SD.
CYP2E1 WAS IMPORTANT IN THE ALCOHOL‐MEDIATED ELEVATION OF EV AMOUNTS AND EV P450 ISOFORMS
Our results (Figs. 2 and 3) with rats exposed to binge or chronic alcohol in the absence or presence of PUFA suggest an important role for CYP2E1 in the increased amounts of EV and EV P450 isoforms, similar to a recent report that showed alcohol‐mediated EV production and macrophage activation in a CYP2E1‐dependent manner.25 To further elucidate the direct role of CYP2E1 in elevating EV release in response to ethanol, WT and Cyp2e1‐null mice were exposed to binge alcohol, as previously reported,26, 27 and EV proteins were characterized. Histologic and biochemical analyses showed that binge alcohol exposure increased fat accumulation and the levels of serum ALT and hepatic TG in WT mice compared with the dextrose controls (http://onlinelibrary.wiley.com/doi/10.1002/hep4.1066/suppinfo). In contrast, these changes were not observed in the Cyp2e1‐null mice despite exposure to the same amounts of alcohol (http://onlinelibrary.wiley.com/doi/10.1002/hep4.1066/suppinfo).
Sizes of EVs were in the range 50‐150 nm and were similar in both mouse strains regardless of binge alcohol exposure (Fig. 4A). Although the amounts of EV proteins were significantly elevated in alcohol‐exposed WT mice, the number and amounts of EV proteins were not increased in the alcohol‐exposed Cyp2e1‐null mice compared to those of the dextrose‐control counterparts (Fig. 4B,C, respectively). EV CYP2E1 protein contents were elevated in alcohol‐exposed WT mice compared to the dextrose controls but were not increased in plasma EVs from the corresponding Cyp2e1‐null mice (Fig. 4D). The amounts of EV CYP2A5 and CYP4B proteins were also elevated in binge alcohol‐exposed WT mice compared to the dextrose controls, and their elevated levels were not decreased in the alcohol‐exposed Cyp2e1‐null mice (Fig. 4D). In fact, the EV CYP2A5 increases, observed in alcohol‐exposed WT mice, were further elevated in the corresponding Cyp2e1‐null mice (Fig. 4D). These results suggested that CYP2E1 most likely plays a role in the alcohol‐mediated elevation of EV P450 isoforms, including CYP2E1, in an individual P450‐specific manner. Consistently, the levels of hepatic CYP2E1, observed only in the WT mice, were significantly increased by binge alcohol exposure (Fig. 4E). Similarly, the hepatic levels of CYP1A1/2 were also elevated in alcohol‐exposed WT mice, but its elevation was not observed in the corresponding Cyp2e1‐null mice, suggesting a potential CYP2E1‐dependent up‐regulation of CYP1A/2. In contrast, the hepatic levels of CYP2A5 and CYP4B were elevated in a CYP2E1‐independent manner because their elevated levels were still observed in both WT and Cyp2e1‐null mice following binge alcohol exposure. However, the levels of hepatic CYP4A were unchanged regardless of the expression of CYP2E1 in different mouse strains and alcohol exposure (Fig. 4E).
Figure 4.
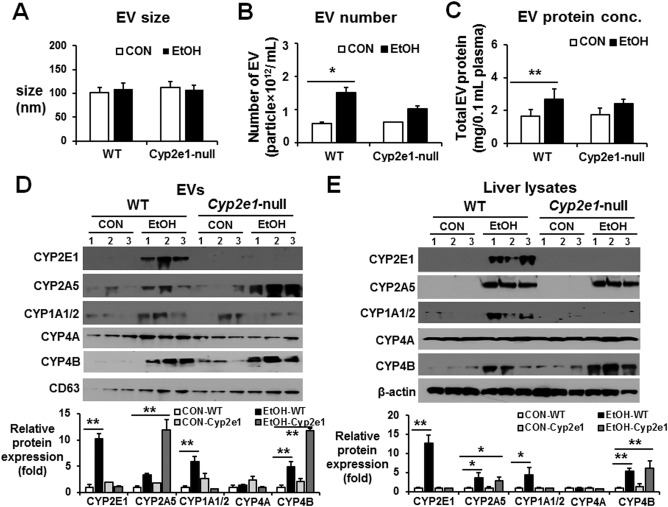
CYP2E1 deletion prevented alcohol‐medicated increments of hepatic P450 proteins and the amounts of total EV proteins and P450 isoforms in mice. WT or Cyp2e1‐null mice were exposed to dextrose (CON) or 6 g ethanol/kg/dose via oral gavage 3 times at 12‐hour intervals and were sacrificed 1 hour after the third dose (n = 7/group). (A) Analysis of the size of circulating EVs isolated from each group. (B) Total number of EVs in each group was measured by Nanosight. (C) Analysis of the protein amounts in circulating EVs isolated from each group, as indicated. (D) Detection of the P450 proteins (e.g., CYP2E1, CYP2A5, CYP1A1/2, CYP4A, and CYP4B) in circulating EVs from the different groups by immunoblot analyses, as indicated. Densitometric quantitation of the immunoblots for EV CYP proteins relative to CD63, used as a loading control, is shown. (E) Detection of the hepatic P450 isoforms from the different groups by immunoblot analyses, as indicated. Densitometric quantitation of the immunoblots for hepatic CYP proteins relative to β‐actin, used as a loading control, is shown. *P < 0.05, **P < 0.01. Abbreviations: CON, control; EtOH, ethanol. Data are shown as means ± SD.
To further demonstrate the importance of CYP2E1 in EV protein secretion, female Fischer WT rats (n ≥ 6/group) were exposed to three consecutive oral doses of binge alcohol (6 g/kg/dose) at 12‐hour intervals with or without the CYP2E1 inhibitor chlormethiazole (CMZ).26 CMZ treatment did not change the EV size (Fig. 5A) but prevented elevation of EV number and protein content following binge alcohol exposure (Fig. 5B,C, respectively) and suppressed binge alcohol‐induced fatty liver and increased plasma ALT (http://onlinelibrary.wiley.com/doi/10.1002/hep4.1066/suppinfo). Furthermore, CMZ treatment effectively blocked ethanol‐mediated CYP2E1 induction in EVs or liver lysates (Fig. 5D,E, respectively). Additionally, EV and hepatic CYP2A3 and CYP1A1/2 levels, elevated in the alcohol‐exposed group, were suppressed by CMZ treatment. However, CMZ treatment did not appear to affect the CYP4A and CYP4B contents in EVs and liver lysates.
Figure 5.
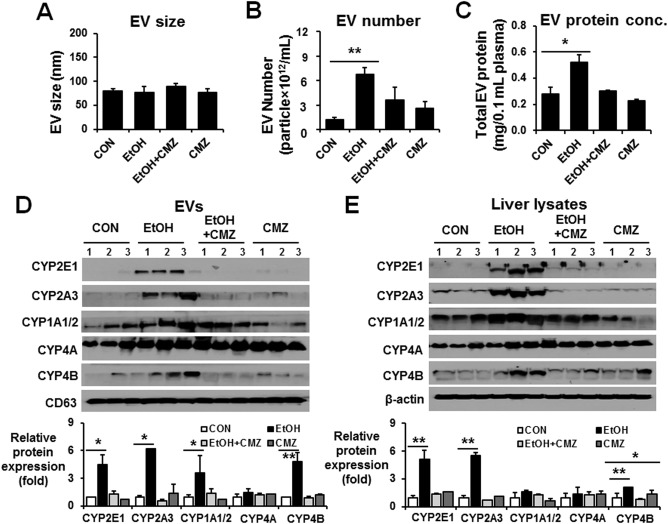
CYP2E1 inhibition prevented alcohol‐medicated increments of hepatic P450 proteins and the amounts of total EV proteins and P450 isoforms in rats. Young WT Fischer rats were exposed to dextrose (CON) or 6 g ethanol/kg/dose via oral gavage 3 times at 12‐hour intervals in the absence or presence of CMZ treatment and were sacrificed 1 hour after the last ethanol dose (n = 6‐7/group), as reported.26 (A) Analysis of the size of circulating EVs isolated from each group. (B) Total number of EVs in each group was measured by Nanosight. (C) Analysis of the protein amounts in circulating EVs isolated from each group, as indicated. (D) Detection of the cytochrome P450 proteins (e.g., CYP2E1, CYP2A3, CYP1A1/2, CYP4A, and CYP4B) in circulating EVs from the different groups by immunoblot analyses, as indicated. Densitometric quantitation of the immunoblots for EV CYP proteins relative to CD63, used as a loading control, is shown. (E) Detection of the hepatic P450 isoforms from the different groups by immunoblot analyses, as indicated. Densitometric quantitation of the immunoblots for hepatic CYP proteins relative to β‐actin, used as a loading control, is shown. *P < 0.05, **P < 0.01. Abbreviations: CON, control; EtOH, ethanol. Data are shown as means ± SD.
INCREASED EV CYP2E1 CAN BE A POTENTIAL BIOMARKER FOR ALCOHOL EXPOSURE OR ALCOHOL‐INDUCED LIVER INJURY
To determine the number of EVs and the stability of EV CYP2E1 after ethanol exposure, we isolated EVs at 1, 3, 5, and 7 days after the last dose of ethanol given to WT rats. Elevated EV number and EV CYP2E1 content were still detected 5 and 7 days after alcohol exposure (http://onlinelibrary.wiley.com/doi/10.1002/hep4.1066/suppinfo, respectively), although liver histology and plasma ALT returned to normal 3 days after the alcohol exposure (http://onlinelibrary.wiley.com/doi/10.1002/hep4.1066/suppinfo, respectively).
To determine the specificity of EV CYP2E1 as a potential biomarker of alcohol exposure or AFLD, we compared the amounts of EV and hepatic CYP2E1 in two different models of chemical‐ or drug‐induced acute liver injury caused by CCl4 or acetaminophen (APAP). Typical necrosis in the pericentral regions (http://onlinelibrary.wiley.com/doi/10.1002/hep4.1066/suppinfo) and elevated plasma ALT (http://onlinelibrary.wiley.com/doi/10.1002/hep4.1066/suppinfo) were observed in both CCl4‐ and APAP‐treated mice. Similarly, significantly increased numbers of circulating EV were observed in the plasma of CCl4‐ and APAP‐exposed mice (http://onlinelibrary.wiley.com/doi/10.1002/hep4.1066/suppinfo). However, virtually no or little EV CYP2E1 was detected in CCl4‐ or APAP‐treated mice despite the presence of hepatic CYP2E1 in APAP‐exposed mice (http://onlinelibrary.wiley.com/doi/10.1002/hep4.1066/suppinfo). Administration of the CYP2E1 inducer pyrazole at 150 mg/kg/day for 3 consecutive days (http://onlinelibrary.wiley.com/doi/10.1002/hep4.1066/suppinfo) or 1 day (data not shown) increased the EV number as well as the amounts of EV and hepatic CYP2E1 compared to those of vehicle controls. Therefore, CYP2E1 in EVs cannot be a specific biomarker for detecting alcohol exposure and/or AFLD but can be a general biomarker for liver injury, although more rigorous characterizations are warranted for this purpose.
MECHANISMS OF ELEVATED EV CYP2E1 FOLLOWING ALCOHOL EXPOSURE: DEPENDENCE OF OXIDATIVE AND ER STRESS
To investigate the underlying mechanisms of elevated EV CYP2E1 in ethanol‐exposed rodents and patients with alcoholism, primary mouse hepatocytes and E47 hepatoma cells that overexpressed CYP2E13 were exposed to 100 mM ethanol for different times up to 48 hours. Ethanol exposure significantly increased EV numbers in both primary hepatocytes and E47 cells at 24 hours (http://onlinelibrary.wiley.com/doi/10.1002/hep4.1066/suppinfo, respectively). In addition, the amounts of EV proteins were increased after 6 hours incubation with 100 mM ethanol in a time‐dependent manner (http://onlinelibrary.wiley.com/doi/10.1002/hep4.1066/suppinfo). Furthermore, ethanol exposure increased EV numbers only in VL‐17 hepatoma cells that overexpress both CYP2E1 and ADH1, but not in VA‐13 cells that overexpress ADH1 alone (http://onlinelibrary.wiley.com/doi/10.1002/hep4.1066/suppinfo, respectively).28 These results indicate a dependence on CYP2E1 expression and a potential role of ROS and oxidative stress in the increased secretion of EVs produced through CYP2E1‐mediated alcohol metabolism.
Based on these results, we first tested whether EV secretion by primary hepatocytes is directly related to increased ROS production following ethanol exposure. Analysis of ROS production by confocal microscopy showed increased ROS production following ethanol exposure for 24 hours (Fig. 6A,B). Similarly, EV number and CYP2E1 secretion were significantly elevated by ethanol exposure in a time‐dependent manner (Fig. 6C,D, respectively). We next explored whether ethanol exposure can cause ER stress by monitoring the elevation of the ER stress‐induced proteins protein disulfide isomerase (PDI) and 78‐kDa glucose‐regulated protein (Grp78).29 Ethanol exposure elevated the levels of these proteins, albeit only slightly, in primary hepatocytes exposed to ethanol in a time‐dependent manner (Fig. 6D). Elevated ER stress at 12 hours in alcohol‐exposed hepatocytes was also observed by increased green fluorescence under confocal microscopy (Fig. 6E). Furthermore, ethanol treatment increased EV CYP2E1 and ER stress marker proteins PDI and Grp78 in primary hepatocytes (Fig. 7A) and EV numbers (Fig. 7B), similar to those pretreated with the ER stress inducer thapsigargin (Fig. 7A). Cotreatment with the antioxidant N‐acetylcysteine, a CYP2E1 inhibitor (CMZ), or the ER stress inhibitor 4‐phenylbutryric acid efficiently blocked the elevation of CYP2E1 and PDI in cultured primary hepatocytes and EV release from primary hepatocytes in response to ethanol (Fig. 7A,B, respectively).
Figure 6.
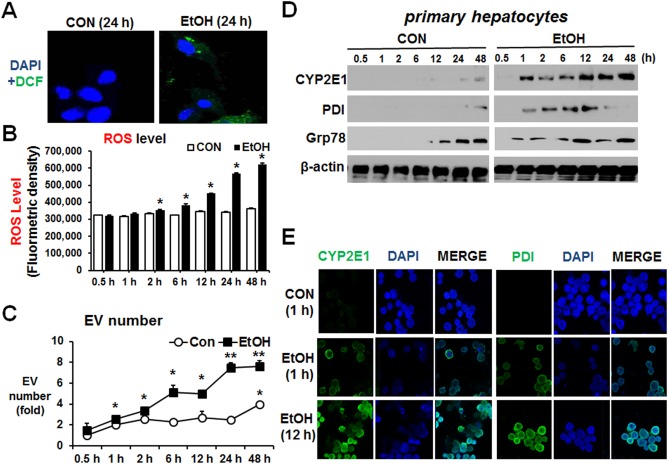
Alcohol elevated EV number through increased oxidative and ER stress in primary hepatocytes. Confluent mouse primary hepatocytes were treated with 100 mM ethanol for 0.5, 1, 2, 6, 12, 24, and 48 hours. (A) Confocal images of increased ROS determined by green dichlorofluorescein‐diacetate fluorescence. (B) ROS levels are shown after fluorometric measurement of dichlorofluorescein‐formaldehyde in the hepatocyte lysates collected at the indicated times after exposure to 100 mM ethanol. (C) Total number of EVs in each group was measured by Nanosight. *P < 0.05, **P < 0.01. (D) Immunoblot analyses for CYP2E1, PDI, and Grp78 in the indicated hepatocyte lysates. β‐Actin, used as a loading control, is shown. (E) Confocal images of CYP2E1 and PDI were increased at 12 hours after alcohol exposure. Abbreviations: CON, control; DAPI, 4′,6‐diamidino‐2‐phenylindole; EtOH, ethanol. Data are shown as means ± SD.
Figure 7.
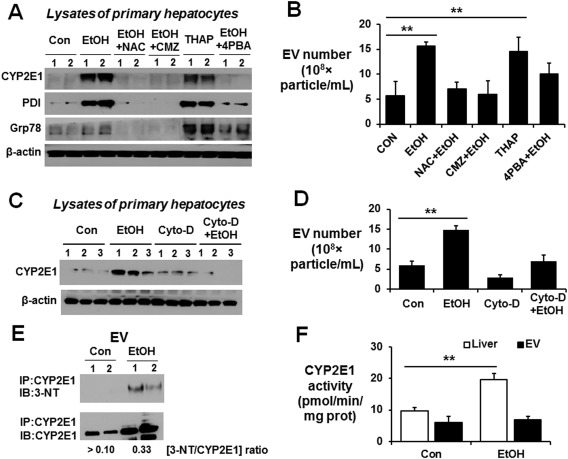
Secretion of elevated EV CYP2E1 by alcohol exposure is dependent on oxidative and ER stress. (A) Immunoblot analyses of CYP2E1, PDI, and Grp78 in hepatocyte lysates after primary hepatocytes were treated with 100 mM EtOH in the absence or presence of 1 mM NAC, 40 μM CMZ, 5 μM 4‐PBA, or 1 μM THAP. (B) Total number of EVs in each indicated group was measured by Nanosight. (C) Immunoblot analyses of CYP2E1, PDI, and Grp78 in hepatocyte lysates after primary hepatocytes were treated with 100 mM EtOH with or without 20 μM Cyto‐D. β‐Actin, used as a loading control, is shown. (D) Total number of EVs in the each indicated group was measured by Nanosight. (E) EV proteins from the indicated groups were immunoprecipitated with anti‐CYP2E1 antibody. The immunoprecipitated proteins were then subjected to immunoblot analysis with anti‐3‐NT or anti‐CYP2E1 antibody. The average ratio of 3‐NT/CYP2E1 for each group is shown at the bottom. (F) CYP2E1 activity was measured by hydroxylation of p‐nitrophenol and expressed as pmol/min/mg of protein. **P < 0.01. Abbreviations: 3‐NT, 3‐nitrotyrosine; Con, control; EtOH, ethanol; NAC, N‐acetylcysteine; 4‐PBA, 4‐phenylbutyric acid; THAP, thapsigargin. Data are shown as means ± SD.
To further confirm CYP2E1‐dependent EV secretion after ethanol exposure, we used cytochalacin‐D (Cyto‐D) as an EV secretion inhibitor. Treatment with Cyto‐D significantly reduced the ethanol‐mediated CYP2E1 protein expression and EV release from primary hepatocytes (Fig. 7C,D, respectively). Similar results were observed with other EV secretion inhibitors, such as GW4869 and dimethyl amiloride (data not shown). In addition, our immunoprecipitation of EV proteins followed by immunoblot analysis revealed that EV CYP2E1, released after ethanol exposure, was nitrated (Fig. 7E) and exhibited no additional enzyme activity (Fig. 7F) compared to that of the basal EV CYP2E1 or elevated hepatic CYP2E1 activity, although we do not know the exact mechanism by which the nitrated CYP2E1 was secreted and incorporated into EVs. To the best of our knowledge, this is the first report to show that nitrated CYP2E1 is incorporated into EVs. Thus, ethanol metabolism stimulates EV release by a CYP2E1‐dependent mechanism most likely through increased nitroxidative and ER stress.
INCREASED EV PROTEINS FOLLOWING ALCOHOL EXPOSURE CAN ACTIVATE CELL DEATH SIGNALS IN PRIMARY HEPATOCYTES
To investigate interaction and internalization of EVs into primary hepatocytes, EVs from alcohol‐exposed rodents were labeled with DiD lipophilic carbocyanine red fluorescent dye.30 Confocal microscopy showed that DiD‐labeled EVs from alcohol‐exposed rodents but not from control EVs are internalized into primary hepatocytes (Fig. 8A) and E47 hepatoma cells (http://onlinelibrary.wiley.com/doi/10.1002/hep4.1066/suppinfo). Moreover, the exogenous EVs from alcohol‐exposed rodents and human patients with alcoholism decrease cell viability of primary hepatocytes (Fig. 8B) or E47 cells (http://onlinelibrary.wiley.com/doi/10.1002/hep4.1066/suppinfo). Furthermore, analysis of the mechanisms of this decreased viability demonstrated that the EVs from alcohol‐exposed rodents can activate or up‐regulate mediators of apoptosis, such as activated phospho‐c‐Jun N‐terminal protein kinase, proapoptotic Bax, and cleaved (activated) caspase‐3 in hepatocytes (Fig. 8C). Increased levels of cleaved caspase‐3 were also observed by confocal microscopy (Fig. 8D). These results showed that elevated CYP2E1‐mediated oxidative and/or ER stress in alcohol‐exposed cells and rodents can promote release of EV proteins and many other components that can be toxic to the recipient hepatocytes (Fig. 8E). Therefore, EVs from alcohol‐exposed organisms are involved in cellular communication, eventually resulting in hepatocyte cell death.
Figure 8.
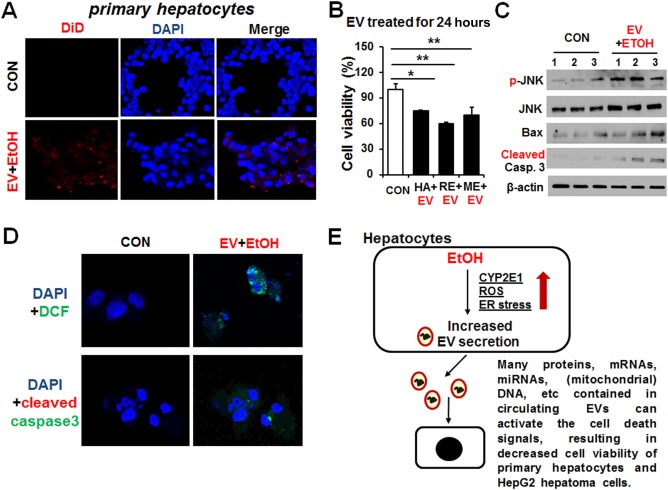
Exogenously‐added EVs from alcohol‐exposed rodents and patients with alcoholism promoted apoptotic cell death in primary hepatocytes. (A) EVs from alcohol‐exposed rats were fluorescently labeled with the cell membrane marker DiD prior to its incubation with primary hepatocytes for 24 hours. Primary hepatocytes were counterstained with DAPI to stain the cell nuclei. Control hepatocytes were treated with PBS (vehicle control). (B) Cell viability in primary hepatocytes treated with exogenous EVs from alcohol‐exposed human patients with alcoholism (HA+EV), ethanol‐exposed rats (RE+EV), or ethanol‐exposed mice (ME+EV) compared with untreated cells. *P < 0.05, **P < 0.01. (C) Immunoblot results showing relative expression of phospho‐(p)‐JNK, JNK, Bax, or cleaved (activated) caspase‐3 in primary hepatocytes treated with EVs from alcohol‐exposed rats for 24 hours. β‐Actin, used as a loading control, is shown. (D) Confocal image showing ROS production by DCFH‐DA or cleaved caspase‐3 in primary hepatocytes treated with EVs from alcohol‐exposed rats for 24 hours. Primary hepatocytes were counterstained with DAPI to stain the cell nuclei. (E) Schematic diagram for the role of exogenous EVs containing CYP2E1 and many other components in promoting hepatocyte cell death most likely through elevated oxidative and ER stress. Abbreviations: CON, control; DAPI, 4′,6‐diamidino‐2‐phenylindole; DCFH‐DA, dichlorofluorescein‐diacetate; EtOH, ethanol; JNK, c‐Jun N‐terminal protein kinase; mRNA, messenger RNA; PBS, phosphate‐buffered saline. Data are shown as means ± SD.
Discussion
ALD represents a spectrum of clinical illness and morphological changes that range from fatty liver to hepatic inflammation and necrosis (alcoholic hepatitis) to progressive fibrosis (alcoholic cirrhosis). In animal models of ALD, CYP2E1 and iNOS have been shown to have important roles in the pathogenesis of ALD as mice lacking these genes are protected from ALD24, 28 while transgenic mice that overexpress CYP2E1 are more prone to ALD.20, 23 The role of CYP2E1 in the pathogenesis of ALD is primarily through its propensity to produce ROS and resulting reactive free radical metabolites, including lipid peroxides and reactive aldehydes.27, 28 In this study, we showed for the first time that the levels of EV CYP2E1 and other CYP isoform (e.g., CYP2A3, CYP1A1/2, and CYP4B) proteins were elevated in alcohol‐exposed rats, mice, and human patients with alcoholism compared to those of their respective controls. In addition, we demonstrated the important role of CYP2E1 in alcohol‐mediated elevation of EV production, possibly through increased oxidative stress. This conclusion was supported by the results observed in WT rats treated with PUFAs, which inhibit CYP2E1, and Cyp2e1‐null mice regardless of ethanol exposure.
We observed an increased number and/or amounts of circulating EVs in the plasma of patients with alcoholic hepatitis compared to healthy controls. We also found a significantly elevated number or amount of circulating EVs in the plasma of rats chronically fed an alcohol liquid diet compared to the pair‐fed controls. Interestingly, the sizes of the EVs in both animal models and human subjects were not changed. Similarly, we found a significantly increased number of circulating EVs in mouse plasma in which acute liver disease was induced by treatment with APAP or CCl4. Furthermore, a recent report revealed that the number of circulating EVs was increased in alcoholic hepatitis patients.31 These results indicate the EV proteins or miRNAs can be used as a relatively noninvasive marker for AFLD. Our results also revealed that the levels of plasma EV CYP2E1, CYP2A6, CYP1A1/2, and CYP4B, but not CYP4A, were significantly elevated in patients with alcoholic hepatitis compared to healthy controls. Similar results were also observed in binge alcohol‐exposed mice in a CYP2E1‐dependent manner because the elevated P450 isoforms in the circulating EVs and livers were markedly decreased or not observed in the alcohol‐exposed Cyp2e1‐null mice or Fischer rats and primary hepatocytes pretreated with the CYP2E1 inhibitor CMZ. Similar suppression of EV CYP2E1 incorporation and other P450 isoforms in Long‐Evans rats was observed in PUFA‐ethanol rats, most likely due to suppression of CYP2E1 and nitroxidative stress by PUFA, as reported.19 These results are in agreement with the recent report25 confirming the important role of CYP2E1 in alcohol‐induced hepatocyte injury and secretion of EV proteins.
Our results from three different rodent models and human individuals with alcoholism clearly demonstrate the presence of P450 proteins in circulating EVs that could have originated from damaged hepatocytes. In this regard, it is surprising that comprehensive proteomic analyses of hepatocyte‐derived EVs did not show the presence of CYP2E1, CYP2A3, CYP1A1/2, and CYP4B.14, 18 Although the source of EV CYP2E1 was not carefully determined in the current study, it is likely that EV P450 proteins were produced from the liver because the greatest amounts of most P450 proteins are known to be expressed in hepatocytes than in other extrahepatic tissues or cells and because liver‐specific proteins, such as albumin, haptoglobulin, and fibrinogen, were identified in the circulating EVs from alcohol‐exposed mice and human patients with alcoholism.18 The fact, that hepatocytes are able to secrete EVs containing many enzymes involved in the metabolism of lipids, endogenous compounds, and xenobiotics14 could also imply that hepatocyte‐derived EVs may play a role in extrahepatic metabolism and body homeostasis, as suggested.32, 33
Niemela et al.34 reported that multiple CYPs, CYP2E1, CYP2A, and CYP3A were increased in liver specimens from human patients with alcoholism. The CYP2A isoform can metabolize nicotine, the major component of tobacco, leading to the production of toxic metabolites that can contribute to liver damage and lung cancer.35, 36 Alcohol exposure can up‐regulate CYP2A isoform expression through activation of the oxidative stress‐mediated protein kinase C/MEK/Nrf2 (mitogen‐activated protein kinase/nuclear erythroid related factor‐2) pathway in monocytic cells.37 Our results showed that hepatic and EV CYP2A isoforms were elevated by alcohol exposure in a CYP2E1‐independent manner. Our results also revealed that liver and EV CYP1A1/2 were elevated by ethanol exposure. These results are in agreement with an earlier report showing hepatic and skeletal muscle CYP1A1/2 were induced in ethanol‐fed rats.38 In addition, our data suggested that elevation of EV CYP1A1/2 may be released from ethanol‐induced damaged hepatocytes. CYP4B is highly expressed in lung, peripheral tissues, and liver where it has been reported to function in the activation of procarcinogens.39 CYP4B metabolizes short chain fatty acid substrates to dicarboxylic acids, which are directed to the mitochondria for complete β‐oxidation.40 Complete oxidation of short chain fatty acids would increase oxidative phosphorylation and provide necessary energy for repair and proliferation.40 CYP4A, involved in fatty acid metabolism, is the major enzyme that contributes to insulin resistance and hepatic steatosis in the diabetic mouse liver.41 However, the amounts of EV CYP4A were unchanged in the alcohol‐treated rodents and human patients with alcoholism in our studies. Our results may thus demonstrate that the relative degree of hepatocyte injury is closely related to the production of EVs with high levels of a few selective CYP enzymes.
To further determine the underlying mechanisms of EV release in alcohol‐exposed rodents and patients with alcoholism, we used in vitro hepatocyte cell culture models. Our results revealed that the levels of CYP2E1 and ROS in primary hepatocytes and E47 cells exposed to ethanol were increased and could account for the elevation of EV numbers and EV protein contents. Increased CYP2E1 and oxidative stress are likely to promote ER stress, as evidenced by the elevated expression of PDI and GRP78, potentially leading to protein nitration and accumulation of unfolded proteins, leading to secretion of these modified or unfolded CYP2E1 (and other proteins) into circulating EVs. Indeed, the ER stress activator thapsigargin increased EV secretion and CYP2E1 expression in hepatocytes. In contrast, the ethanol‐mediated increases in EV secretion and CYP2E1 expression were markedly blunted by treatment with the CYP2E1 inhibitor CMZ, the potent antioxidant N‐acetylcysteine, the ER stress inhibitor 4‐phenylbutryric acid, or EV secretion inhibitors Cyto‐D, GW4869, and dimethyl amiloride. These results verified that nitrated CYP2E1 and other proteins in EVs might be secreted through a CYP2E1‐dependent oxidative and ER stress manner following ethanol exposure. The released EVs then interact with target or adjacent cells and trigger a myriad of responses.32, 33 In the current study, we observed that alcohol‐modulated EVs containing many components, such as various messenger RNAs, miRNAs, (mitochondrial) DNA,42 and proteins, including CYP2E1, can promote cell death in primary hepatocytes and E47 hepatoma cells by activating the cell death signaling pathways. However, we do not know whether exogenously added EV CYP2E1 and other P450 isoforms would increase the total levels of CYP2E1 and others in the whole lysates of the recipient cells. Furthermore, EV CYP2E1 was detected at 5 and 7 days after the last dose of ethanol, suggesting its stability. Elevated EV CYP2E1 was also detected in mice exposed to the CYP2E1 inducer pyrazole for 3 consecutive days (http://onlinelibrary.wiley.com/doi/10.1002/hep4.1066/suppinfo) and 1 day (data not shown). Therefore, the present study also indicates that ER stress‐dependent EV CYP2E1 could be a potential biomarker for ALD and/or other liver injury, although its validation should be further evaluated more rigorously with additional models.
In summary, our results demonstrate that the number and protein amounts of circulating EVs were increased in both rodents and human plasma associated with AFLD. The hepatic levels of CYP2E1, CYP2A6, CYP1A/2, and CYP4B were increased in alcohol‐exposed rodents and humans. Consistently, the levels of CYP2E1 and other P450 isoforms were elevated in circulating EVs from the plasma of rodents and humans with alcohol exposure. These results suggest that some hepatic proteins, which are up‐regulated by alcohol exposure, are likely incorporated into EVs in a CYP2E1‐dependent manner through increased oxidative and ER stress, although the detailed mechanisms by which CYP2E1 promotes EV secretion needs to be further studied. Circulating EVs prepared from alcohol‐exposed rats were internalized and caused death of primary hepatocytes or hepatoma cells. Detection of CYP2E1 and other P450 isoforms in circulating EVs can be used as potential novel biomarkers for liver injury.
Author names in bold designate shared co‐first authorship.
Supporting information
Additional Supporting Information may be found at http://onlinelibrary.wiley.com/doi/10.1002/hep4.1066/suppinfo.
Supporting Information
Acknowledgment
We thank Dr. Klaus Gawrisch, Dr. Mohamed A. Abdelmegeed, and Mr. Kirk Hines for supporting this study, critical reading of this manuscript, and technical help, respectively. We are also grateful to Dr. Wonhyo Seo and Dr. Do‐Kyun Kim for primary hepatocyte isolation and ROS measurements, respectively.
Potential conflict of interest: Nothing to report.
Supported by the Intramural Program of the National Institute on Alcohol Abuse and Alcoholism. This work was also supported by a grant (to Y.E.C.) from the Korean Biomedical Scientist Fellowship Program, Korea Research Institute of Bioscience and Biotechnology, Republic of Korea.
REFERENCES
- 1. Singal AK, Kamath PS, Gores GJ, Shah VH. Alcoholic hepatitis: current challenges and future directions. Clin Gastroenterol Hepatol 2014;12:555‐564. [DOI] [PMC free article] [PubMed] [Google Scholar]
- 2. Beier JI, McClain CJ. Mechanisms and cell signaling in alcoholic liver disease. Biol Chem 2010;391:1249‐1264. [DOI] [PMC free article] [PubMed] [Google Scholar]
- 3. Wu D, Cederbaum AI. Ethanol cytotoxicity to a transfected HepG2 cell line expressing human cytochrome P4502E1. J Biol Chem 1996;271:23914‐23919. [DOI] [PubMed] [Google Scholar]
- 4. Guengerich FP, Kim DH, Iwasaki M. Role of human cytochrome P‐450 IIE1 in the oxidation of many low molecular weight cancer suspects. Chem Res Toxicol 1991;4:168‐179. [DOI] [PubMed] [Google Scholar]
- 5. Rendic S, Di Carlo FJ. Human cytochrome P450 enzymes: a status report summarizing their reactions, substrates, inducers, and inhibitors. Drug Metab Rev 1997;29:413‐580. [DOI] [PubMed] [Google Scholar]
- 6. Bansal S, Liu CP, Sepuri NB, Anandatheerthavarada HK, Selvaraj V, Hoek J, et al. Mitochondria‐targeted cytochrome P450 2E1 induces oxidative damage and augments alcohol‐mediated oxidative stress. J Biol Chem 2010;285:24609‐24619. [DOI] [PMC free article] [PubMed] [Google Scholar]
- 7. Robin MA, Anandatheerthavarada HK, Biswas G, Sepuri NB, Gordon DM, Pain D, et al. Bimodal targeting of microsomal CYP2E1 to mitochondria through activation of an N‐terminal chimeric signal by cAMP‐mediated phosphorylation. J Biol Chem 2002;277:40583‐40593. [DOI] [PMC free article] [PubMed] [Google Scholar]
- 8. Caro AA, Cederbaum AI. Oxidative stress, toxicology, and pharmacology of CYP2E1. Annu Rev Pharmacol Toxicol 2004;44:27‐42. [DOI] [PubMed] [Google Scholar]
- 9. Song BJ, Akbar M, Jo I, Hardwick JP, Abdelmegeed MA. Translational implications of the alcohol‐metabolizing enzymes, including cytochrome P450‐2E1, in alcoholic and nonalcoholic liver disease. Adv Pharmacol 2015;74:303‐372. [DOI] [PubMed] [Google Scholar]
- 10. Hirsova P, Ibrahim SH, Verma VK, Morton LA, Shah VH, LaRusso NF, et al. Extracellular vesicles in liver pathobiology: small particles with big impact. Hepatology 2016;64:2219‐2233. [DOI] [PMC free article] [PubMed] [Google Scholar]
- 11. Moon PG, Lee JE, Cho YE, Lee SJ, Jung JH, Chae YS, et al. Identification of developmental endothelial locus‐1 on circulating extracellular vesicles as a novel biomarker for early breast cancer detection. Clin Cancer Res 2016;22:1757‐1766. [DOI] [PubMed] [Google Scholar]
- 12. Moon PG, Lee JE, You S, Kim TK, Cho JH, Kim IS, et al. Proteomic analysis of urinary exosomes from patients of early IgA nephropathy and thin basement membrane nephropathy. Proteomics 2011;11:2459‐2475. [DOI] [PubMed] [Google Scholar]
- 13. Lee JE, Moon PG, Cho YE, Kim YB, Kim IS, Park H, et al. Identification of EDIL3 on extracellular vesicles involved in breast cancer cell invasion. J Proteomics 2016;131:17‐28. [DOI] [PubMed] [Google Scholar]
- 14. Conde‐Vancells J, Rodriguez‐Suarez E, Embade N, Gil D, Matthiesen R, Valle M, et al. Characterization and comprehensive proteome profiling of exosomes secreted by hepatocytes. J Proteome Res 2008;7:5157‐5166. [DOI] [PMC free article] [PubMed] [Google Scholar]
- 15. Montecalvo A, Larregina AT, Shufesky WJ, Stolz DB, Sullivan ML, Karlsson JM, et al. Mechanism of transfer of functional microRNAs between mouse dendritic cells via exosomes. Blood 2012;119:756‐766. [DOI] [PMC free article] [PubMed] [Google Scholar]
- 16. Valadi H, Ekstrom K, Bossios A, Sjostrand M, Lee JJ, Lotvall JO. Exosome‐mediated transfer of mRNAs and microRNAs is a novel mechanism of genetic exchange between cells. Nat Cell Biol 2007;9:654‐659. [DOI] [PubMed] [Google Scholar]
- 17. Chaput N, Flament C, Viaud S, Taieb J, Roux S, Spatz A, et al. Dendritic cell derived‐exosomes: biology and clinical implementations. J Leukoc Biol 2006;80:471‐478. [DOI] [PubMed] [Google Scholar]
- 18. Cho YE, Im EJ, Moon PG, Mezey E, Song BJ, Baek MC. Increased liver‐specific proteins in circulating extracellular vesicles as potential biomarkers for drug‐ and alcohol‐induced liver injury. PLoS One 2017;12:e0172463. [DOI] [PMC free article] [PubMed] [Google Scholar]
- 19. Song BJ, Moon KH, Olsson NU, Salem N Jr. Prevention of alcoholic fatty liver and mitochondrial dysfunction in the rat by long‐chain polyunsaturated fatty acids. J Hepatol 2008;49:262‐273. [DOI] [PMC free article] [PubMed] [Google Scholar]
- 20. Butura A, Nilsson K, Morgan K, Morgan TR, French SW, Johansson I, et al. The impact of CYP2E1 on the development of alcoholic liver disease as studied in a transgenic mouse model. J Hepatol 2009;50:572‐583. [DOI] [PubMed] [Google Scholar]
- 21. Cederbaum AI. Methodology to assay CYP2E1 mixed function oxidase catalytic activity and its induction. Redox Biol 2014;2:1048‐1054. [DOI] [PMC free article] [PubMed] [Google Scholar]
- 22. McKim SE, Gabele E, Isayama F, Lambert JC, Tucker LM, Wheeler MD, et al. Inducible nitric oxide synthase is required in alcohol‐induced liver injury: studies with knockout mice. Gastroenterology 2003;125:1834‐1844. [DOI] [PubMed] [Google Scholar]
- 23. Morgan K, French SW, Morgan TR. Production of a cytochrome P450 2E1 transgenic mouse and initial evaluation of alcoholic liver damage. Hepatology 2002;36:122‐134. [DOI] [PubMed] [Google Scholar]
- 24. Venkatraman A, Shiva S, Wigley A, Ulasova E, Chhieng D, Bailey SM, et al. The role of iNOS in alcohol‐dependent hepatotoxicity and mitochondrial dysfunction in mice. Hepatology 2004;40:565‐573. [DOI] [PubMed] [Google Scholar]
- 25. Verma VK, Li H, Wang R, Hirsova P, Mushref M, Liu Y, et al. Alcohol stimulates macrophage activation through caspase‐dependent hepatocyte derived release of CD40L containing extracellular vesicles. J Hepatol 2016;64:651‐660. [DOI] [PMC free article] [PubMed] [Google Scholar]
- 26. Abdelmegeed MA, Banerjee A, Jang S, Yoo SH, Yun JW, Gonzalez FJ, et al. CYP2E1 potentiates binge alcohol‐induced gut leakiness, steatohepatitis, and apoptosis. Free Radic Biol Med 2013;65:1238‐1245. [DOI] [PMC free article] [PubMed] [Google Scholar]
- 27. Yun JW, Son MJ, Abdelmegeed MA, Banerjee A, Morgan TR, Yoo SH, et al. Binge alcohol promotes hypoxic liver injury through a CYP2E1‐HIF‐1alpha‐dependent apoptosis pathway in mice and humans. Free Radic Biol Med 2014;77:183‐194. [DOI] [PMC free article] [PubMed] [Google Scholar]
- 28. Clemens DL, Forman A, Jerrells TR, Sorrell MF, Tuma DJ. Relationship between acetaldehyde levels and cell survival in ethanol‐metabolizing hepatoma cells. Hepatology 2002;35:1196‐1204. [DOI] [PubMed] [Google Scholar]
- 29. Pfaffenbach KT, Lee AS. The critical role of GRP78 in physiologic and pathologic stress. Curr Opin Cell Biol 2011;23:150‐156. [DOI] [PMC free article] [PubMed] [Google Scholar]
- 30. Danzer KM, Kranich LR, Ruf WP, Cagsal‐Getkin O, Winslow AR, Zhu L, et al. Exosomal cell‐to‐cell transmission of alpha synuclein oligomers. Mol Neurodegener 2012;7:42. [DOI] [PMC free article] [PubMed] [Google Scholar]
- 31. Momen‐Heravi F, Saha B, Kodys K, Catalano D, Satishchandran A, Szabo G. Increased number of circulating exosomes and their microRNA cargos are potential novel biomarkers in alcoholic hepatitis. J Transl Med 2015;13:261. [DOI] [PMC free article] [PubMed] [Google Scholar]
- 32. Conde‐Vancells J, Gonzalez E, Lu SC, Mato JM, Falcon‐Perez JM. Overview of extracellular microvesicles in drug metabolism. Expert Opin Drug Metab Toxicol 2010;6:543‐554. [DOI] [PMC free article] [PubMed] [Google Scholar]
- 33. Royo F, Falcon‐Perez JM. Liver extracellular vesicles in health and disease. J Extracell Vesicles 2012;1. [DOI] [PMC free article] [PubMed] [Google Scholar]
- 34. Niemela O, Parkkila S, Juvonen RO, Viitala K, Gelboin HV, Pasanen M. Cytochromes P450 2A6, 2E1, and 3A and production of protein‐aldehyde adducts in the liver of patients with alcoholic and non‐alcoholic liver diseases. J Hepatol 2000;33:893‐901. [DOI] [PubMed] [Google Scholar]
- 35. Di YM, Chow VD, Yang LP, Zhou SF. Structure, function, regulation and polymorphism of human cytochrome P450 2A6. Curr Drug Metab 2009;10:754‐780. [DOI] [PubMed] [Google Scholar]
- 36. Nakajima M. Smoking behavior and related cancers: the role of CYP2A6 polymorphisms. Curr Opin Mol Ther 2007;9:538‐544. [PubMed] [Google Scholar]
- 37. Jin M, Kumar A, Kumar S. Ethanol‐mediated regulation of cytochrome P450 2A6 expression in monocytes: role of oxidative stress‐mediated PKC/MEK/Nrf2 pathway. PLoS One 2012;7:e35505. [DOI] [PMC free article] [PubMed] [Google Scholar]
- 38. Smith C, Stamm SC, Riggs JE, Stauber W, Harsh V, Gannett PM, et al. Ethanol‐mediated CYP1A1/2 induction in rat skeletal muscle tissue. Exp Mol Pathol 2000;69:223‐232. [DOI] [PubMed] [Google Scholar]
- 39. Baer BR, Rettie AE. CYP4B1: an enigmatic P450 at the interface between xenobiotic and endobiotic metabolism. Drug Metab Rev 2006;38:451‐476. [DOI] [PubMed] [Google Scholar]
- 40. Hardwick JP. Cytochrome P450 omega hydroxylase (CYP4) function in fatty acid metabolism and metabolic diseases. Biochem Pharmacol 2008;75:2263‐2275. [DOI] [PubMed] [Google Scholar]
- 41. Park EC, Kim SI, Hong Y, Hwang JW, Cho GS, Cha HN, et al. Inhibition of CYP4A reduces hepatic endoplasmic reticulum stress and features of diabetes in mice. Gastroenterology 2014;147:860‐869. [DOI] [PubMed] [Google Scholar]
- 42. Garcia‐Martinez I, Santoro N, Chen Y, Hoque R, Ouyang X, Caprio S, et al. Hepatocyte mitochondrial DNA drives nonalcoholic steatohepatitis by activation of TLR9. J Clin Invest 2016;126:859‐864. [DOI] [PMC free article] [PubMed] [Google Scholar]
Associated Data
This section collects any data citations, data availability statements, or supplementary materials included in this article.
Supplementary Materials
Additional Supporting Information may be found at http://onlinelibrary.wiley.com/doi/10.1002/hep4.1066/suppinfo.
Supporting Information


