Abstract
Liver cirrhosis can disturb circadian rhythms, decreasing patient quality of life. Changes in metabolic products in cirrhosis are poorly understood. We evaluated changes in liver metabolism products using a thioacetamide‐induced mouse model of liver cirrhosis exhibiting circadian rhythm disturbance. Principal component analysis indicated that the circular progression found in the control group was disrupted in the thioacetamide group, and Jonckheere‐Terpstra‐Kendall analysis showed an imbalanced pattern of oscillating metabolic products. In addition to changes in serotonin and other vitamin A–related metabolites, differences in metabolic products associated with energetics, redox homeostasis, bile acid production, inflammation, and other processes were identified. Carbohydrate metabolism showed a reduction in metabolic products associated with the tricarboxylic acid cycle, suggesting up‐regulation of glycolysis and reduced mitochondrial activity. Lipid metabolism showed an increase in ω‐oxidation products, suggesting decreased β‐oxidation. Conclusion: These data will be useful for chronotherapy and modulation of circadian rhythms in patients with liver damage. (Hepatology Communications 2017;1:704–718)
Abbreviations
- DT
dummy variable with time period
- DTA
dummy variable with status of TA
- HETE
hydroxyeicosatetraenoic acid
- JTK
Jonckheere‐Terpstra‐Kendall
- PC
principal component
- PCA
principal component analysis
- PUFA
polyunsaturated fatty acid
- RFA
random forest analysis
- TA
thioacetamide
- TCA
tricarboxylic acid
- UDP
uridine diphosphoglucuronate
- UMP
uridine monophosphate
- ZT
zeitgeber time
The circadian rhythm is an approximately 24‐hour physiological cycle that is present in a broad range of organisms from yeast to humans. The suprachiasmatic nucleus is important for its regulation and involved in regulating a variety of additional physiological functions including blood pressure, body temperature, hormone levels, and the sleep–wake cycle. Genes such as Period (Per1), Clock, and Bmall are known to be the core clock genes that code for proteins that comprise the mechanism for generating the fundamental oscillations underlying the circadian rhythm. The molecular mechanism of the circadian clock in mammals is configured from these clock genes, forming a feedback loop through transcription and translation.1 As molecular investigations of these clock genes progress, it is becoming clear that they are present in most peripheral tissues, from the heart, vasculature, liver, and kidneys to the skin and mucous membranes.2 Alteration of the circadian rhythm has been shown to be correlated with carcinogenesis, osteoporosis, aging, and lifestyle‐related diseases such as hypertension, hyperlipidemia, and diabetes.3
Liver damage is known to upset the circadian rhythm. In particular, cirrhosis, in which the liver undergoes fibrosis causing irreversible liver damage, alters diurnal variation of blood pressure, raises nocturnal portal pressure, and alters hormonal rhythms.4 Patients with cirrhosis have been reported to complain more of sleep disorders than healthy individuals,5 and insomnia, delayed sleep, and excessive daytime sleepiness are clinical issues for patients with liver damage.6 Sleep disorders are believed to be caused by the effect of increased blood ammonia concentrations on the central nervous system, as well as decreased breakdown of hormones such as melatonin, altering circadian rhythms. In addition, a study that selectively eliminated serotonin, which is correlated with depression and dysregulation of emotions, eating, and sleeping, using an enzyme that breaks down tryptophan, an amino acid used for synthesizing serotonin, found that serotonin is required for regulation of the circadian rhythms of the sleep–wake cycle in rats.7 Although it has been reported that administration of a melatonin or branched chain amino acid formulation ameliorates sleep disorders,8 new treatment methods based on the mechanism of rhythm disruption are needed. If the liver, which is involved in processing metabolic products, is damaged, numerous metabolic anomalies arise, anomalous metabolic products increase, and this contributes to altered circadian rhythms. Thus, more detailed analysis of the modulation of circadian rhythms in patients with liver cirrhosis is needed.9 Few prior reports have used metabolome analysis to evaluate metabolic products. In addition, most analyses of circadian rhythms have been conducted with healthy livers, and no detailed analyses of the circadian rhythms of patients with cirrhotic livers have been published that use comprehensive metabolome analysis. This study analyzed circadian rhythms in the presence of liver damage by evaluating differences in liver metabolic products every 6 hours in healthy mice and chronic liver injury mice that were administered thioacetamide (TA) for 8 weeks. The results of this study could facilitate development of novel chronotherapy and circadian rhythm modulation in patients with liver damage.
Materials and Methods
SAMPLE PREPARATION
All experiments were carried out in accordance with the guidelines approved by the Committee on the Ethics of Animal Experiments at the University of Yamaguchi. All surgery was performed under sodium pentobarbital anesthesia, and every effort was made to minimize suffering. C57BL/6N female mice at 16 weeks of age were used. Livers were collected at four zeitgeber time (ZT) points (ZT4, 12:00; ZT10, 18:00; ZT16, 0:00; and ZT22, 6:00) from mice intraperitoneally injected with phosphate‐buffered saline (control) or 200 mg/kg TA intraperitoneally two times a week for 2 months.
24‐HOUR BEHAVIOR MONITORING
The Chronobiology Kit (Stanford Software Systems) was used to observe the amount and periodicity of the movement of mice. Locomotor activity was quantified as the number of crossings of the sensors. Observations were made over 2 months, and the results were displayed as an actogram. The light/dark conditions were established with a light period from ZT0 (08:00) to ZT12 (20:00) and a dark period from ZT12 (20:00) to ZT24 (08:00), such that light:dark = 12:12 (hours).
METABOLOME ANALYSIS
Metabolomic and statistical analyses were conducted at Metabolon as described.10 Briefly, mouse liver samples were subjected to methanol extraction, then split into aliquots for analysis by ultrahigh‐performance liquid chromatography/mass spectrometry in the positive, negative, or polar ion mode and by gas chromatography/mass spectrometry. Metabolites were identified by automated comparison of ion features to a reference library of chemical standard, followed by visual inspection for quality control. For statistical analyses and data display, any missing values were assumed to be below the limits of detection; these values were imputed with the compound minimum (minimum value imputation). Principal component analysis (PCA) was run in ArrayStudio (http://www.Omicsoft.com). Each principal component (PC) is a linear combination of every metabolite, and the PCs are uncorrelated. The number of PCs is equal to the number of observations.
JTK_CYCLE
A heat map was generated in ArrayStudio using correlation‐based clustering of biochemicals. The JTK_Cycle was applied as described.11
STATISTICS
Data are presented as mean ± standard deviation. A two‐tailed Student t test was used to assess significance. Where three or more groups were present, a one‐way analysis of variance was applied. To determine statistical significance, Welsh's two‐factor t tests were performed in ArrayStudio (Omicsoft) or R to compare protein‐normalized data between experimental groups; P < 0.05 was considered significant. Multiple regression analysis was performed to test for differences in each hepatic metabolite between TA and control groups in relation to the sampling time points: ZT4 (T1), ZT10(T2), ZT16(T3), and ZT22(T4). In the analysis, the relative concentration of each metabolite (Y) was set as an objective variable. For explanatory variables, the status of TA was set as a dummy variable (DTA; TA group = 1, control group = 0), and the influence of time points was examined by use of three dummy variables (DT2, DT3, DT4), with a setting of T1 as the reference category. In order to evaluate the interaction of time with the status of TA, we also included the terms DTA×DT2, DTA×DT3, and DTA×DT4 in the regression model as shown below.
Y = b0 + b1 (DTA) + b2(DT2) + b3(DT3) + b4(DT4) + b5(DTA×DT2) + b6(DTA × DT3) + b7(DTA×DT4)
The partial regression coefficient b1 represent an overall difference between the two groups, while b2, b3, and b4 represent the differences in the relative concentrations of metabolite at the respective time points compared to those at T1. Coefficients b5, b6, and b7 attached to the interaction term represent time‐dependent differences of values between the two groups. The association of each explanatory parameter with Y (the relative concentration of each metabolite) was expressed as a standardized partial regression coefficient, which takes values between −1.0 and 1.0. The statistical significance of the partial regression coefficient was expressed in three grades: * P < 0.05, ** P < 0.01, and *** P < 0.001.
Results
EVALUATION OF LIVER‐DAMAGED MICE TREATED WITH TA
The 24‐hour behavior of mice with liver damage induced by 2 months of intraperitoneal administration of TA was evaluated using actograms, over a period of 2 months. A difference between diurnal and nocturnal activity was confirmed in the controls (which were administered phosphate‐buffered saline intraperitoneally), whereas in TA‐induced mice with cirrhosis, both diurnal activity and nocturnal activity increased and the difference between them decreased (Fig. 1A,B). Following the actogram analysis, mouse livers were isolated and tissue staining was performed. The livers of TA‐induced mice with cirrhosis showed clear liver fibrosis, visualized using sirius red staining (Fig. 1C,D).
Figure 1.
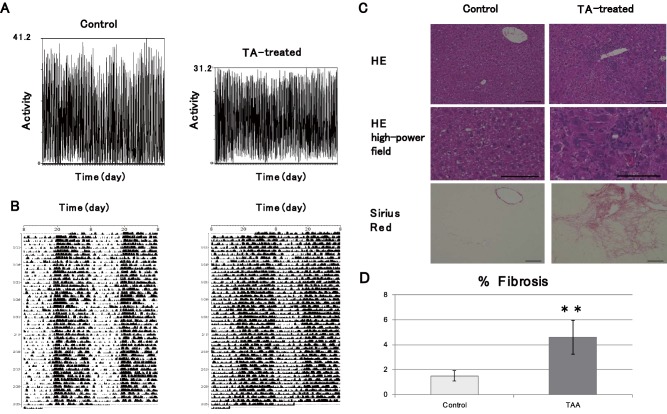
Evaluation of TA‐induced liver damage model. (A) Representative actogram of TA‐treated mouse and wild‐type mouse. The diurnal activity (ZT0‐ZT12) of the control group and the TA group was 4,095.0 ± 1,899.5 and 5,877.1 ± 1,295, respectively. The P value was 4.40E‐10. The nocturnal activity (ZT12‐ZT24) of the control group and the TA group was 13,173.1 ± 1,899.5 and 12,107.1 ± 1,295.4, respectively. The P value was 1.70E‐3. (B) Representative double‐plotted actograms of TA‐treated mouse and wild‐type mouse, with light/dark conditions consisting of a light period (ZT0‐ZT12) and a dark period (ZT12‐ZT24) for a ratio of 12:12 hours. The 24‐hour activity (ZT0‐ZT24) of the control group and the TA group for each day was 19,895.9 ± 3,222.2 and 20,052.5 ± 2,225.7, respectively. The P value was 0.65. The ratio of nocturnal (ZT12‐ZT24) and diurnal (ZT0‐ZT12) activity of the control group and the TA group was 3.90 ± 1.81 and 2.17 ± 0.63, respectively. The P value was 1.91E‐12. (C) Liver changes caused by TA administration. Top row, hematoxylin and eosin staining; bottom row, sirius red staining. (D) Percentage testing positive for sirius red staining by area. Data are represented as mean ± standard deviation. Abbreviations: HE, hematoxylin and eosin; TAA, Thioacetamide.
PCA AND HIERARCHICAL CLUSTERING ANALYSIS
Livers were collected at four time points (ZT4, ZT10, ZT16, and ZT22) from mice intraperitoneally injected with phosphate‐buffered saline (control) or 200 mg/kg TA intraperitoneally two times a week for 2 months. We checked serum aspartate aminotransferase levels and found that there were no significant differences between the two groups (Supporting Fig. S1). Liver samples (control n = 4, TA group n = 5 for each ZT) were subjected to methanol extraction, then split into aliquots for analysis by ultrahigh‐performance liquid chromatography/mass spectrometry in the positive, negative, or polar ion mode and by gas chromatography/mass spectrometry. The method allows one to make a set of linear combinations of a large number of parameters (values of metabolites), called principal components, based on correlations among them. Each PC is uncorrelated and numbered according to its priority. In general, only the first two to three components (PC1, PC2, and PC3) are useful as summary variables for the analytical purpose. In this study we employed PC1 and PC2 to represent overall variations among 587 metabolites. Supporting Tables S1 and S2 show factor loadings of PC1 and PC2 with respect to the 587 metabolites. PCA tended to separate by treatment (either control or TA) in component 1, with samples forming two partially overlapping populations in component 2 by ZT (ZT4/ZT10 and ZT16/ZT22), which could reflect circadian differences between livers in “light” and “dark” periods (Fig. 2A). Control samples appeared to show a cyclical progression (red arrows), likely reflecting circadian changes in the data set (Fig. 2B). In computing PC1 and PC2 for the TA group, we used the same formulae for PC1 and PC2 obtained using metabolite date from the control group. In TA‐treated samples, however, this cyclical pattern was less apparent, which could reflect disease‐mediated effects on circadian metabolites (Fig. 2C). In the hierarchical clustering analysis, which clusters samples by similarity, the top‐level split in the dendrogram separated control and TA samples, consistent with the observations in the PCA, with samples tending to form secondary clusters by ZT, though ZT16 and ZT22 tended to form a mixed subcluster (Fig. 2D).
Figure 2.
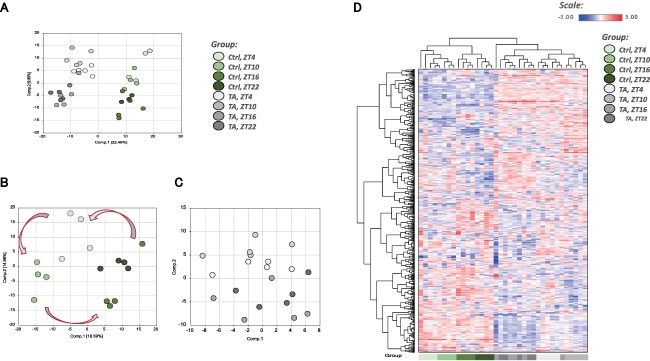
Overview of metabolome analysis. (A) PCA of normalized metabolic data obtained from the liver at ZT4, ZT10, ZT16, and ZT22. Percentage values indicated on the axes represent the contribution rate of PC1 and PC2 to the total amount of variation. Identical ZTs are encircled by dotted lines of the same color. (B) PCA showing only the controls from (A). (C) PCA showing only the TA group from (A). In computing PC1 and PC2 for the TA group, we used the same formulae obtained using metabolite data from the control group. (D) Heat map of the hierarchical cluster analysis. Columns show the liver metabolome profiles at ZT4, ZT10, ZT16, and ZT22. Rows show normalized levels of each metabolite. The dendrogram for each heat map shows the relatedness of the normalized metabolite level patterns. Abbreviation: Ctrl, control.
RANDOM FOREST ANALYSIS OF BIOMARKERS DIFFERENTIATING CLASSIFICATION GROUPS
Random forest analysis (RFA) is a statistical tool that uses a supervised classification technique based on an ensemble of decision trees; it can aid in the identification of biomarkers that differentiate classification groups. We used four RFAs in this experiment. The top 30 biochemicals important to control group separation contained similar classes of molecules (e.g., the activated sugars uridine diphosphoglucuronate (UDP)–glucose and UDP‐galactose and two isobars derived from pentose phosphate metabolism, ribulose/xylulose and arabitol/xylitol) (Fig. 3A). The RFA for TA samples also highlighted molecules involved in redox homeostasis (reduced glutathione, cysteine‐glutathione disulfide, S‐adenosylhomocysteine) and additional molecules related to carbohydrate metabolism (lactate, an isobar of N‐acetylglucosamine/N‐acetylgalactosamine) (Fig. 3B). RFA by disease status (control and TA samples, independent of ZT) highlighted lipid metabolites (sphingolipids, fatty acids, complex lipids), the bile acid taurocholenate sulfate, and the endocannabinoid stearoyl ethanolamide (Fig. 3C). Finally, in the RFA assessing control and TA (at four ZTs), the activated sugars UDP‐glucose and UDP‐galactose were again highlighted among the top 30 biochemicals important to sample segregation. Several biochemicals related to metabolism of nucleotides (e.g., uridine monophosphate [UMP], 5′‐cytidine monophosphate, allantoic acid, 4‐ureidopropionate), arginine (N‐acetylcitrulline, N‐alpha‐acetylornithine, and citrulline), and lipids (e.g., propionylglycine, 1‐linoleoyl‐glycerophosphatidylserine), as well as products of the gut microbiome (imidazole lactate, 4‐ethylphenylsulfate), were also highlighted (Fig. 3D).
Figure 3.
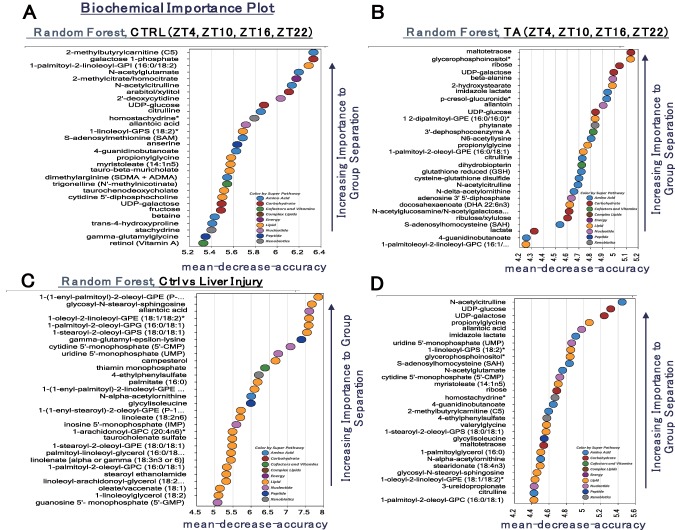
Identification of biomarkers using RFA. RFA is a statistical tool that uses supervised classification techniques based on an ensemble of decision trees that can aid in the identification of biomarkers differentiating classification groups. (A) RFA of the control group at ZT4, ZT10, ZT16, and ZT22. (B) RFA of the TA group at ZT4, ZT10, ZT16, and ZT22. (C) RFA comparing the control group and the TA group. (D) RFA of ZT4, ZT10, ZT16, and ZT22 in the control group and the TA group. Abbreviations: ADMA, asymmetric dimethylarginine; Ctrl, control; GPC, glycerophosphocholine; GPE, glycerophosphoethanolamine; GPG, glycerophosphoglycerol; GPS, glycerophosphatidylserine; SDMA, symmetric dimethylarginine.
OVERVIEW OF OSCILLATING METABOLITES (IDENTIFIED USING JTK_CYCLE)
The JTK_Cycle is a novel nonparametric statistical algorithm designed to identify and characterize cycling variables in large data sets.11 Oscillating metabolites were identified in control samples using the R script JTK_Cycle11; a P value of 0.05 was chosen as the threshold for significance, and candidate oscillating molecules are shown as a heat map (Fig. 4). Strikingly, the circadian patterns for many of the biochemicals identified in control samples appeared disrupted in TA samples, consistent with previous observations that liver disease can disrupt circadian rhythms.
Figure 4.
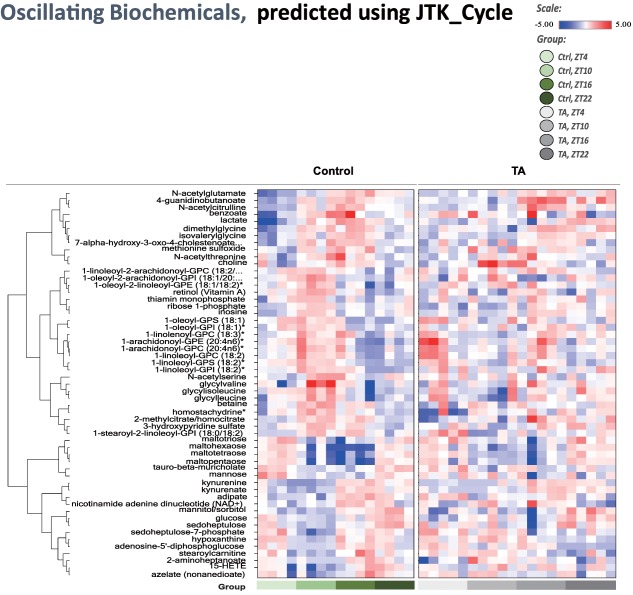
Analysis of oscillating biochemicals using the JTK_Cycle. The R package JTK_Cycle was used to detect cycling transcripts. Transcripts with P < 0.05 for JTK analysis were considered to be cycling transcripts. Candidate oscillating molecules are shown in the heat map. Abbreviations: Ctrl, control; GPC, glycerophosphocholine; GPE, glycerophosphoethanolamine; GPI, glycerophosphomyoinositol; GPS, glycerophosphatidylserine.
ANALYSIS OF METABOLITES THAT DIFFERED BETWEEN THE CONTROL AND TA GROUPS
We identified a number of metabolic products that showed clear differences in circadian pattern between the control and TA groups. Retinol and retinal showed a peak at ZT10 in the control group, but no clear peak could be identified in the TA group. Ascorbate was high in the control group at ZT4 and ZT10, when it was low in the TA group. However, the oxidized form, dehydroascorbate, was high in the TA group at these times. Serotonin was lower in the TA group at all ZTs and showed a different rising and falling pattern. Among the amino acids, glycine, which is thought to be involved in sleep, was found not to oscillate in the TA group. Among branched chain amino acids, leucine, isoleucine, and valine dropped in the TA group at ZT4 and ZT10 (Fig. 5).
Figure 5.
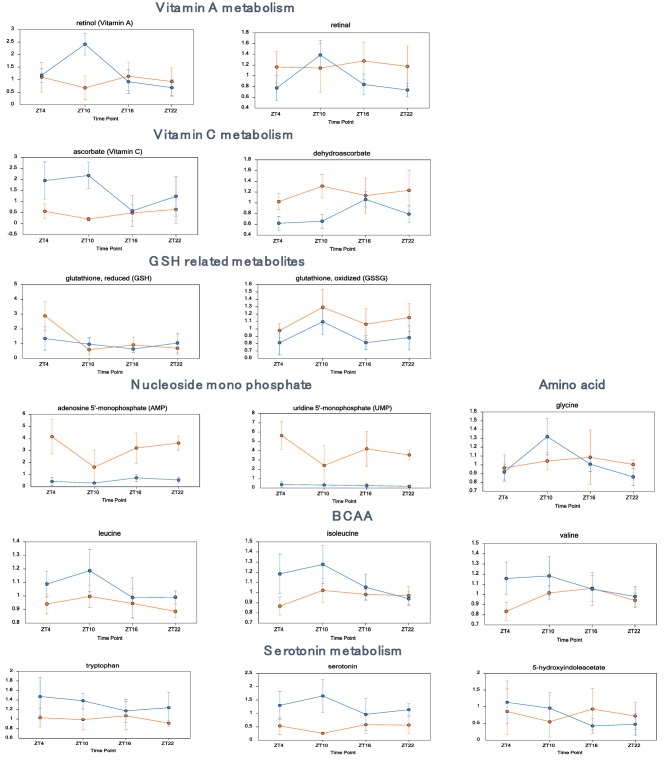
Metabolites that differed significantly between the control and TA groups (vitamins, amino acids, serotonin). Daily variations in metabolites related to vitamin A metabolism, including retinol and retinal; metabolites related to vitamin C metabolism, including ascorbate and dehydroascorbate; various amino acids; metabolites related to serotonin metabolism, including serotonin and 5‐hydroxyindoleacetate. Data are expressed as mean ± standard deviation. Statistical differences are shown in Supporting Table S3. Abbreviations: BCAA, branched chain amino acid; GSH, glutathione.
ANALYSIS OF EFFECTS ON BILE ACID PRODUCTION
Primary bile acids (e.g., taurocholate, beta‐muricholate) were higher in the TA group than in the control group (ZT4), with a subtler effect at ZT10 and ZT16 (TA versus control). Secondary bile acids showed few significant changes at these three ZTs (TA versus control), though two sulfated bile acids were found to be lower in the TA group than in controls (taurolithocholate 3‐sulfate and taurocholenate sulfate) (Supporting Fig. S2). Several secondary bile acids (e.g., taurocholate) were lower at ZT22 (TA versus control). The bile acid 7‐ketodeoxycholate was elevated in the TA group compared to control (all ZTs).
ANALYSIS OF EFFECTS ON INFLAMMATION‐ASSOCIATED METABOLITES
Changes in the ratio of n3:n6 polyunsaturated fatty acids (PUFAs) can indicate inflammation; we found that PUFAs, as a class, tended to decline in the TA group compared to control (ZT10, ZT16, and ZT22). Eicosanoids are bioactive lipids that are enzymatically derived from PUFAs; these biochemicals (5‐hydroxyeicosatetraenoic acid [5‐HETE], 12‐HETE, and 15‐HETE) were elevated in the TA group (compared to control, ZT10), suggestive of increasing inflammation at ZT10 (Supporting Fig. S3). Finally, itaconate (which can be produced from cis‐aconitate following immune cell activation) was also elevated in the TA group (compared to control, ZT22).
ANALYSIS OF EFFECTS ON CARBOHYDRATE METABOLISM
Glucose can be used to support a variety of physiological processes, including energy generation, fatty acid synthesis, protein glycosylation, and nucleotide biogenesis. The TA group (compared to control) showed changes in glycolytic intermediates associated with changing use. Although glucose was not significantly altered, the increases observed in glucose 6‐phosphate, dihydroxyacetone phosphate, and an isobar of sugar diphosphates (fructose 1,6‐diphosphate, glucose 1,6‐diphosphate, and myo‐inositol 1,4‐diphosphate or 1,3‐diphosphate) could suggest changes in glycolytic use in the TA group (compared to control, ZT4, ZT10, and ZT22). The observed decline in pool size of three‐carbon intermediates may also be associated with increased glycolytic use. 3‐Phosphoglycerate and phosphoenolpyruvate were decreased in the TA group (compared to control, ZT16, and ZT22). Consistent with signs of increased glycolysis, acetyl coenzyme A was elevated at all ZTs (TA versus control). Although no large changes were observed in citrate, aconitate, or alpha‐ketoglutarate, which are metabolites associated with the tricarboxylic acid (TCA) cycle, a decrease was observed in succinate, fumarate, and malate in the TA group at ZT16 and ZT22, points at which levels of these metabolites are usually high (Fig. 6).
Figure 6.
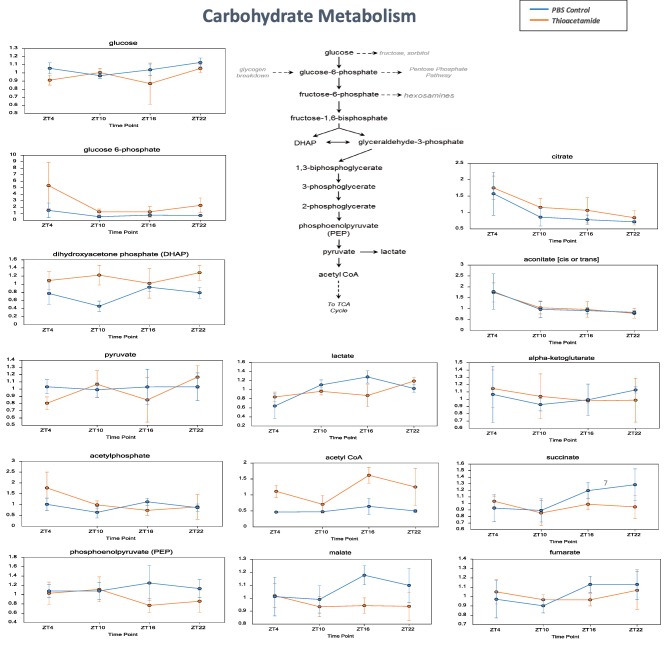
Metabolites related to carbohydrate metabolism. Daily variations in metabolites of glucose from the glycolytic system to the TCA cycle, including citrate, alpha‐ketoglutarate, succinate, and aconitate; metabolites related to glycolysis, including glucose, glucose‐6‐phosphate, pyruvate, and lactate. Data are expressed as mean ± standard deviation. Statistical differences are shown in Supporting Table S3. Abbreviations: CoA, coenzyme A; PBS, phosphate‐buffered saline.
ANALYSIS OF EFFECTS ON LIPID METABOLISM
Long‐chain fatty acids (e.g., myristoleate, palmitoleate) and PUFAs (e.g., eicosapentaenoate) tended to decline in the TA group (compared to control, all ZTs). Acylcarnitines did not show consistent trends, although two acylcarnitines (palmitoylcarnitine and stearoylcarnitine) were elevated at ZT10 and decreased at ZT16 (TA versus control). The dicarboxylate fatty acids adipate, pimelate, and azelate were also elevated in the TA group (compared to control, ZT4, and ZT10). The related acylcarnitine conjugate adipoylcarnitine was also elevated in the TA group (compared to control, ZT4, and ZT16), consistent with increased use of omega‐oxidation (Fig. 7).
Figure 7.
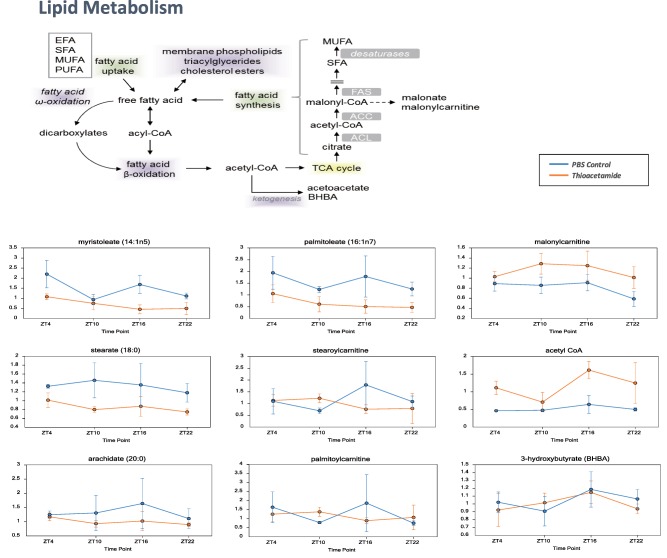
Metabolites related to lipid metabolism. Daily variations in free fatty acids and β‐oxidation of fatty acids from acyl‐coenzyme A, including myristoleate, palmitoleate, stearate, and arachidate. Data are expressed as mean ± standard deviation. Statistical differences are shown in Supporting Table S3. Abbreviations: ACC, acetyl‐coenzyme A carboxylase; ACL, adenosine triphosphate citrate lyase; CoA, coenzyme A; EFA, essential fatty acid; FAS, fatty acid synthase; MUFA, monounsaturated fatty acid; PBS, phosphate‐buffered saline; SFA, saturated fatty acid.
Discussion
Although previous reports have analyzed the expression of genes related to hepatic modulation of circadian rhythms, none has involved a detailed metabolome analysis. A metabolomics approach was used to compare wild‐type mice and Clock –/– mice12; and though other studies have reported on nucleic acid metabolism in wild‐type mice and Bmal1 L–/– mice13 and on changes resulting from administration of a high‐fat diet,14 no detailed studies have compared healthy with cirrhotic livers. Thus, we analyzed circadian rhythm alterations in mice with cirrhosis produced by TA administration. In the TA group, which exhibited fibrosis, there was a clear decrease in activity and disruption of the circadian rhythm (Fig. 1). Changes to circadian rhythms due to liver damage have been studied, and it is known that hepatic impairment is associated with changes in vitamin A metabolism, anatomical changes in the retina, and changes in concentrations of hormones such as thyroid‐stimulating hormone. Particularly in liver cirrhosis, at which point liver damage has become irreversible and liver fibrosis has occurred, variceal bleeding, changes to diurnal blood pressure variations, increased nocturnal portal tension, and changes to hormonal rhythm are known to occur.4 Numerous metabolic abnormalities occur with cirrhosis, causing metabolite concentrations to change and abnormal metabolic products to accumulate, which is thought to cause changes in central and peripheral circadian rhythms. In addition, the decreased ability of damaged livers to break down various hormones increases their concentration, causing abnormalities in diurnal variations. Such changes to circadian rhythms are thought to lead to various medical conditions, including sleep disorders. Melatonin is broken down in the liver, and a reduction in this process in damaged livers is believed to affect sleep by increasing plasma melatonin levels. However, as most strains of experimental mice are reported to be unable to produce melatonin,15 we opted not to analyze melatonin in the present study.
PCA showed a cyclical progression in metabolite levels, believed to be caused by circadian rhythms, in the control group; but this was less apparent in the TA group (Fig. 2). Furthermore, most of the oscillating metabolites identified in the control group exhibited disrupted oscillation in the TA group or differed in amplitude despite a similar cycle (Fig. 4). These results are consistent with a report that the amplitude of clock gene expression is reduced in damaged livers.16 Expression of the liver clock gene cry2 and mRNA expression of clock‐controlled genes, such as PPARα and POR, have been shown to decrease17; but the details of the mechanism remain unknown. In addition, chronic ethanol consumption is known to alter circadian clock function in the liver, altering diurnal rhythms of fat metabolism gene expression and causing fatty liver.18 Further analysis of the circadian rhythm disruption caused by liver damage is necessary.
Many metabolites with a high score for PC1 loading in Fig. 2A are listed in Fig. 3C (e.g., 1‐[1‐enyl‐palmitoyl]‐2‐oleoyl‐glycerophosphoethanolamine, UMP, and inosine monophosphate), suggesting that PC1 in Fig. 2A is important for distinguishing the control and TA groups. Several metabolites with a high score for PC2 loading in Fig. 2A are listed in Fig. 3A (e.g., UDP‐galactose, UDP‐glucose, N‐acetylcitrulline, S‐adenosyl methionine, and citrulline), Fig. 3B (e.g., UDP‐galactose, UDP‐glucose, and S‐adenosylhomocysteine), and Fig. 3D (e.g., N‐acetylcitrulline, UDP‐glucose, and UDP‐galactose), suggesting that PC2 in Fig. 2A is important for distinguishing each ZT group. Metabolites with a high score for PC1 or PC2 loading in Fig. 2B,C are preferentially listed in Fig. 3A (e.g., galactose 1‐phosphate, allantoic acid, taurochenodeoxycholate). UDP‐glucose and UDP‐galactose were found to be in the top 30 metabolites of RFA for the control group. UDP‐glucose and UDP‐galactose were also in the top 30 for the TA group and at each ZT for the controls and the TA group. Thus, UDP‐glucose and UDP‐galactose can be considered to be circadian rhythm markers, regardless of liver damage (Fig. 3A,B). Furthermore, glutathione, cysteine‐glutathione disulfide, and S‐adenosylhomocysteine, which are involved in redox homeostasis, were important for identifying each ZT in the TA group (Fig. 3B). The circadian pattern of glutathione has been reported to change in rats treated with N‐nitrosodiethylamine,19 and these metabolites are considered to be affected by liver damage–induced oxidative stress caused by administration of TA. The RFA of the controls and the TA group identified lipid metabolites (sphingolipids, fatty acids, and complex lipids) as well as the bile acid taurocholenate sulfate (Fig. 3C), which may indicate that cirrhosis impairs bile acid transport and impairs mitochondrial fatty acid metabolism. The RFA of the controls and the TA group at each ZT identified UDP‐glucose and UDP‐galactose again. UMP was also identified, suggesting involvement in promoting glycosylation or extracellular matrix deposition. Also detected were compounds related to arginine (N‐acetylcitrulline, N‐alpha‐acetylornithine, and citrulline), those related to nucleotides (e.g., UMP, 5′‐cytidine monophosphate, allantoic acid, and 4‐ureidopropionate), those involved in lipid metabolism (e.g., propionylglycine, 1‐linoleoyl‐glycerophosphatidylserine), and those involved in gut microbiome products (imidazole lactate, 4‐ethylphenylsulfate) (Fig. 3D). It is interesting to note that the intestinal microbiome has been reported to be altered by liver cirrhosis.20
Investigation of changes in various metabolic products revealed that the vitamin A peak detected at ZT10 in the control group was not present in the TA group (Fig. 5). Vitamin A absorbed in the gut is transported to the liver, where it binds to retinol‐binding protein, a plasma protein synthesized in liver cells. Then, it is released into the perisinusoidal space, absorbed by hepatic stellate cells, and then stored in fat droplets. Approximately 90% of the vitamin A in the body is stored as fatty acid esters in the liver, from which it is transported to target tissues as needed. Vitamin A has specific nuclear receptors and is known to act as a clock activity regulator.21 Interestingly, administering all‐trans‐retinoic acid is known to alter the phase and amplitude of circadian rhythms,22 and vitamin A deficiency reduces spontaneous behavior in mice and weakens delta waves during sleep. Thus, a loss of the rhythm of vitamin A levels could be important in the disruption of circadian rhythms caused by liver impairment. Furthermore, vitamin A is known to have an anti‐inflammatory effect on the liver, and changes in ascorbic acid and dehydroascorbic acid, antioxidants, as well as glutathione and glutathione disulfide have been found particularly during sleep (ZT4, ZT10), suggesting that oxidative stress may have increased in the TA group.
Another interesting change was detected in serotonin. Patients with cirrhosis have been reported to show decreased serum serotonin levels,23 and we observed a decrease at all time points in the TA group (Fig. 5). Serotonin is a neurotransmitter synthesized from tryptophan, an essential amino acid. It performs numerous physiological functions and is involved in sleep, eating, sexual activity, emotional behavior, body temperature, and learning. Of the serotonin in the body, 90% is found in the gut, 5% in the brain, and most of the rest in the blood. Serotonin produced in the gut is transported to the liver by the portal vein, where it is metabolized and secreted in the urine; thus, it does not reach the rest of the body. However, peripheral serotonin has recently garnered attention due to its involvement in energy homeostasis, and it has been suggested to participate in gluconeogenesis and sugar absorption in the liver.24 Thus, further analysis is required.
Among the changes related to bile acid metabolism, an increase in primary bile acids, including taurocholate and beta‐muricholate, was observed in the TA group (compared to controls, at ZT4). Serum bile acids have been reported to increase in rat blood serum following changes in reuptake caused by low‐dose TA treatment.25 Bile acids are produced from cholesterol in hepatocytes, transported to the bile canaliculi by active transport, and then secreted into the bile duct. Expression of the gene for the rate‐limiting enzyme of bile acid synthesis (cytochrome P450 7A1) exhibits circadian fluctuations.26 We considered that TA‐induced liver damage decreases production of bile acids but obstructs their transport to the bile canaliculi, resulting in the observed increase. In addition, primary bile acids synthesized from cholesterol in the liver are released into the gut, where they are modified by the gut flora to form secondary bile acids that are then reabsorbed. A number of secondary bile acids, such as taurolithocholate, were found to be lower in the TA group; but this could be due to microbiome‐mediated production. 7‐Ketodeoxycholate was elevated at all ZTs in the TA group, supporting the conclusion that the TA‐treated mice possess a divergent microbiome. Future evaluation focusing on changes to serum bile acids; transporters such as Ntcp, Oatp1b1, and Ostα; and the enzymes involved in biosynthesis will be necessary.
Among metabolites involved in inflammation, HETEs, which are derived from PUFAs, were found to change. 15‐HETE was identified as a circadian metabolite. The peak shifted from ZT16/ZT22 to ZT4/ZT10, indicating a shift in periodicity, which was also observed for 12‐HETE and 5‐HETE. 12‐HETE is known to be a stress mediator, but further details are unknown. Itaconate (which can be produced from cis‐aconitate following immune cell activation) was also elevated in the TA group (compared to control, ZT22). Eicosanoids and itaconate did not increase at the same times, suggesting differing causes for inflammation. There is a possibility that toxic effects of TA could cause some of the changes that are not related to liver cirrhosis. Toxic effects of TA may affect inflammation pathways, but we think it is not so strong because we have checked aspartate aminotransferase and found that there were no significant differences between the two groups (Supporting Fig. S1).
Glucose can be used to support a variety of physiological processes, including energy generation, fatty acid synthesis, protein glycosylation, and nucleotide biogenesis. The TA group (compared to control) showed changes in glycolytic intermediates associated with changing use: for example, while glucose was not significantly altered, increases in glucose 6‐phosphate, dihydroxyacetone phosphate, and an isobar of sugar diphosphates (fructose 1,6‐diphosphate, glucose 1,6‐diphosphate, and myo‐inositol 1,4 or 1,3‐diphosphate) suggested changes in glycolytic use in the TA group (compared to control, ZT4, ZT10, and ZT22). The observation that acetyl coenzyme A was elevated at all ZTs (TA versus control) was consistent with signs of activated glycolysis, and it is conceivable that the glycolytic system was activated to compensate for decreased oxidative phosphorylation in mitochondria. In addition, glycogen‐related metabolites showed a mixed effect at ZT16 (TA versus control): maltotriose and maltose were decreased, but maltohexaose and maltopentaose increased. This pattern of metabolites could suggest high demand for glycogen breakdown products to support glycolysis. Interestingly, it has been reported that progression of liver damage is accompanied by an adaptive metabolic shift, from generating energy predominantly by oxidative phosphorylation to glycolysis, allowing maintenance of energy homeostasis during early stages of liver injury but leading to hepatocyte dysfunction during terminal stages of chronic liver disease because hepatocytes are unable to sustain high levels of energy production from glycolysis.27 In particular, levels of the TCA cycle metabolites citrate, aconitate, and alpha‐ketoglutarate were similar in both groups; but levels of succinate, fumarate, and malate were lower in the TA group at ZT16 and ZT22, when they are elevated in healthy individuals. Glutaminolysis followed by reductive carboxylation may have been involved. Healthy cells can oxidatively metabolize glutamine‐derived alpha‐ketoglutarate in the TCA cycle and generate pyruvate from malate through glutaminolysis. Alternatively, some tissues can reductively carboxylate alpha‐ketoglutarate to generate citrate, and recent studies have indicated that the isocitrate dehydrogenase reaction is highly reversible in various cell types.28 It has been suggested that citrate, aconitate, and alpha‐ketoglutarate, which are active at ZT16 and ZT22, would decrease greatly in the TA group but are maintained at similar levels in both groups by compensatory reductive carboxylation. However, succinate, fumarate, and malate are not supplied by reductive carboxylation, so despite their unchanged levels at inactive hours, they increased in the control group during the active period of ZT16 and ZT22 and significantly decreased in the TA group. However, because other factors, including differences in the amount of exercise between the two groups, may be involved, more detailed future study is recommended.
The long‐chain fatty acids and PUFAs produced during lipid metabolism tended to decline in the TA group (compared to control, all ZTs), suggesting decreased availability. Acylcarnitines did not show consistent trends, although two acylcarnitines (palmitoylcarnitine and stearoylcarnitine) were elevated at ZT10 and decreased at ZT16 (TA versus control), which could suggest subtle changes in beta‐oxidative use. Diacylglycerols were decreased in the TA group (compared to control, ZT4, ZT16, and ZT22), with declines in monoacylglycerols (e.g., 1‐palmitoylglycerol) and glycerol in the TA group (compared to control, ZT16, and ZT22) suggestive of changes in triglyceride hydrolysis or availability. The dicarboxylate fatty acids adipate, pimelate, and azelate were also elevated in the TA group (compared to control, ZT4 and ZT10). Dicarboxylate fatty acids are produced by fatty acid omega‐oxidation, which can serve as a “rescue pathway” when beta‐oxidation is disrupted or overwhelmed. The related acylcarnitine conjugate adipoylcarnitine was also elevated in the TA group (compared to control, ZT4, and ZT16), consistent with increased use of omega‐oxidation. One study has suggested that chronic TA treatment down‐modulates genes involved in fatty acid beta‐oxidation, which could be consistent with increased omega‐oxidative use to support energetics.29
Future studies assessing metabolomic effects related to TA treatment in livers from CLOCK‐deficient mice could provide further evidence for a circadian contribution to disease. A similar assessment of effects related to changing circadian cycles, for example, those experienced by shift workers, could identify clinically relevant biomarkers for identifying risks to shift populations with hepatic disease.
Supporting information
Additional Supporting Information may be found at onlinelibrary.wiley.com/doi/10.1002/hep4.1075/suppinfo.
Supporting Information Figures.
Supporting Information Table 1.
Supporting Information Table 2.
Supporting Information Table 3.
Acknowledgment
We are grateful to Professor Kiyoshi Ichihara (Faculty of Health Sciences, Yamaguchi University Graduate School of Medicine, Ube, Japan) for his detailed statistical analysis. We also thank Ms. Mariko Yamada, Ms. Hiromi Kurose, Ms. Kumie Ota, and Ms. Risa Mochizuki for their technical assistance.
Potential conflict of interest: Nothing to report.
Supported by the Project Promoting the Research and Development (R&D) Center on Regenerative Medicine in Yamaguchi Prefecture and by a Grant‐in‐Aid for Challenging Exploratory Research (24659369) from the Japan Society for the Promotion of Science.
REFERENCES
- 1. Reppert SM, Weaver DR. Coordination of circadian timing in mammals. Nature 2002;418:935‐941. [DOI] [PubMed] [Google Scholar]
- 2. Yamazaki S, Numano R, Abe M, Hida A, Takahashi R, Ueda M, et al. Resetting central and peripheral circadian oscillators in transgenic rats. Science 2000;288:682‐685. [DOI] [PubMed] [Google Scholar]
- 3. Kondratova AA, Kondratov RV. The circadian clock and pathology of the ageing brain. Nat Rev Neurosci 2012;13:325‐335. [DOI] [PMC free article] [PubMed] [Google Scholar]
- 4. Blei AT, Zee P. Abnormalities of circadian rhythmicity in liver disease. J Hepatol 1998;29:832‐835. [DOI] [PubMed] [Google Scholar]
- 5. Cordoba J, Cabrera J, Lataif L, Penev P, Zee P, Blei AT. High prevalence of sleep disturbance in cirrhosis. Hepatology 1998;27:339‐345. [DOI] [PubMed] [Google Scholar]
- 6. Montagnese S, De Pitta C, De Rui M, Corrias M, Turco M, Merkel C, et al. Sleep–wake abnormalities in patients with cirrhosis. Hepatology 2014;59:705‐712. [DOI] [PubMed] [Google Scholar]
- 7. Miyamoto H, Nakamaru‐Ogiso E, Hamada K, Hensch TK. Serotonergic integration of circadian clock and ultradian sleep–wake cycles. J Neurosci 2012;32:14794‐14803. [DOI] [PMC free article] [PubMed] [Google Scholar]
- 8. Ichikawa T, Naota T, Miyaaki H, Miuma S, Isomoto H, Takeshima F, et al. Effect of an oral branched chain amino acid–enriched snack in cirrhotic patients with sleep disturbance. Hepatol Res 2010;40:971‐978. [DOI] [PubMed] [Google Scholar]
- 9. Tong X, Yin L. Circadian rhythms in liver physiology and liver diseases. Compr Physiol 2013;3:917‐940. [DOI] [PubMed] [Google Scholar]
- 10. Shin SY, Fauman EB, Petersen AK, Krumsiek J, Santos R, Huang J, et al. An atlas of genetic influences on human blood metabolites. Nat Genet 2014;46:543‐550. [DOI] [PMC free article] [PubMed] [Google Scholar]
- 11. Hughes ME, Hogenesch JB, Kornacker K. JTK_CYCLE: an efficient nonparametric algorithm for detecting rhythmic components in genome‐scale data sets. J Biol Rhythms 2010;25:372‐380. [DOI] [PMC free article] [PubMed] [Google Scholar]
- 12. Eckel‐Mahan KL, Patel VR, Mohney RP, Vignola KS, Baldi P, Sassone‐Corsi P. Coordination of the transcriptome and metabolome by the circadian clock. Proc Natl Acad Sci USA 2012;109:5541‐5546. [DOI] [PMC free article] [PubMed] [Google Scholar]
- 13. Fustin JM, Doi M, Yamada H, Komatsu R, Shimba S, Okamura H. Rhythmic nucleotide synthesis in the liver: temporal segregation of metabolites. Cell Rep 2012;1:341‐349. [DOI] [PubMed] [Google Scholar]
- 14. Hatori M, Vollmers C, Zarrinpar A, DiTacchio L, Bushong EA, Gill S, et al. Time‐restricted feeding without reducing caloric intake prevents metabolic diseases in mice fed a high‐fat diet. Cell Metab 2012;15:848‐860. [DOI] [PMC free article] [PubMed] [Google Scholar]
- 15. Kasahara T, Abe K, Mekada K, Yoshiki A, Kato T. Genetic variation of melatonin productivity in laboratory mice under domestication. Proc Natl Acad Sci USA 2010;107:6412‐6417. [DOI] [PMC free article] [PubMed] [Google Scholar]
- 16. Chen P, Kakan X, Zhang J. Altered circadian rhythm of the clock genes in fibrotic livers induced by carbon tetrachloride. FEBS Lett 2010;584:1597‐1601. [DOI] [PubMed] [Google Scholar]
- 17. Oishi K, Shirai H, Ishida N. PPARalpha is involved in photoentrainment of the circadian clock. Neuroreport 2008;19:487‐489. [DOI] [PubMed] [Google Scholar]
- 18. Filiano AN, Millender‐Swain T, Johnson R Jr, Young ME, Gamble KL, Bailey SM. Chronic ethanol consumption disrupts the core molecular clock and diurnal rhythms of metabolic genes in the liver without affecting the suprachiasmatic nucleus. PLoS One 2013;8:e71684. [DOI] [PMC free article] [PubMed] [Google Scholar]
- 19. Dakshayani KB, Subramanian P, Essa MM. Effect of melatonin on N‐nitrosodiethylamine‐induced hepatocarcinogenesis in rats with reference to biochemical circadian rhythms. Toxicol Mech Methods 2007;17:67‐75. [DOI] [PubMed] [Google Scholar]
- 20. Qin N, Yang F, Li A, Prifti E, Chen Y, Shao L, et al. Alterations of the human gut microbiome in liver cirrhosis. Nature 2014;513:59‐64. [DOI] [PubMed] [Google Scholar]
- 21. McNamara P, Seo SB, Rudic RD, Sehgal A, Chakravarti D, FitzGerald GA. Regulation of CLOCK and MOP4 by nuclear hormone receptors in the vasculature: a humoral mechanism to reset a peripheral clock. Cell 2001;105:877‐889. [DOI] [PubMed] [Google Scholar]
- 22. Sherman H, Gutman R, Chapnik N, Meylan J, le Coutre J, Froy O. All‐trans retinoic acid modifies the expression of clock and disease marker genes. J Nutr Biochem 2012;23:209‐217. [DOI] [PubMed] [Google Scholar]
- 23. Beaudry P, Hadengue A, Callebert J, Gaudin C, Soliman H, Moreau R, et al. Blood and plasma 5‐hydroxytryptamine levels in patients with cirrhosis. Hepatology 1994;20:800‐803. [DOI] [PubMed] [Google Scholar]
- 24. Namkung J, Kim H, Park S. Peripheral serotonin: a new player in systemic energy homeostasis. Mol Cells 2015;38:1023‐1028. [DOI] [PMC free article] [PubMed] [Google Scholar]
- 25. Jeong ES, Kim G, Shin HJ, Park SM, Oh JH, Kim YB, et al. Increased serum bile acid concentration following low‐dose chronic administration of thioacetamide in rats, as evidenced by metabolomic analysis. Toxicol Appl Pharmacol 2015;288:213‐222. [DOI] [PubMed] [Google Scholar]
- 26. Noshiro M, Usui E, Kawamoto T, Kubo H, Fujimoto K, Furukawa M, et al. Multiple mechanisms regulate circadian expression of the gene for cholesterol 7alpha‐hydroxylase (Cyp7a), a key enzyme in hepatic bile acid biosynthesis. J Biol Rhythms 2007;22:299‐311. [DOI] [PubMed] [Google Scholar]
- 27. Nishikawa T, Bellance N, Damm A, Bing H, Zhu Z, Handa K, et al. A switch in the source of ATP production and a loss in capacity to perform glycolysis are hallmarks of hepatocyte failure in advance liver disease. J Hepatol 2014;60:1203‐1211. [DOI] [PMC free article] [PubMed] [Google Scholar]
- 28. Metallo CM, Gameiro PA, Bell EL, Mattaini KR, Yang J, Hiller K, et al. Reductive glutamine metabolism by IDH1 mediates lipogenesis under hypoxia. Nature 2011;481:380‐384. [DOI] [PMC free article] [PubMed] [Google Scholar]
- 29. Low TY, Leow CK, Salto‐Tellez M, Chung MC. A proteomic analysis of thioacetamide‐induced hepatotoxicity and cirrhosis in rat livers. Proteomics 2004;4:3960‐3974. [DOI] [PubMed] [Google Scholar]
Associated Data
This section collects any data citations, data availability statements, or supplementary materials included in this article.
Supplementary Materials
Additional Supporting Information may be found at onlinelibrary.wiley.com/doi/10.1002/hep4.1075/suppinfo.
Supporting Information Figures.
Supporting Information Table 1.
Supporting Information Table 2.
Supporting Information Table 3.


