

Abstract
Liver fibrosis, a condition that is characterized by excessive production and accumulation of extracellular matrix, including collagen, is the most common outcome of chronic liver injuries of different etiologies. Vitamin A‐storing hepatic stellate cells (HSCs) are considered to be the main source of this collagen production, with activation in response to liver injury. In contrast, the contribution of other cell types to this fibrogenic response remains largely elusive due to the lack of specific surface markers to identify and isolate these cells for detailed analysis. Here, we identify a mesenchymal population of thymus cell antigen 1 (Thy1)+ CD45− cells (Thy1 MCs) in the mouse liver; these cells reside near the portal vein in vivo and indicate profibrogenic characteristics in vitro, shown by their expression of collagen and α‐smooth muscle actin. Flow cytometric analysis of mouse liver nonparenchymal cells revealed that vitamin A storage and Thy1 expression were mutually exclusive, indicating that Thy1 MCs are distinct from HSCs. Importantly, Thy1 MCs reacted and contributed to the development of liver fibrosis specifically in mouse models of cholestatic liver injury. With the occurrence of cholestatic liver injury, collagen‐producing Thy1 MCs expanded in cell number and inhibited collagen degradation through up‐regulation of matrix metalloproteinase inhibitor Timp1 expression, thereby promoting the accumulation of extracellular matrix in the periportal area. Conclusion: This study establishes Thy1 as a useful cell surface marker to prospectively identify and isolate periportal fibroblasts and further highlights a significant contribution of these cells to the pathogenesis of liver fibrosis caused by cholestatic liver injuries. We suggest that Thy1 MCs may be an interesting therapeutic target for treating liver fibrosis in addition to the well‐characterized HSCs. (Hepatology Communications 2017;1:198‐214)
Abbreviations
- α‐SMA
alpha smooth muscle actin
- APC
allophycocynanin
- BDL
bile duct ligation
- CCl4
carbon tetrachloride
- CK19
cytokeratin 19
- DDC
3,5‐diethoxycarbonyl‐1,4‐dihydrocollidine
- ECM
extracellular matrix
- EdU
5‐ethynyl‐2′‐deoxyuridine
- EpCAM
epithelial cell adhesion molecule
- GFAP
glial fibrillary acidic protein
- GFP
green fluorescent protein
- HSCs
hepatic stellate cells
- LECs
lymphatic endothelial cells
- NPCs
nonparenchymal cells
- NTPDase2
nucleoside triphosphate diphosphohydrolase‐2
- PDGFR
platelet‐derived growth factor receptor
- PFs
portal fibroblasts
- TAA
thioacetamide
- Thy1 MCs
Thy1‐expressing mesenchymal cells
- Thy1
thymus cell antigen 1
Introduction
The liver is renowned for its highly remarkable regenerative capacities and can compensate for injuries caused by various insults, such as viral infection, metabolic disorders, and chemical and toxic stresses. Liver injuries often result in the death and loss of parenchyma, or hepatocytes, where there is temporal compensatory synthesis of extracellular matrix (ECM), including collagen, to provide mechanical stability and a scaffold that is beneficial for hepatic regeneration. In acute liver injuries when the damage and fibrous stimuli subside, deposited collagen eventually dissolves, rendering the liver back to its normal state. However, in cases of chronic liver injuries where damage and fibrous stimuli persist, there is excessive production and decreased degradation of ECM, which together contribute to ECM accumulation that eventually leads to liver fibrosis and cirrhosis.1 This alters hepatic functions, hence causing organ failure and dysfunction.
Hepatic stellate cells (HSCs) are a mesenchymal‐type cell population within the liver and are well known to play a central role in collagen synthesis at the time of liver injury.2 Under normal conditions, HSCs serve as vitamin A‐storing cells that exhibit characteristics of pericytes existing in the space of Disse and line the hepatic sinusoid.3 They are thought to be quiescent in the normal state and become activated when the liver is injured, differentiating into fibrogenic myofibroblasts that are responsible for the synthesis and deposition of collagen in areas of damage.4 Hence, HSCs are regarded as myofibroblast precursors.
In addition to HSCs, other cell populations, including portal fibroblasts (PFs), bone marrow‐derived fibrocytes, and mesothelial cells, have been suggested as alternative sources of collagen in the injured liver.5, 6, 7, 8 Among these populations, PFs have been well documented to play a role as myofibroblast precursors, particularly in conditions of biliary fibrosis caused by cholestatic liver injury.9, 10 PFs are defined as a non‐HSC fibroblast population that can be found in the periportal mesenchyme surrounding the bile ducts; they are considered to be a heterogeneous population.11 However, studies on PFs have depended on isolation methods based on outgrowth from dissected bile segments,12 size selection,13 and purification of HSC marker‐negative, non‐HSC‐derived myofibroblasts by fluorescence‐activated cell sorting.14 None of these methods identify or isolate PFs by positive selection, thus hampering accurate evaluation of the cell population of interest. It is therefore of particular interest to establish a specific cell surface marker compatible with the identification and isolation of PFs.
In addition to the fibrotic responses that occur with chronic liver injury, there is also a possible putative stem/progenitor cell‐mediated regenerative response. This is achieved when the liver faces an intolerable level of damage where hepatocyte proliferation is hampered; a putative population of liver stem/progenitor cells is posited to become activated to repopulate the damaged tissue.15 Extensive efforts have been made to identify such a stem/progenitor cell population by searching for cell surface markers applicable for isolation and subsequent analysis. Among those markers, thymus cell antigen 1 (Thy1 or CD90) was reported as a marker for oval cells, i.e., adult liver stem/progenitor cells, in chronically injured rat liver.16 Thy1 is a glycosylphosphatidylinositol‐anchored cell surface protein and is widely used as a stem cell marker that is expressed in hematopoietic stem cells and mesenchymal stem cells. However, studies have revealed that Thy1 is not expressed in oval cells17, 18 but is instead a marker for cells that reside in close proximity to oval cells, constituting a “stem cell niche.”
We have reported that in mouse models of chronic liver injury, periportal Thy1‐expressing cells constitute the putative niche for liver stem/progenitor cells via paracrine signaling of fibroblast growth factor 7, thereby contributing to liver stem/progenitor cell‐mediated regeneration.18 It has also been described in rats that Thy1‐expressing cells in the stem cell niche compartment behave as activated mesenchymal–epithelial cells in vitro, presumably acting as progenitor cells themselves.19, 20 On the other hand, Thy1 has been reported to be a marker of liver myofibroblasts that reside near the portal vein.17, 21, 22 These reports identify a periportal mesenchymal population of Thy1‐expressing cells that could potentially be the equivalent of PFs, which lack a definitive marker for isolation and subsequent analysis. The use of Thy1 as a PF marker has not been precisely validated, nor is it understood as to whether and how Thy1‐expressing cells contribute to the pathogenesis of liver fibrosis in vivo.
In the present study, we aimed to characterize the periportal Thy1‐expressing cells in the mouse liver that play a role in the regenerative process following liver injury. We found that a leukocyte marker CD45‐negative subpopulation of Thy1‐expressing cells with characteristics of mesenchymal cells (Thy1 MCs) localized in the periportal area. This subpopulation displayed key characteristics of collagen‐producing myofibroblasts in vitro and in vivo while being distinct from the well‐established myofibroblast precursor HSCs. Our results elaborated on the usefulness of the surface antigen Thy1 as a marker to identify and isolate PFs and added Thy1 MCs as an alternative source of collagen deposition in the injured liver, specifically in cholestatic injury, thereby contributing to the pathogenesis of liver fibrosis in addition to conventional HSCs.
Materials and Methods
ANIMALS AND LIVER INJURY MODELS
Wild‐type C57BL/6J mice were purchased from CLEA Japan, Inc. Green fluorescent protein (GFP) transgenic mice were kindly provided by Dr. M. Okabe (Osaka University). All animals were maintained under specific pathogen‐free conditions. All animal experiments were conducted in accordance with the Guideline for the Care and Use of Laboratory Animals of the University of Tokyo under the approval of the Institutional Animal Care and Use Committee of the Institute of Molecular and Cellular Biosciences, the University of Tokyo (approval numbers 2501, 2501‐1, 2609, 2706, and 2804). For cholestatic liver injury models, mice were either fed a diet containing 0.1% 3,5‐diethoxycarbonyl‐1,4‐dihydrocollidine (DDC) (F‐4643; Bio‐Serv) or common bile duct ligation (BDL) was performed using standard techniques. For hepatotoxic liver injury models, mice were either injected with carbon tetrachloride (CCl4) (039‐01276; Wako; 1 mL/kg body weight dissolved in corn oil) intraperitoneally 2 times per week or thioacetamide (TAA) (204‐00881; Wako; 300 mg/L) was added to drinking water. The duration of each injury model is indicated in each figure.
CELL PREPARATION AND FLOW CYTOMETRY
A single‐cell suspension from the mouse liver was obtained by a two‐step collagenase perfusion method and used for preparing hepatocytes and nonparenchymal cells (NPCs) by centrifugal separation as described.23 Aliquots of cells were blocked with anti‐Fc receptor antibody, costained with fluorescence‐conjugated and/or biotin‐conjugated antibodies (listed in Supporting Table S1) and then incubated with allophycocyanin (APC)‐conjugated streptavidin (BD Biosciences) if necessary. We detected 5‐ethynyl‐2′‐deoxyuridine (EdU) by using the Click‐iT Plus EdU Alexa Fluor 488 Cytometry Assay Kit (Life Technologies), following the manufacturer's instructions. The samples were analyzed by FACSCanto II (BD Biosciences) or sorted by Moflo XDP (Beckman‐Coulter). Dead cells were excluded by propidium iodide staining. HSCs were identified based on the vitamin A autofluorescence signal detected by a violet laser at 405 nm. Data were analyzed using FlowJo software.
CELL CULTURE OF Thy1‐EXPRESSING CELLS AND HSCs
After incubation of NPCs with the biotin‐conjugated Thy1 antibody and followed by incubation with APC‐conjugated streptavidin, cells were resuspended in autoMACS Running Buffer (Miltenyi Biotech). The cell suspension was incubated with anti‐APC microbeads (Miltenyi Biotech). Conjugated cells were separated by the autoMACS Pro Separator (Miltenyi Biotech) using the positive selection‐sensitive protocol. Positively separated cells were suspended in modified standard medium (William's medium E containing 10% fetal bovine serum, 10 mM nicotinamide, 2 mM L‐glutamine, 0.2 mM ascorbic acid, 20 mM 4‐(2‐hydroxyethyl)‐1‐piperazine ethanesulfonic acid pH 7.5, 1 mM sodium pyruvate, 17.6 mM NaHCO3, 14 mM glucose, and 50 mg/mL gentamicin) and seeded on a cell culture dish. For HSC isolation, magnetic cell‐sorting negative cells were subjected to a density centrifugation containing 11% Histodenz (Sigma). Cells were incubated for 12 hours in 37°C with 5% CO2, and nonadhering cells were washed out. Media were changed every 2 to 3 days. For cell proliferation assays, EdU (5 μM) was added to the media at day 5 after primary isolation and the culture was continued for 72 hours, followed by flow cytometric analysis.
MOUSE IRRADIATION AND BONE MARROW TRANSPLANTATION
Bone marrow cells were prepared by flushing tibias and femurs of donor GFP transgenic mice with cold phosphate‐buffered saline; these cells were collected and subjected to hemolysis to eliminate red blood cells. Collected bone marrow cells were injected intravenously to recipient wild‐type mice, which had been pre‐exposed to a lethal dose of radiation of 9.5 Gy (M‐150WE; Softex). The bone marrow‐reconstituted mice were maintained for at least 1 month after transplantation before commencing the DDC diet. Peripheral blood was collected at the time of the experiment and was confirmed to be GFP positive (>80%).
STATISTICAL ANALYSIS
Data are expressed as the mean ± SEM. The results were assessed using a two‐tailed Student t test. Differences with a P value less than 0.05 were considered statistically significant.
Results
HEPATIC Thy1‐EXPRESSING CELLS CAN BE DIVIDED INTO TWO SUBPOPULATIONS
We previously reported that cells expressing Thy1 reside in close proximity to the bile ducts around the portal vein in the mouse liver under both normal and injured conditions.18 Given that Thy1 was originally identified as a thymocyte antigen and is known to be expressed on surfaces of various cell types, including fibroblasts and lymphocytes, in that report we separated Thy1‐expressing cells based on the expression of the leukocyte marker CD45 to distinguish between fibroblasts and lymphocytes; however, their detailed characteristics were not evaluated.
Flow cytometric analysis of NPCs collected from normal mouse liver revealed that Thy1‐expressing cells separated into two distinct subpopulations based on CD45 expression, namely, Thy1+ CD45+ leukocytes and Thy1+ CD45– mesenchymal cells (Fig. 1A). Thy1+ CD45+ leukocytes also co‐expressed CD3ε and the T cell receptor β chain, confirming that these cells were mostly T lymphocytes (Supporting Fig. S1A). To further characterize these two populations, we revisited the immunostaining analysis of Thy1‐expressing cells in normal mouse liver sections. In addition to Thy1, a marker for endothelial cells, CD31, was costained to identify the anatomic location of Thy1‐expressing cells. As previously reported, Thy1 staining was prominent around the portal vein and we confirmed weaker and scattered staining in the parenchyma as well (Fig. 1B). Magnified images showed that most Thy1‐expressing cells in the periportal region were elongated and planular, resembling fibroblasts. These periportal Thy1‐expressing cells also expressed desmin and the known PF markers elastin and nucleoside triphosphate diphosphohydrolase‐2 (NTPDase2) (Supporting Fig. S1B), thus defining them as Thy1 MCs. Vascular walls surrounding the portal vein were also positive for these markers. On the other hand, Thy1‐expressing cells in the parenchyma were round and spherical and existed within the luminal side of the endothelium, together implying their identity as leukocytes (Fig. 1C). We performed co‐immunostaining with CD45 and revealed that virtually all Thy1‐expressing cells in the parenchyma co‐expressed CD45 while most of the Thy1‐expressing cells in the periportal region did not (Fig. 1D). This demonstrated that T lymphocytes were distributed throughout the liver tissue while Thy1 MCs were exclusively localized in the periportal area and displayed characteristics of PFs, as shown by their expression of elastin and NTPDase2.
Figure 1.
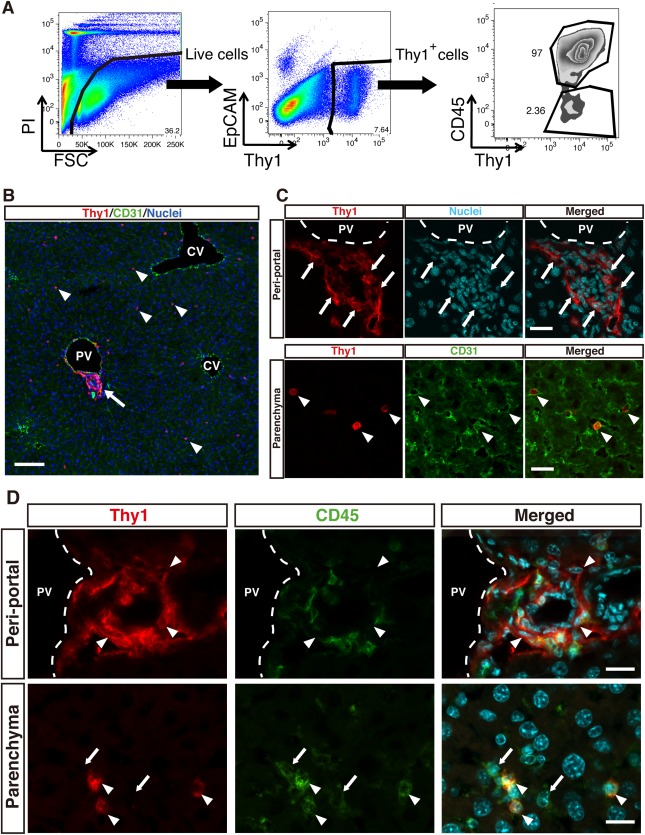
Distribution of two distinct Thy1‐expressing cells in normal mouse liver.
(A) Flow cytometric analysis of NPCs isolated from normal mouse liver. Dead cells were excluded by PI staining. Thy1‐expressing cells were subsequently gated out and could be divided into two distinct subpopulations of CD45+ Thy1+ cells and CD45– Thy1+ cells. A representative dot plot is shown. (B) Immunofluorescent staining of Thy1 (red) and CD31 (green) in a normal mouse liver section, demonstrating the anatomic distribution of two morphologically distinct Thy1‐expressing cells. Nuclei are shown in blue; scale bar = 50 μm. (C) High magnification images of periportal Thy1‐expressing cells (top panels) and Thy1‐expressing cells in the parenchyma (bottom panels). Arrows indicate elongated planular Thy1‐expressing cells residing near the portal vein. Arrowheads indicate round and spherical Thy1‐expressing cells distributed across the liver parenchyma. Nuclei are shown in cyan; scale bar = 20 μm. (D) Immunofluorescent staining of Thy1 (red) and CD45 (green) in a normal mouse liver section, with upper panels showing the periportal region and lower panels showing the parenchymal region. Arrowheads in top panels indicate CD45– periportal Thy1‐expressing cells. Arrows and arrowheads in lower panels indicate Thy1– CD45+ cells and Thy1+ CD45+ cells, respectively; scale bar = 20 μm. Abbreviations: CV, central vein; PI, propidium iodide; PV, portal vein.
CHARACTERIZATION OF Thy1‐EXPRESSING PERIPORTAL MESENCHYMAL CELLS
Thy1 has been suggested as a marker of portal (myo)fibroblasts, yet selective isolation and an in‐depth characterization of these Thy1‐expressing cells in mouse liver have not been performed.24 Thus, we aimed to evaluate the relationship of our Thy1 MCs to portal (myo)fibroblasts, taking advantage of Thy1 as a surface antigen. We first isolated Thy1+ cells as a whole from normal mouse liver NPCs by using a specific monoclonal antibody and magnetic‐activated cell sorting. We then seeded them on a culture dish, and nonadhering T lymphocytes were washed out after 12 hours of seeding. Five days after initial seeding, adhered cells were mostly Thy1+ CD45– and were proliferative (Supporting Fig. S2A), showing fibroblastic morphology as represented by a spindle‐like shaped body and extended processes (Fig. 2A). By 15 days after seeding, the cells progressively showed the morphology of activated myofibroblasts, represented by gradual spreading and flattening accompanied by the appearance of filamentous structures (Fig. 2B). By immunostaining, these cells were confirmed to express type I collagen and alpha smooth muscle actin (α‐SMA), which are representative characteristics of myofibroblasts (Fig. 2C). Quantitative gene expression analysis was performed to further represent their myofibroblastic characteristics (Fig. 2D). Expression of collagen gene type I (Col1a1) and collagen gene type III (Col3a1) gradually increased over a course of 3 weeks after initial culture, whereas expression of α‐SMA (Acta2) did not change across the indicated time points. The expression of Thy1 and Fgf7 were validated to assess that the isolated cells were the cells of interest.18 Additionally, these cells expressed vimentin (Vim), confirming their identity as mesenchymal cells.
Figure 2.
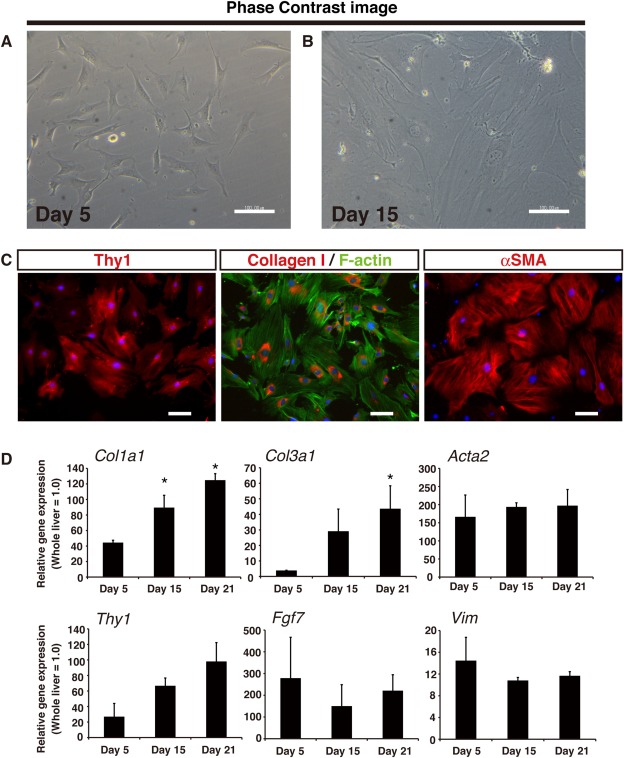
In vitro culture of Thy1‐expressing cells reveals myofibroblastic properties.
(A,B) Phase contrast images of cultured Thy1‐expressing cells at (A) 5 days or (B) 15 days after initial seeding; scale bars = 100 μm. (C) Immunostaining for Thy1 (red in the left panel), collagen type I (red in the middle panel), and α‐SMA (red in the right panel) of Thy1‐expressing cells cultured for 15 days. F‐actin staining by phalloidin (green in the middle panel) is shown to confirm cell size; scale bars = 100 μm. (D) Gene expression analysis by quantitative RT‐PCR analysis of cultured Thy1‐expressing cells at the indicated time points, n = 3 for each group. Error bars represent SEM. *P < 0.05 compared to Day 5. Abbreviation: RT‐PCR, reverse transcription polymerase chain reaction.
Thy1 MCs REPRESENT A DISTINCT CELL POPULATION FROM HSCs
Based on the myofibroblastic characteristics of Thy1 MCs following culture, we investigated the similarities and differences between Thy1 MCs and HSCs, the latter being the best characterized myofibroblast precursor population of the liver. We isolated Thy1 MCs as mentioned above from normal mouse liver, and HSCs were subsequently collected from the remaining NPC flow‐through by density‐gradient centrifugation owing to their abundance of retinoid‐storing lipid droplets.25 Isolated Thy1 MCs contained no apparent lipid droplets, which were characteristic of HSCs observed under the phase‐contrast microscope (Fig. 3A,B). Proliferation activity of cultured HSCs was significantly lower compared to that of Thy1 MCs (Supporting Fig. S2B). Flow cytometric analysis of NPCs of normal mouse liver revealed that vitamin A autofluorescence and Thy1 expression were mutually exclusive (Fig. 3C), thereby indicating that Thy1 MCs and HSCs are two distinctive myofibroblast precursor populations.
Figure 3.
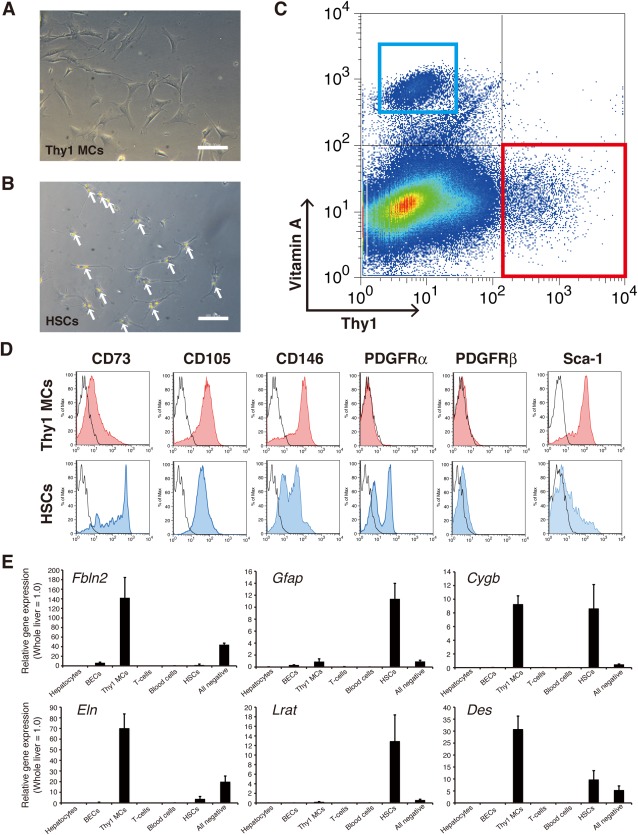
Thy1 MCs and HSCs are two distinct populations that are mutually exclusive.
(A,B) Phase contrast images of primary (A) Thy1 MCs and (B) HSCs cultured for 5 days after isolation. Arrows indicate vitamin A‐containing lipid droplets; scale bar = 100 μm. (C) Flow cytometry analysis of NPCs of normal mouse liver. CD45+ leukocytes were excluded from the analysis to directly compare vitamin A autofluorescence and Thy1 expression. Vitamin A‐storing HSCs are represented by the blue box, and Thy1 MCs are represented by the red box. A representative dot plot is shown. (D) Thy1 MCs and HSCs were further characterized by the expression of indicated surface markers by histogram plots. Red‐shaded lines indicate Thy1 MCs, and blue‐shaded lines indicate HSCs. Black lines indicate the isotype control of the corresponding cell types. (E) Gene expression profiling of signature genes. Hepatocytes, BECs (EpCAM+ Thy1– CD45–), Thy1 MCs (EpCAM– Thy1+ CD45–), T cells (EpCAM– Thy1+ CD45+), blood cells (EpCAM− Thy1– CD45+), HSCs (EpCAM– Thy1– CD45– Vitamin A+), and All negative (EpCAM− Thy1– CD45– Vitamin A–) cell fractions were isolated from enzymatically digested normal mouse liver of three independent isolations. Error bars represent SEM. Abbreviation: BECs, biliary epithelial cells.
We analyzed these two populations for several surface markers that are known to be expressed on mesenchymal and/or myofibroblastic cells (Fig. 3D). Expression of CD73 was weaker in Thy1 MCs compared to HSCs, while that of CD105 was comparable between the two populations. Expression of CD146 was confirmed in both Thy1 MCs and HSCs, despite variable levels of expression in HSCs. HSCs expressed PDGFRα and PDGFRβ, whereas Thy1 MCs did not. On the other hand, Thy1 MCs expressed Sca‐1, while its expression was low in HSCs. It is also noteworthy that HSCs apparently consisted of two subpopulations based on the expression of PDGFRα or CD146 (Fig. 3D).
We also performed gene expression profiling by quantitative reverse transcription polymerase chain reaction analysis within various cell populations that constitute the liver. Hepatocytes, biliary epithelial cells (epithelial cell adhesion molecule [EpCAM+]), Thy1 MCs (Thy1+ CD45−), T lymphocytes (Thy1+ CD45+), blood cells except T lymphocytes (Thy1− CD45+), and HSCs (vitamin A+) were isolated from normal mouse liver and evaluated for expression of reported signature genes of HSCs and PFs. Adequate cell isolation was confirmed by the specific expression of each marker (Supporting Fig. S3A). Expression of the PF markers elastin (Eln) and fibulin‐2 (Fbln2) was significantly enriched in Thy1 MCs, whereas the HSC markers lecithin retinol acyltransferase (Lrat) and glial fibrillary acidic protein (Gfap) were significantly expressed in HSCs. Interestingly, cytoglobin (Cygb) and desmin (Des), which are conventional markers employed in immunohistochemistry to define HSCs in liver sections, were expressed in both Thy1 MCs and HSCs (Fig. 3E). Additionally, the PF markers NTPDase2 (Entpd2) and type XV collagen26 (Col15a1) were significantly enriched in Thy1 MCs (Supporting Fig. S3A). NTPDase2 expression was also enriched in the biliary epithelial cell fraction, which was further confirmed at the protein level by co‐immunostaining of this marker with cytokeratin 19 (CK19) in liver sections (Supporting Fig. S3B). These results indicate that Thy1 MCs and HSCs are two distinct liver‐resident mesenchymal cell populations and suggest that Thy1 MCs are representative of the PF population.
CONTRIBUTION OF Thy1 MCs IN THE PATHOGENESIS OF FIBROSIS WITH LIVER INJURY
The observation above that Thy1 MCs and HSCs are two distinct myofibroblastic populations in the liver implicates their potential contribution to ECM synthesis when the liver is injured. To determine specific roles of these cells in vivo, we examined their nature in various mouse models of liver injury using freshly isolated cells. It has been suggested that the origin of hepatic myofibroblasts activated in response to chronic liver injury is dependent on the etiologies.14 In addition, Thy1‐expressing cells are reported to expand in response to the progression of liver injury.18, 19 Accordingly, we examined the expansion of Thy1‐expressing cells in chronic liver injury models of different etiologies using CCl4 treatment and TAA administration as toxic liver injury models and DDC‐induced injury and common BDL as cholestatic liver injury models. Immunodetection of Thy1 in liver sections of each chronic injury model revealed that the Thy1 staining area expanded significantly following DDC feeding and BDL while CCl4 injection and TAA administration resulted in little or no expansion (Fig. 4A,B). Co‐immunostaining of collagen type I and III in DDC‐injured liver revealed a massive accumulation of collagen in the periportal area, which resided in close proximity to expanding Thy1‐expressing cells (Supporting Fig. S4A). Additionally, some collagen accumulation in the liver parenchyma was also observed. Notably, Thy1‐expressing cells colocalized with both types of collagen in normal uninjured liver as well. In contrast, accumulation of collagen in TAA‐injured liver was observed in the pericentral region and separate from the Thy1‐expressing cells.
Figure 4.
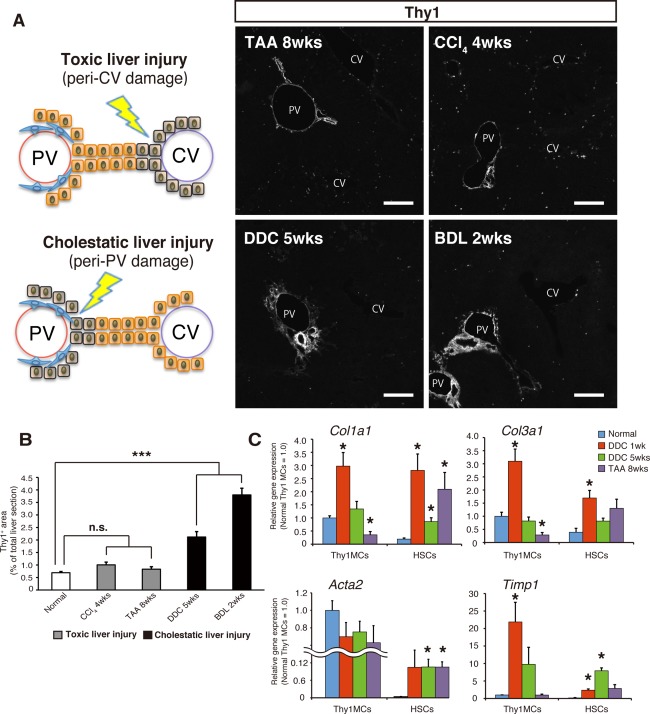
Thy1−expressing cells specifically respond to cholestatic liver injuries.
(A) Schematic image of parenchymal damage in toxic liver injuries (top left panel) and cholestatic liver injuries (bottom left panel). Immunostaining of Thy1 (gray scale) in each indicated liver damage condition. Representative images are shown; scale bar = 200 μm. (B) Quantification of the Thy1‐positive area in liver tissue sections of each indicated damage condition. The Thy1+ area is shown by (Thy1‐positive area/whole liver section area); n = 3 (independent mice) for each damage condition. (C) Gene expression analysis by quantitative RT‐PCR of Thy1 MCs and HSCs isolated from mice fed with a normal diet and normal water, mice fed with DDC for 1 week or 5 weeks, and mice administered with TAA drinking water for 8 weeks (n = 3 independent isolations). Error bars indicate SEM. *P < 0.05; ***P < 0.001 compared to the normal condition. Abbreviations: CV, central vein; PV, portal vein; RT‐PCR, reverse transcription polymerase chain reaction.
To further evaluate the contributions of Thy1 MCs and HSCs to the pathogenesis of fibrosis in liver injuries of different etiologies, we performed comparative gene expression analysis on specific liver cell populations isolated from normal mice and mice with liver injuries induced by the DDC diet or TAA administration. Expression of collagens was enriched in Thy1 MCs and HSCs compared to other populations (Supporting Fig. S4B), indicating that these two populations are the main collagen producers in normal and injured livers. Interestingly, the expression level of collagen genes in Thy1 MCs and HSCs was virtually comparable in DDC‐injured liver but was significantly higher in HSCs in TAA‐injured liver (Fig. 4C; Supporting Fig. S4B). In addition, HSCs showed a marked increase in the expression level of Col1a1, Col3a1, and Acta2 in both injury models compared to normal conditions, thus demonstrating their activation following liver injury regardless of their etiologies (Fig. 4C). In contrast, Thy1 MCs did not show any change in the expression level of either of the genes after 5 weeks of DDC administration and showed a decrease of Col1a1 and Col3a1 with TAA‐induced liver injury. Interestingly, the expression of Acta2 in Thy1 MCs did not significantly increase with liver injury but was already at high levels in normal livers. Accordingly, protein expression of α‐SMA was evident in periportal Thy1‐expressing cells and vascular walls of the portal vein in both normal and DDC‐injured livers (Supporting Fig. S5).
Given that portal fibroblasts may act as first responders in cholestatic liver injuries to produce collagen,27 we analyzed the expression of Col1a1 and Col3a1 after 1 week of DDC‐induced liver injury (Fig. 4C). Both Thy1 MCs and HSCs significantly increased the expression of these genes at this time point, thus promptly responding and contributing to fibrogenesis in the early phase of cholestatic liver injury and then gradually waning thereafter. Notably, the expression level of Timp1, an inhibitor of matrix metalloproteinase, was increased in both Thy1 MCs and HSCs during DDC‐induced liver injury but was exclusively increased in HSCs during TAA‐induced liver injury.
Gene expression changes of the PF markers were analyzed in Thy1 MCs and HSCs in normal and injured livers. The analysis validated that Thy1 was specifically expressed in Thy1 MCs but not in HSCs and that Thy1 MCs retain their identity as PFs after liver injury (Supporting Fig. S6A). These results suggest that Thy1 MCs are a representative population of PFs that contribute to the pathogenesis of liver fibrosis by means of rapid fibrogenesis and by inhibiting degradation of newly formed ECM, specifically during DDC‐induced cholestatic liver injury.
ORIGIN OF EXPANDING Thy1‐EXPRESSING CELLS IN CHOLESTATIC LIVER
While Thy1 MCs exclusively responded to and expanded upon cholestatic liver injury, it remains unclear whether these reactive Thy1 MCs are liver‐resident cells or of extrahepatic origin. We followed the expansion of Thy1‐expressing cells in the time course of DDC‐induced liver injury and found that these cells increased significantly within the initial 1‐2 weeks of feeding and seemed to be saturated thereafter (Supporting Fig. S7A). In order to assess whether resident Thy1‐expressing cells proliferated within this period, we administered the thymidine analog EdU in mice fed with the DDC diet (Fig. 5A). An immunostaining analysis of mouse liver sections revealed EdU incorporation in periportal Thy1‐expressing cells along with many other cells, such as biliary epithelial cells (Fig. 5B; Supporting Fig. S7C); only a minor level of EdU incorporation was observed in normal livers under uninjured conditions (Supporting Fig. S7B). This was further assessed by quantitative flow cytometric analysis where we confirmed that a significantly higher proportion of Thy1 MCs incorporated EdU following DDC‐induced liver injury (Fig. 5C). These results suggest that the expansion of Thy1‐expressing cells in cholestatic liver injury can be partly attributed to the proliferative reaction of resident cells.
Figure 5.
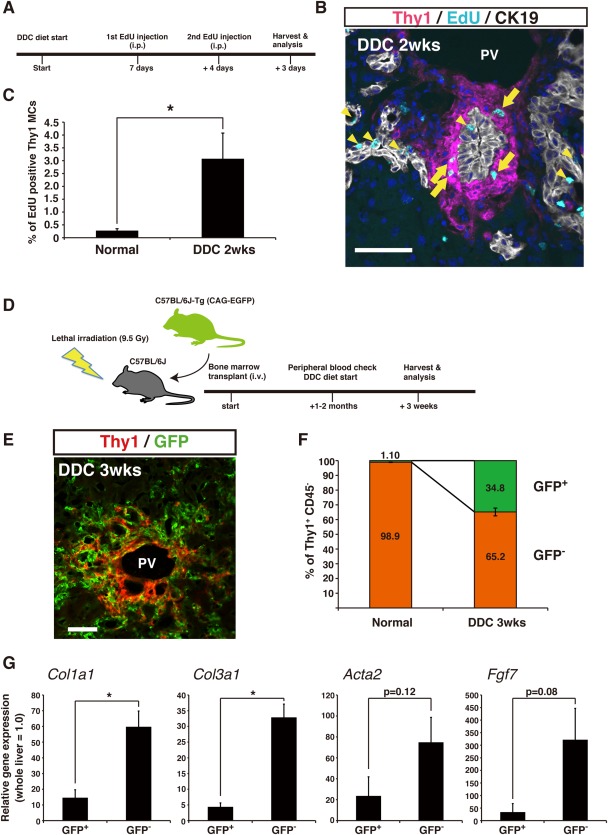
Both liver‐resident and bone marrow‐derived Thy1‐expressing cells contribute to their expansion in cholestatic liver injury. (A) Experimental scheme of EdU injection. Mice were injected with EdU (50 μg/g body weight) intraperitoneally at the indicated time points prior to analysis. (B) Fluorescent staining of Thy1 (magenta), CK19 (white), and EdU (cyan) in a DDC‐injured liver section. Arrows indicate EdU‐positive Thy1‐expressing cells. Arrowheads indicate EdU‐positive cells among the CK19+ biliary epithelial cells; nuclei are shown in blue; scale bar = 50 μm. (C) Quantification of EdU‐positive Thy1 MCs by flow cytometry in cells isolated from mice fed with either a normal or DDC diet; n = 3 for each condition. (D) Experimental scheme of whole bone marrow transplant. (E) Immunostaining of Thy1 (red) and GFP (green) in transplanted mice fed with DDC; scale bar = 50 μm. (F) Quantification of GFP‐positive and ‐negative Thy1 MCs by flow cytometry, in cells isolated from transplanted mice fed with either a normal or DDC diet; n = 3 for each condition. (G) Gene expression analysis by quantitative RT‐PCR of GFP+ Thy1+ CD45– and GFP– Thy1+ CD45– cells (n = 3 of independent isolations). Error bars indicate SEM. *P < 0.05. Abbreviations: PV, portal vein; RT‐PCR, reverse transcription polymerase chain reaction.
It has been documented that bone marrow‐derived fibrocytes infiltrate the liver following chronic injury and convert to collagen‐producing myofibroblasts.7 This led us to investigate the possible involvement of bone marrow cells as an extrahepatic origin of the expanded Thy1 MCs in our experimental settings. Whole bone marrow cells isolated from GFP‐transgenic mice were transplanted to lethally irradiated wild‐type mice for bone marrow reconstitution. The bone marrow‐reconstituted mice were subsequently fed the DDC diet and were analyzed for the presence of GFP+ cells in chronically injured liver (Fig. 5D). By immunofluorescent observation, we detected a massive infiltration of GFP+ cells surrounding the portal vein in DDC‐injured livers, some of which apparently co‐expressed Thy1 (Fig. 5E; Supporting Fig. S8A). Flow cytometric analyses focusing on the Thy1+ CD45– cell populations revealed that GFP+ cells were rarely found in that population under uninjured conditions in bone marrow‐reconstituted mice (1.10% ± 0.16%) but that there was a significant increase in GFP+ cells with DDC‐induced injury (34.8% ± 2.6%) (Fig. 5F). These results suggest that there are bone marrow‐derived Thy1‐expressing cells that are recruited into the liver at the time of DDC liver injury, which partly accounts for the increase and expansion of the periportal Thy1‐expressing cells in addition to proliferation of the resident cells.
To further characterize the nature of those bone marrow‐derived cells, we sorted Thy1+ CD45– cells based on the presence or absence of GFP fluorescence and analyzed for the expression of representative characteristic genes of Thy1 MCs. Surprisingly, GFP+ Thy1+ CD45− cells did not express significant levels of Fgf7, Col1a1, Col3a1, or Acta2 compared to GFP− Thy1+ CD45– cells (Fig. 5G). This indicated that bone marrow‐derived Thy1‐expressing cells do not contribute significantly to the fibrogenic reaction in cholestatic liver injury as collagen‐producing cells, despite their marked infiltration upon injury. On the other hand, expression of Timp1 was comparable between GFP+ cells and GFP– cells. Additionally, the expression of PF markers was analyzed and showed comparable expression of Eln between the two populations; in contrast, Fbln2 was exclusively expressed in GFP− cells (Supporting Fig. S8B). These results suggest that the proliferation and expansion of liver‐resident Thy1+ PFs make a predominant contribution to the fibrogenic reaction in the periportal region following cholestatic injury.
Discussion
In this study, we demonstrated that the surface antigen Thy1 stands as an effective and reliable marker to identify and isolate a representative population, if not all, of PFs. Traditionally, cell populations that constitute the liver have been identified and defined mainly by their morphology and anatomic location. Rigorous efforts on identifying cell specific markers, especially surface antigens, such as EpCAM for biliary epithelial cells23 and stabilin‐2 for liver sinusoidal endothelial cells,28 have enabled prospective isolation and an in‐depth analysis of liver cell populations. Nevertheless, PFs have lacked a specific cell surface antigen for selective isolation. Although Thy1 has been suggested, precise confirmation has not been empirically accomplished.
In the liver pathobiology, Thy1 was first characterized in rat liver as a marker for oval cells,16 and they were shown to expand in conditions of stem/progenitor cell‐mediated hepatic regeneration. However, these histological analyses were solely performed in serial sections, which did not allow accurate evaluation of cell markers. Dezso and colleagues17 revisited Thy1 as a marker for oval cells; they performed co‐immunostaining for Thy1 and CK19, a marker for oval cells, followed by confocal microscopic analysis. As a result, no colocalization of Thy1 and CK19 was observed; instead Thy1 was later readdressed as a marker for hepatic myofibroblasts, shown by colocalization with the myofibroblast marker α‐SMA.21 In addition to these previous studies done at the tissue level, we performed cellular level analysis by flow cytometry of NPCs collected from normal and injured mouse livers for their expression of Thy1 and EpCAM, a conventional marker for biliary epithelial cells and oval cells (Supporting Fig. S9A). Thy1 expression and EpCAM expression were mutually exclusive, thus supporting that Thy1 does not mark oval cells at the cellular level. However, the functions of these Thy1‐expressing cells have not been assessed in detail, and Thy1 has been applied conveniently as a cell marker for “portal myofibroblasts” without precise confirmation, particularly in mouse studies.
In the present study, detailed characterization of Thy1‐expressing cells in the mouse liver has shown that Thy1‐expressing mesenchymal cells in chronically injured liver constitute a myofibroblast population and contribute to collagen synthesis. Thy1‐expressing cells in the liver formed a heterogeneous population consisting of T lymphocytes and mesenchymal cells that could be distinguished based on the presence or absence of the expression of the leukocyte marker CD45 and showed distinct anatomic location in the liver tissue. Identification of Thy1‐expressing mesenchymal cells by surface markers Thy1 and CD45 allowed us to analyze their characteristics in detail through in vitro analysis following cell isolation and flow cytometry. As a result, we were able to demonstrate that Thy1‐expressing mesenchymal cells show characteristics of typical fibroblasts and collagen‐producing myofibroblasts following culture. This was particularly shown by the expression of α‐SMA and collagen types I and III at both the transcriptional and protein levels. In addition to their myofibroblastic activation, these cells had enriched expression of PF markers, such as Eln, Fbln2, Entpd2, and Col15a1. These results, together with their anatomic location around the portal vein, suggest that Thy1‐expressing mesenchymal cells represent a major part, if not all, of PFs. To date, identification of PFs has largely depended on staining of specific markers by immunohistochemical analysis, and these available markers were not applicable for selective isolation. Instead, their isolation has been achieved by outgrowth, size‐selection methods, and flow cytometry‐based exclusion methods. None of these methods identify PFs by positive selection. Here, the combinatorial use of the surface antigens Thy1 and CD45 has allowed us, for the first time, to identify a mesenchymal population that presumably represents PFs by means of positive selection. Importantly, Thy1 expression and vitamin A autofluorescence were mutually exclusive, thus indicating that Thy1 MCs and conventional HSCs are two clearly distinct myofibroblast precursor populations.
Hepatic fibrosis is the common outcome of many types of chronic liver diseases. While myofibroblasts play a critical role in the development of hepatic fibrosis, they are believed to originate from different cellular sources, depending on the etiologies. In mouse experimental models, chronic toxic liver injuries caused by CCl4 or TAA administration result in hepatocellular necrosis around the central vein, whereas cholestatic liver injuries caused by a DDC diet or BDL surgery result in injury of cholangiocytes in the portal region.29 Using these experimental liver injury models, it has been implied that fibrogenic myofibroblasts originate from HSCs in chronic toxic liver injuries but originate from PFs in cholestatic liver injuries.14, 30 The anatomic location of HSCs, which are in the space of Disse, and PFs, which are in the portal mesenchyme, seems compatible to the areas of injury in each experimental model. Nevertheless, the significance and the relative contribution of collagen synthesis and deposition by PFs compared to HSCs during liver injury remains largely controversial in that reports on HSC‐specific genetic labeling using Lrat‐driven or PDGFRβ‐driven Cre transgenic mice have suggested that HSCs contribute mainly to the pathogenesis of hepatic fibrosis, regardless of the etiologies.31, 32 This controversy can be attributed, at least in part, to the lack of specific markers to identify PFs to compare them directly with HSCs with respect to their contribution in collagen synthesis and deposition, both quantitatively and qualitatively. Previous studies identified PFs by negative selection, specifically the lack of vitamin A autofluorescence14 or of genetically labeled HSC markers.31 Because Thy1‐expressing mesenchymal cells represent PFs, gene expression changes of PF markers in normal and injured livers were assessed in Thy1 MC and HSC compartments and showed that specific expression of Thy1 and Fbln2 in Thy1 MCs and their absence in HSCs was maintained even after liver injury (Supporting Fig. S6A). Interestingly, HSCs showed significant induction of Eln expression in TAA‐injured liver and Col15a1 expression in DDC‐injured and TAA‐injured liver. Accordingly, we performed immunostaining of elastin and Thy1 in TAA‐injured liver and observed elastin expression in the parenchyma, separate from Thy1 MCs in the periportal region (Supporting Fig. S6B). Costaining of elastin and the HSC marker GFAP revealed a proximal localization of HSCs with elastin deposition in the parenchyma. It has been reported that elastin expression can be induced in activated HSCs during hepatotoxic liver injuries.33 The apparent induction of elastin and type XV collagen in HSCs following liver injury suggests the use of these molecules as PF markers is ambiguous under certain conditions. Given that the known PF marker NTPDase2 was also expressed in biliary epithelial cells (Supporting Fig. S3A,B), Thy1 and fibulin‐2 may stand as the most reliable markers for PFs because their expression pattern remains unchanged even in injured livers. We emphasize that Thy1 is a useful surface antigen marker for PFs due to its compatibility with the selective isolation of live cell populations. Taken together, the present study has clearly demonstrated that PFs represented by Thy1 MCs react exclusively in models of cholestatic liver injury and contribute to collagen synthesis in addition to conventional HSCs.
Our results showed that expression of fibrogenic genes in Thy1 MCs was relatively high even in normal livers compared to other cell populations and that Thy1 MCs showed noticeable deposition of collagen fibers around the portal vein. These results indicate that Thy1 MCs produce collagen fibers in physiological conditions even without fibrous stimuli of injured liver, presumably to maintain the structure of the portal triad and to contribute to the turnover of ECM in Glisson's capsule. In mouse models of cholestatic liver injury, ECM accumulation is observed in the periportal region along with the expansion of Thy1‐expressing cells. Surprisingly, expression of Col1a1, Col3a1, and Acta2 did not change significantly in Thy1 MCs between normal and DDC‐injured mice at 5 weeks. Although, as first responders of cholestatic liver injury, Thy1 MCs increased expression of Col1a1 and Col3a1 about 3‐fold at 1 week of DDC‐induced liver injury when compared to normal liver, expression of Timp1 was induced even more drastically (about 20‐fold compared to normal liver). This indicated that qualitative changes in Thy1 MCs accompanied predominant suppression of fibrolysis, rather than augmentation of fibrogenesis, during cholestatic liver injury, especially at an early time point, thus contributing to the accumulation of ECM in the periportal area. On the other hand, HSCs contribute to the pathogenesis of liver fibrosis by increasing production (fibrogenesis) and inhibiting degradation (fibrolysis) of ECM simultaneously in both DDC‐induced and TAA‐induced liver injury. HSCs were major contributors of the pathogenesis of liver fibrosis over Thy1‐expressing cells in models of toxic liver injury, consistent with other reports.34, 35 Therefore, we propose that Thy1 MCs, which represent PFs, contribute specifically to the pathogenesis of liver fibrosis in models of cholestatic liver injury whereas HSCs contribute to liver fibrosis in models of both cholestatic and toxic liver injury.
Bone marrow‐derived fibrocytes have been suggested to contribute to liver fibrosis upon infiltration of injured livers.7 In the current study, we elucidated that a significant portion of Thy1‐expressing mesenchymal cells are derived from the bone marrow following cholestatic liver injury. These bone marrow‐derived cells expressed fibrogenic genes, although at a significantly lower amount compared to liver‐resident Thy1‐expressing mesenchymal cells. Interestingly, the expression of Eln and Timp1 was comparable between the two populations, thus suggesting that these bone marrow‐derived cells account for a portion of PFs and may contribute to a fibrotic response following liver injury, at least in part, through suppression of fibrolysis. On the other hand, the lack of Fbln2 expression clearly distinguished the bone marrow‐derived cells from liver‐resident PFs. The exact identity and function of the former cells are yet to be determined, especially in view of their relationship to fibrocytes. Fibrocytes are defined as CD45+ collagen‐expressing cells derived from the bone marrow, whereas the population of interest in the current study is CD45–. The possibility that fibrocytes lose CD45 expression after infiltration in injured livers cannot be dismissed; however, we were not able to assess this due to the lack of appropriate tools for lineage tracing. Further characterizing this unique cell population is of significant interest and should be done in future studies.
The high expression of Acta2 in the Thy1 MC fraction suggests that vascular smooth muscle cells are included in or overlap with this cell population. In our analysis, periportal Thy1‐expressing cells stably expressed α‐SMA even at normal states, along with many other PF markers, such as elastin and NTPDase2. However, cells that line the vascular wall of the portal vein also express most, if not all, of the known PF markers18, 26 (Supporting Figs. S1B, S6B) and are the mesenchymal‐type cell population, thereby falling into the category of conventional PFs. Nevertheless, terms and definitions of “portal fibroblasts” and “vascular smooth muscle cells” are vague, and because of the significant overlap of marker expression, they may not be strictly distinguished in practice. Taken together, Thy1 MCs of the current study form a unique population that exclusively resides near the portal vein and shows a gene expression signature of both contractile and synthetic phenotypes, which is also a well‐known characteristic of vascular smooth muscle cells.
Thy1 has also been reported to be expressed in lymphatic endothelial cells (LECs) and mesothelial cells in the mouse liver.36 Gene expression analysis of Lyve1, an endothelial cell marker expressed in both LECs and sinusoidal endothelial cells, revealed its enrichment in the “all negative” compartment, which presumably contains LECs, sinusoidal endothelial cells, and other endothelial cells (Supporting Fig. S3A). In addition, there was minor but recognizable expression of Lyve1 in the Thy1 MC compartment. To assess the degree of contamination of LECs and mesothelial cells in our preparation of Thy1 MCs, we used flow cytometry to analyze the expression of podoplanin, a marker for both LECs and mesothelial cells reported in the same study.36 We found that 4.16% ± 1.32% (n = 4) of Thy1 MCs were found to express podoplanin (Supporting Fig. S9B). Consistently, gene expression analysis revealed that expression levels of mesothelial cell markers, mesothelin (Msln) and glycoprotein M6A (Gpm6a), in Thy1 MCs were remarkably lower (2.93% ± 1.06% and 3.30% ± 1.00%, respectively) compared to separately purified mesothelial cells (Supporting Fig. S9C). There have also been some studies suggesting bona fide expression of mesothelin in PFs.14 In contrast, the expression levels of fibrogenic markers Col1a1, Col3a1, and Acta2 in Thy1 MCs were notably higher (6.2‐fold, 2.4‐fold, and 21‐fold, respectively) compared to purified mesothelial cells. Taken together, we speculate that the Thy1 MC fraction in the present study may contain a minimal level of contamination with LECs and mesothelial cells (at most a few percent in the entire population), which should not significantly affect the main body of our conclusion on the role of PFs in the pathogenesis of fibrosis. Although the population of Thy1 MCs is highly enriched in PFs, application of the podoplanin negativity in combination with the Thy1+ CD45– fractionation in cell sorting may facilitate acquisition of a PF preparation with an even higher purity. Future prospects also include establishment of a more specific marker to identify PFs, possibly by single cell transcriptome analysis of the Thy1 MCs using a next generation sequencer to elucidate heterogeneity in this cell population.
Nevertheless, the analysis of Thy1‐expressing PFs allowed us to uncover the underestimated role of these cells as an augmentative contributor in ECM accumulation, in addition to conventional HSCs, during the pathogenesis of liver fibrosis in cholestatic liver injury. Whereas HSCs have been generally considered as the major contributor of ECM accumulation in fibrotic livers and thus have been the center of attention as a therapeutic target,37 the present study suggests that the cell types involved in the pathogenesis of liver fibrosis should vary according to its etiology. Thus, careful diagnosis to assess the pathology of liver fibrosis is required for effective targeting and prospective treatment.
Author names in bold designate shared co‐first authorship.
Supporting information
Additional Supporting Information may be found at onlinelibrary.wiley.com/doi/10.1002/hep4.1023/suppinfo.
Supporting Information Figure 1.
Supporting Information Figure 2.
Supporting Information Figure 4.
Supporting Information Figure 5.
Supporting Information Figure 6.
Supporting Information Figure 7.
Supporting Information Figure 8.
Supporting Information Figure 9.
Supporting Information
Acknowledgment
We thank K. Kamimoto for his insight to the Thy1 immunostaining, N. Miyata and C. Koga for cell sorting, N. Imaizumi for animal care, and the members of the Miyajima laboratory for helpful discussions and advice. We also thank The University of Tokyo IMCB Olympus Bioimaging Center (TOBIC) for help with microscopy and image acquisition. L.W.K. was supported by the Graduate Program for Leaders in Life Innovation (GPLLI), The University of Tokyo Life Innovation Leading Graduate School from MEXT, Japan.
Potential conflict of interest: Nothing to report.
Supported by the Japan Society for the Promotion of Science KAKENHI grants 22118006 (to A.M.), 24112507 (to T.I.), 24590342 (to T.I.), 26112704 (to T.I.), 26253023 (to A.M.), and 15H01369 (to T.I.); CREST from the Japan Science and Technology Agency (15652259; to A.M.); and a research grant from the Takeda Science Foundation (to T.I.)
REFERENCES
- 1. Arthur MJ. Fibrogenesis II. Metalloproteinases and their inhibitors in liver fibrosis. Am J Physiol Gastrointest Liver Physiol 2000;279:G245‐249. [DOI] [PubMed] [Google Scholar]
- 2. Friedman SL, Roll FJ, Boyles J, Bissell DM. Hepatic lipocytes: the principal collagen‐producing cells of normal rat liver. Proc Natl Acad USA 1985;82:8681‐8685. [DOI] [PMC free article] [PubMed] [Google Scholar]
- 3. Senoo H, Kojima N, Sato M. Vitamin A‐storing cells (stellate cells). Vitam Horm 2007;75: 131‐159. [DOI] [PubMed] [Google Scholar]
- 4. Troeger JS, Mederacke I, Gwak GY, Dapito DH, Mu X, Hsu CC, et al. Deactivation of hepatic stellate cells during liver fibrosis resolution in mice. Gastroenterology 2012;143:1073‐1083. [DOI] [PMC free article] [PubMed] [Google Scholar]
- 5. Seki E, Brenner DA. Recent advancement of molecular mechanisms of liver fibrosis. J Hepatobiliary Pancreat Sci 2015;22:512‐518. [DOI] [PMC free article] [PubMed] [Google Scholar]
- 6. Kinnman N, Francoz C, Barbu V, Wendum D, Rey C, Hultcrantz R, et al. The myofibroblastic conversion of peribiliary fibrogenic cells distinct from hepatic stellate cells is stimulated by platelet‐derived growth factor during liver fibrogenesis. Lab Invest 2003;83:163‐173. [DOI] [PubMed] [Google Scholar]
- 7. Kisseleva T, Uchinami H, Feirt N, Quintana‐Bustamante O, Segovia JC, Schwabe RF, et al. Bone marrow‐derived fibrocytes participate in pathogenesis of liver fibrosis. J Hepatol 2006;45:429‐438. [DOI] [PubMed] [Google Scholar]
- 8. Li Y, Wang J, Asahina K. Mesothelial cells give rise to hepatic stellate cells and myofibroblasts via mesothelial‐mesenchymal transition in liver injury. Pro Natl Acad Sci USA 2013;110:2324‐2329. [DOI] [PMC free article] [PubMed] [Google Scholar]
- 9. Beaussier M, Wendum D, Schiffer E, Dumont S, Rey C, Lienhart A, et al. Prominent contribution of portal mesenchymal cells to liver fibrosis in ischemic and obstructive cholestatic injuries. Lab Invest 2007;87:292‐303. [DOI] [PubMed] [Google Scholar]
- 10. Dranoff JA, Wells RG. Portal fibroblasts: Underappreciated mediators of biliary fibrosis. Hepatology 2010;51:1438‐1444. [DOI] [PMC free article] [PubMed] [Google Scholar]
- 11. Wells RG. The portal fibroblast: not just a poor man's stellate cell. Gastroenterology 2014;147(1):41‐47. [DOI] [PMC free article] [PubMed] [Google Scholar]
- 12. Uchio K, Tuchweber B, Manabe N, Gabbiani G, Rosenbaum J, Desmoulière A. Cellular retinol‐binding protein‐1 expression and modulation during in vivo and in vitro myofibroblastic differentiation of rat hepatic stellate cells and portal fibroblasts. Lab Invest 2002;82(5):619‐628. [DOI] [PubMed] [Google Scholar]
- 13. Wen JW, Olsen AL, Perepelyuk M, Wells RG. Isolation of rat portal fibroblasts by in situ liver perfusion. J Vis Exp 2012;(64):pii:3669. [DOI] [PMC free article] [PubMed] [Google Scholar]
- 14. Iwaisako K, Jiang C, Zhang M, Cong M, Moore‐Morris TJ, Park TJ, et al. Origin of myofibroblasts in the fibrotic liver in mice. Proc Natl Acad Sci USA 2014;111:E3297‐3305. [DOI] [PMC free article] [PubMed] [Google Scholar]
- 15. Miyajima A, Tanaka M, Itoh T. Stem/progenitor cells in liver development, homeostasis, regeneration, and reprogramming. Cell Stem Cell 2014;14:561‐574. [DOI] [PubMed] [Google Scholar]
- 16. Petersen BE, Goff JP, Greenberger JS, Michalopoulos GK. Hepatic oval cells express the hematopoietic stem cell marker Thy‐1 in the rat. Hepatology 1998;27:433‐445. [DOI] [PubMed] [Google Scholar]
- 17. Dezso K, Jelnes P, Laszlo V, Baghy K, Bödör C, Paku S, et al. Thy‐1 is expressed in hepatic myofibroblasts and not oval cells in stem cell‐mediated liver regeneration. Am J Pathol 2007;171:1529‐1537. [DOI] [PMC free article] [PubMed] [Google Scholar]
- 18. Takase HM, Itoh T, Ino S, Wang T, Koji T, Akira S, et al. FGF7 is a functional niche signal required for stimulation of adult liver progenitor cells that support liver regeneration. Genes Dev 2013;27:169‐181. [DOI] [PMC free article] [PubMed] [Google Scholar]
- 19. Yovchev MI, Zhang J, Neufeld DS, Grozdanov PN, Dabeva MD. Thymus cell antigen‐1‐expressing cells in the oval cell compartment. Hepatology 2009;50:601‐611. [DOI] [PubMed] [Google Scholar]
- 20. Liu D, Yovchev MI, Zhang J, Alfieri AA, Tchaikovskaya T, Laconi E, et al. Identification and characterization of mesenchymal‐epithelial progenitor‐like cells in normal and injured rat liver. Am J Pathol 2015;185:110‐128. [DOI] [PMC free article] [PubMed] [Google Scholar]
- 21. Dudas J, Mansuroglu T, Batusic D, Saile B, Ramadori G. Thy‐1 is an in vivo and in vitro marker of liver myofibroblasts. Cell Tissue Res 2007;329:503‐514. [DOI] [PubMed] [Google Scholar]
- 22. Dudas J, Mansuroglu T, Batusic D, Ramadori G. Thy‐1 is expressed in myofibroblasts but not found in hepatic stellate cells following liver injury. Histochem Cell Biol 2009;131:115‐127. [DOI] [PubMed] [Google Scholar]
- 23. Okabe M, Tsukahara Y, Tanaka M, Suzuki K, Saito S, Kamiya Y, et al. Potential hepatic stem cells reside in EpCAM+ cells of normal and injured mouse liver. Development 2009;136:1951‐1960. [DOI] [PubMed] [Google Scholar]
- 24. Wells RG, Schwabe RF. Origin and function of myofibroblasts in the liver. Semin Liver Dis 2015;35:97‐106. [DOI] [PubMed] [Google Scholar]
- 25. Mederacke I, Dapito DH, Affo S, Uchinami H, Schwabe RF. High‐yield and high‐purity isolation of hepatic stellate cells from normal and fibrotic mouse livers. Nat Protoc 2015;10:305‐315. [DOI] [PMC free article] [PubMed] [Google Scholar]
- 26. Lemoinne S, Cadoret A, Rautou PE, El Mourabit H, Ratziu V, Corpechot C, et al. Portal myofibroblasts promote vascular remodeling underlying cirrhosis formation through the release of microparticles. Hepatology 2015;61:1041‐1055. [DOI] [PubMed] [Google Scholar]
- 27. Kinnman N, Housset C. Peribiliary myofibroblasts in biliary type liver fibrosis. Front Biosci 2002;7:d496‐503. [DOI] [PubMed] [Google Scholar]
- 28. Nonaka H, Sugano S, Miyajima A. Serial analysis of gene expression in sinusoidal endothelial cells from normal and injured mouse liver. Biochem Biophys Res Commun 2004;324:15‐24. [DOI] [PubMed] [Google Scholar]
- 29. Liedtke C, Luedde T, Sauerbruch T, Scholten D, Streetz K, Tacke F, et al. Experimental liver fibrosis research: update on animal models, legal issues and translational aspects. Fibrogenesis Tissue Repair 2013;6:19. [DOI] [PMC free article] [PubMed] [Google Scholar]
- 30. Bataler R, Brenner DA. Liver fibrosis. J Clin Invest 2005;115:209‐218. [DOI] [PMC free article] [PubMed] [Google Scholar]
- 31. Mederacke I, Hsu CC, Troeger Js, Huebener P, Mu X, Dapito DH, et al. Fate tracing reveals hepatic stellate cells as dominant contributors to liver fibrosis independent of its aetiology. Nat Commun 2013;4:2823. [DOI] [PMC free article] [PubMed] [Google Scholar]
- 32. Henderson NC, Arnold TD, Katamura Y, Giacomini MM, Rodriguez JD, McCarty JH, et al. Targeting of αv integrin identifies a core molecular pathway that regulates fibrosis in several organs. Nat Med 2013;19:1617‐1624. [DOI] [PMC free article] [PubMed] [Google Scholar]
- 33. Kanta J, Dooley S, Delvoux B, Breuer S, D'Amico T, Gressner AM. Tropoelastin expression is up‐regulated during activation of hepatic stellate cells and in the livers of CCl(4)‐cirrotic rats. Liver 2002;22:220‐227. [DOI] [PubMed] [Google Scholar]
- 34. Tennakoon AH, Izawa T, Wijesundera KK, Murakami H, Katou‐Ichikawa C, Tanaka M, et al. Immunohistochemical characterization of glial fibrillary acidic protein (GFAP)‐expressing cells in a rat liver cirrhosis model induced by repeated injections of thioacetamide (TAA). Exp Toxicol Pathol 2015;67:53‐63. [DOI] [PubMed] [Google Scholar]
- 35. Friedman SL. Evolving challenges in hepatic fibrosis. Nat Rev Gastroenterol Hepatol 2010;7:425‐436. [DOI] [PubMed] [Google Scholar]
- 36. Lua I, Li Y, Zagory JA, Wang KS, French SW, Sévigny J, et al. Characterization of hepatic stellate cells, portal fibroblasts, and mesothelial cells in normal and fibrotic livers. J Hepatol 2016;64:1137‐1146. [DOI] [PMC free article] [PubMed] [Google Scholar]
- 37. Wu J, Zern MA. Hepatic stellate cells: a target for the treatment of liver fibrosis. J Gastroenterol 2000;35:665‐672. [DOI] [PubMed] [Google Scholar]
Associated Data
This section collects any data citations, data availability statements, or supplementary materials included in this article.
Supplementary Materials
Additional Supporting Information may be found at onlinelibrary.wiley.com/doi/10.1002/hep4.1023/suppinfo.
Supporting Information Figure 1.
Supporting Information Figure 2.
Supporting Information Figure 4.
Supporting Information Figure 5.
Supporting Information Figure 6.
Supporting Information Figure 7.
Supporting Information Figure 8.
Supporting Information Figure 9.
Supporting Information