Abstract
Mammalian partial hepatectomy (PH) induces an orchestrated compensatory hyperplasia, or regeneration, in remaining tissue to restore liver mass; during this process, liver functions are maintained. We probed this process in mice with feeding‐ and light/dark‐entrained animals subjected to sham or PH surgery. Early on (i.e., 10 hours), irrespective of sham or PH surgery, hepatocytes equidistant from the portal and central veins (i.e., midlobular) accumulated the G1‐phase cell‐division‐cycle marker cyclin D1. By 24 hours, however, cyclin D1 disappeared absent PH but was reinforced in midlobular hepatocytes after PH. At 48 hours after PH and 2 hours fasting, synchronously mitotic hepatocytes possessed less glycogen than surrounding nonproliferating hepatocytes. The differential glycogen content generated a conspicuous entangled pattern of proliferating midlobular and nonproliferating periportal and pericentral hepatocytes. The nonproliferating hepatocytes maintained aspects of normal liver properties. Conclusion: In the post‐PH regenerating mouse liver, a binary switch segregates midlobular cells to proliferate side‐by‐side with nonproliferating periportal and pericentral cells, which maintain metabolic functions. Our results also indicate that mechanisms of liver regeneration display evolutionary flexibility. (Hepatology Communications 2017;1:871–885)
Abbreviations
- ChIP‐Seq
chromatin‐immunoprecipitation and ultra‐high‐throughput DNA‐sequencing
- CV
central vein
- Cyc
cyclin
- GS
glutamine synthetase
- H&E
hematoxylin and eosin
- H3S10P
histone H3 serine 10 phosphorylation
- HNF4α
hepatocyte nuclear factor 4 alpha
- PAS
periodic acid‐Schiff
- p‐CDK1
phosphorylated cyclin dependent kinase‐1
- PCNA
proliferating cell nuclear antigen
- PH
partial hepatectomy
- Pol II
RNA polymerase II
- PV
portal vein
- RNA‐Seq
high‐throughput RNA‐sequencing
- ZT
Zeitgeber time
Introduction
The mammalian liver performs a diverse array of essential functions, including metabolic homeostasis (e.g., glucose and lipid), detoxification, production of bile and serum proteins (e.g., albumin, clotting factors, and hormones), and storage of vitamins and carbohydrate (e.g., glycogen). While providing such numerous functions, the liver also displays a remarkable plasticity, including compensatory hyperplasia (or regeneration) on toxin‐mediated injury or resection. For example, after 70% surgical resection of the liver, i.e., partial hepatectomy (PH), the remaining tissue is able to maintain liver functions while simultaneously replacing the lost liver mass within a few weeks (reviewed in Fausto et al.,1 Michalopoulos,2, 3 and Michalopoulos and DeFrances4). Combined with accessible genetic engineering, mouse liver regeneration, which is the specific subject of this study, is an attractive model to study induced cell proliferation in a natural context.
The mouse liver, as is the case generally in mammals, is a relatively homogeneous organ. It consists largely of parenchymal hepatocytes organized in a characteristic lobular structure into which oxygenated blood from the heart and nutrient‐rich blood from the intestine enter through the parallel hepatic artery and portal vein (PV), respectively. The blood then flows through sinuses past hepatocytes exchanging metabolites and toxins before reaching the central vein (CV) and exiting the liver.
Based on their position relative to the PV and CV, hepatocytes are broadly classified as (i) periportal or (ii) pericentral, separated by (iii) midlobular hepatocytes. These distinctive positions within the lobule generate zones of hepatocytes that perform different metabolic functions. As examples, lipid β‐oxidation, urea and cholesterol biosynthesis, and gluconeogenesis are favored in periportal hepatocytes and glutamine and bile acid synthesis, and glycolysis are favored in pericentral hepatocytes.5, 6, 7, 8
Spatial position also influences proliferative responses. Thus, in a natural homeostatic process, mouse pericentral cells, in response to local Wnt signaling, slowly proliferate (14‐day cycling period), such that up to 40% of hepatocytes are replaced within 1 year.9 However, in response to CCl4 injury of pericentral hepatocytes, a specialized subpopulation of periportal hepatocytes, displaying both biliary and hepatocyte features, replenish lost hepatocytes within about 12 weeks.10
In contrast to these homeostatic and localized injury responses, cells in healthy tissue after mouse PH (the tissue remaining after resection) respond to the loss of distal cells by rapid and synchronous de novo proliferation of many healthy hepatocytes.1, 11 Which specific mouse hepatocytes, however, respond to PH to maintain metabolic functions and/or to proliferate remains an open question.2, 12, 13
Here, we show that it is predominantly midlobular hepatocytes that first enter the cell‐division cycle in response to PH and that they display a segregated metabolic status from nonproliferating hepatocytes, as evidenced by differences in glycogen content after a brief fasting 48 hours after PH. This pattern of mouse hepatocyte cell‐division‐cycle entry differs markedly from that observed in rats,14, 15, 16 revealing evolutionary flexibility in this important regenerative process.
Materials and Methods
MICE
All experimental studies were performed in compliance with the European Union and national legislation rules as advised by the Lemanic Animal Facility Network (Resal), concerning ethical considerations of transportation, housing, strain maintenance, breeding, and experimental use of animals. We purchased 8‐9‐week‐old male C57BL/6 mice from Charles River Laboratories International, Inc. and used these for PH or sham surgery at 12‐14 weeks old. Mice were housed four to five per cage at 23 °C with a Zeitgeber Time (ZT)0‐ZT12‐light/ZT12‐ZT24‐dark ad libitum food‐access cycle for 2 weeks before food entrainment.
FOOD AND LIGHT ENTRAINMENT, SURGERY, AND LIVER COLLECTION
Prior to surgery, mice were entrained for 2 weeks on a ZT0‐ZT12‐light fasting/ZT12‐ZT24‐dark ad libitum food‐access regimen before being subjected to 70% PH or sham surgery under isoflurane anesthesia, as described,17 at ZT2. Food and light entrainment continued after surgery until being killed by cervical dislocation at the time points indicated in Fig. 1. As evidence of little to no untoward injury to the liver or mice, we did not observe any significant accumulation of macrophages or evident damage, like fibrosis (data not shown), and in the entire study only one mouse (not included) died prior to scheduled sacrifice owing to the surgery. Immediately prior to collection, livers were perfused with 5 mL of 1 times phosphate‐buffered saline through the spleen and subsequently used for immunohistochemistry/histology and immunoblotting.
Figure 1.
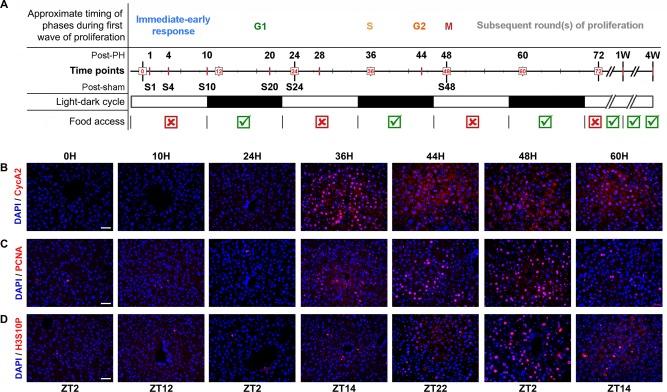
Scheme for mouse liver regeneration analysis and examples of proliferation‐marker levels through post‐PH compensatory hyperplasia. (A) Cell‐division cycle progress in a rainbow‐color scheme determined from cell‐cycle marker analyses summarized in Supporting Fig. S6 is shown. The time line (red) and time points (black) established for collecting post‐PH (n = 3/time point) and post‐sham (bearing prefix S; n = 3/time point) surgery samples are indicated from 0 until 72 hours and 1 (1W) and 4 (4W) weeks. Below the time points, the 12‐hour‐light (white)/dark (black) and feeding (green ticks)/fasting (red crosses) entrainment regime is shown. (B‐D) Immunofluorescence analysis of paraffin‐embedded sections of livers at different time points after PH. All sections were stained with DAPI (blue) together with antibodies against (B) the G1/S‐to‐M phase marker CycA2 (red), (C) S‐phase marker PCNA (red), and (D) prominent mitotic marker H3S10P (red). Corresponding ZT are denoted at the bottom. Scale bar, 50 μm for all. Abbreviation: DAPI, 4´,6‐diamidino‐2‐phenylindole.
TISSUE IMMUNOHISTOCHEMISTRY AND HISTOLOGY
For fluorescence and diaminobenzidine immunostaining as well as colorations (hematoxylin and eosin [H&E],18 periodic acid–Schiff staining [PAS]), the liver tissues were sectioned into 4‐μm‐thick paraffin sections and incubated overnight with the respective primary antibodies. Additional details about methods and antibodies are provided in the Supporting Information.
IMMUNOBLOTTING
Freshly isolated 100 mg of liver tissue was homogenized in radio immunoprecipitation assay buffer, and protein concentrations were determined. Additional details about methods and antibodies are provided in the Supporting Information.
CHROMATIN‐IMMUNOPRECIPITATION SEQUENCING AND RNA SEQUENCING ANALYSES
The chromatin‐immunoprecipitation followed by ultra‐high‐throughput DNA sequencing (ChIP‐Seq) and high‐throughput RNA‐sequencing (RNA‐Seq) of poly(A)‐selected RNA analyses were performed as described (Rib L, Villeneuve D, Praz V, Hernandez N, Guex N, Herr W, manuscript in preparation).
QUANTITATION AND STATISTICAL ANALYSES
For each analysis, all cells in a representative field of 4‐µm‐thick paraffin sections were counted. The Student t test was performed by using the R package (https://www.r-project.org/).
DATA AVAILABILITY
The data supporting the findings of this study are available within the paper and in its Supporting Information files.
Results
We initiated these studies of cell proliferation in response to PH in the context of a multifaceted program project study of three cycles of gene expression (circadian, nutrient response, and cell division) in the mouse liver.18, 19, 20 To combine the cell‐division studies using PH with the circadian and nutrient‐response studies, all mice were entrained with 12‐hour‐light fasting and 12‐hour‐dark feeding cycles. Thus, prior to PH, 12‐14‐week‐old mice had been first entrained for 2 weeks on 12‐hour ZT0‐ZT12‐light/12‐hour ZT12‐ZT24‐dark cycles to fix the circadian clock, followed by a further 2‐week entrainment with ZT0‐ZT12‐light fasting/ZT12‐ZT24‐dark feeding cycles, to entrain both the circadian and nutrient‐response cycles. Given that prior studies of PH‐induced rodent liver regeneration had not used such a light‐ and feeding‐entrainment protocol, the studies described here were initiated to characterize the PH‐induced liver regeneration response under such entrainment conditions.
The 70% PH‐induced liver regeneration schedule that we developed is shown in Fig. 1. PH was performed as described17 at ZT2, and livers were collected at 0, 1, 4, 10, 20, 24, 28, 36, 44, 48, 60, and 72 hours and at 1 and 4 weeks after surgery. Additionally, to monitor the contribution of the surgical intervention other than liver resection, we performed a series of “sham” surgeries (labeled S in Fig. 1), which included all procedures except the liver resection for the time points at 1, 4, 10, 20, 24, and 48 hours (Fig. 1).
The liver‐regeneration response to PH in rats and to a lesser extent in mice has been extensively studied.2, 3, 4, 12, 21, 22, 23, 24 Consistent with prior studies, (i) sham‐operated mice displayed a transient decrease in liver‐to‐body ratio; (ii) PH mice reconstituted the original liver‐to‐body weight ratio by 4 weeks (Supporting Fig. S1); (iii) H&E staining (Supporting Fig. S2) revealed little cell death but did reveal periodic increases in a staining pattern that probably reflects fat droplets, as described in detail25; (iv) by 4 weeks, a normal tissue morphology was evident; and (v) the ratio of mononucleated‐to‐binucleated hepatocytes changed 3‐fold (from 2:1 to 6:1) during the course of regeneration26 (Supporting Fig. S3).
TEMPORAL CHANGES IN ABUNDANCE OF CELL‐DIVISION‐CYCLE MARKERS AFTER 70% PH
To characterize the course of cell‐cycle progression after PH, we investigated the oscillations of characteristic cell‐cycle markers in individual cells by immunofluorescence. Staining for the S through M marker cyclin (Cyc)A2, the S‐phase marker proliferating cell nuclear antigen (PCNA), and the prominent condensed chromosome mitotic marker histone H3 serine 10 phosphorylation (H3S10P), a mark also found during interphase on noncondensed chromosomes, are shown in Fig. 1.27 CycA2 staining peaked at 36 hours (Fig. 2B), PCNA at 44‐48 hours (Fig. 2C), and H3S10P at 48 hours (Fig. 2D) after PH. Quantitation for PCNA and H3S10P as well as the cell‐proliferation marker Ki67 is shown in Supporting Fig. S4. Consistent with a lack of cell‐proliferation response, the sham‐surgery livers did not exhibit staining for the PCNA and Ki67 cell‐cycle markers at 48 hours (see Supporting Fig. S4).
Figure 2.
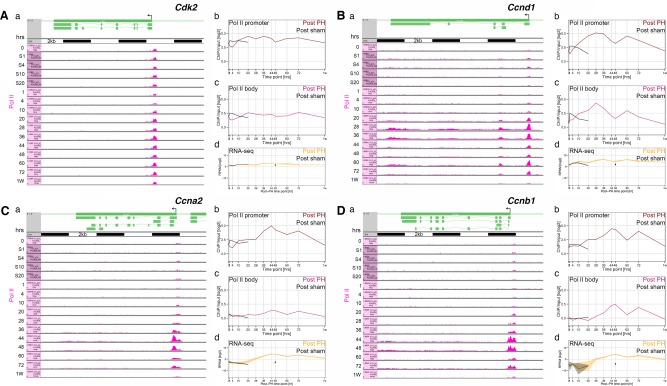
Pol II occupancy on four cell‐cycle regulatory genes indicates robust entry into and synchrony of the cell‐division cycle after PH. (A‐D) Pol II occupancy (a; pink) on transcription units of (A) Cdk2, (B) Ccnd1, (C) Ccna2, and (D) Ccnb1 revealed by ChIP‐Seq (Rib L, Villeneuve D, Praz V, Hernandez N, Guex N, Herr W, manuscript in preparation) and corresponding quantifications of (b) promoter‐bound Pol II (Pol II promoter) and (c) Pol II within the gene body (Pol II body), together with (d) their corresponding transcript levels revealed by RNA‐Seq (Rib L, Villeneuve D, Praz V, Hernandez N, Guex N, Herr W, manuscript in preparation) of the indicated PH (Post PH) and sham‐operated (Post sham) time points. The transcriptional start site is indicated by an arrow. Black bars in panel a equal 2 Kb. Abbreviation: RPKM, reads per kilobase million.
The G1 marker CycD1 and G2/M marker phosphorylated cyclin dependent kinase‐1 (p‐CDK1) were also analyzed by immunohistochemistry (data not shown; see below), and we measured by immunoblotting the abundance of CycD1, PCNA, H3S10P, and p‐CDK1, together with that of β‐catenin, a marker that does not vary in abundance through the cell‐division cycle (Supporting Fig. S5).
The integrated results of the immunostaining and immunoblotting analyses of the six cell‐cycle markers are summarized in Supporting Fig. S6. The pattern of all the observed cell‐cycle markers is consistent with synchronous cell‐division‐cycle progression in those cells that proliferate first after PH, with G1 phase beginning by 10 hours (CycD1 synthesis), a peak of S phase at 36 hours (maximal CycA2), and G2/M phase at 44‐48 hours (maximal Ki67, H3S10P, and p‐CDK1). The timing of hepatocyte division after PH is controlled by the circadian cycle; the M‐phase timing at 48 hours that we observed is consistent with PH at ZT2 of circadian entrained mice.11
ROBUST SYNCHRONY OF RNA POLYMERASE II‐GENE OCCUPANCY DURING PH‐INDUCED LIVER REGENERATION
To probe the synchrony of cell‐division‐cycle progression further, we examined the genomic response of a selected set of cell‐division markers by measuring RNA polymerase II (Pol II) occupancy on four transcription units using ChIP‐Seq on total liver and transcript levels by RNA‐Seq of poly(A)‐selected RNA. We selected the Cdk2 gene, as a largely ubiquitously expressed cell‐division‐cycle marker, and three cyclin‐encoding genes, Ccnd1 (encoding CycD1), Ccna2 (encoding CycA2), and Ccnb1 (encoding CycB1), as highly cell‐division‐cycle regulated genes (Fig. 2). ChIP‐Seq results (Fig. 2, panel a) for 0‐hour resting and both sham‐surgery (1‐20 hours) and PH (1 hour‐1 week) mice are shown with corresponding quantitation of Pol II at the transcriptional start site (Pol II promoter; Fig. 2, panel b) and within the transcription unit (Pol II body; Fig. 2, panel c). Quantitation of the corresponding RNA‐Seq analyses (including the 48‐hour sham‐surgery sample) is shown in Fig. 2, panel d. The most prominent feature of the Pol II ChIP‐Seq results is promoter‐bound Pol II (Fig. 2).
The pattern of Pol II occupancy differs among the four genes. Cdk2 varies relatively little over the course of both the sham‐surgery and post‐PH response (Fig. 2A, panels a‐c), consistent with its known broad expression pattern.28 In contrast, the G1‐phase marker Ccnd1 exhibits a prominent increase in Pol II occupancy, peaking at 28 hours after PH and subsequently decreasing to near resting levels at 48 hours before exhibiting a second wave of Pol II occupancy peaking at 60 hours; an initial but not sustained activation was also observed in the sham‐surgery samples (Fig. 2B, panels a‐c).
In contrast, Pol II occupancy on the largely S–M‐phase Ccna2 and G–M‐phase Ccnb1 genes peaked around 44 and 48 hours (Fig. 2C,D, panels a‐c). Importantly, these latter robust occupancy patterns nearly disappeared in the 60‐hour sample. The clear Pol II signal increases at 44‐48 hours, and their near disappearance by 60 hours on these two genes are clear indications that proliferating cells are going through the first cell‐division cycle after PH synchronously. If cells were not cycling synchronously, the S‐ and M‐phase marker genes, once activated, would remain elevated as new cells passed through the cell cycle asynchronously. Although the RNA‐Seq profiles of poly(A) RNA (Fig. 2, panel d) also reveal post‐PH‐specific waves of gene expression, they are not as discrete as the Pol II ChIP‐Seq results. In conclusion, it is evident from the combined results of cell‐cycle‐marker protein accumulation, Pol II‐gene occupancy, and poly(A) RNA accumulation analyses that after PH a first wave of newly proliferating cells progress through the cell‐division cycle synchronously. The questions of which cell types, their location, and their number were not addressed by these experiments.
MOST HEPATOCYTES PARTICIPATE IN THE FIRST WAVE OF CELL‐DIVISION‐CYCLE RE‐ENTRY AFTER PH
To determine the cell type(s), location, and number of proliferating cells involved in liver regeneration after PH, we performed immunofluorescence with the hepatocyte‐specific marker hepatocyte nuclear factor 4 alpha (HNF4α) and the robust cell‐proliferation marker Ki67 at 48 hours after PH (Fig. 3). The analysis revealed four classes of cells: cycling (Ki67+) and noncycling (Ki67–) cells that were either HNF4α‐positive hepatocytes or HNF4α‐negative nonhepatocytes; they are quantitated in Fig. 3B. The quantitation of the four classes of cells in resting liver (0 hour) revealed a few cycling nonhepatocytes and essentially no cycling hepatocytes (Fig. 3B). By 48 hours after PH, however, 70% of hepatocytes were Ki67‐positive cells and thus cycling. In contrast, less than 20% of nonhepatocytes were Ki67‐positive cells (Fig. 3B). Thus, consistent with studies in both rats and mice,2, 4, 23 hepatocytes are the first cell type to proliferate, and the majority of these participate in this proliferation. The micrographs in Fig. 3A did not, however, allow us to determine whether there was a preferential location within the lobule for cycling and noncycling hepatocytes.
Figure 3.
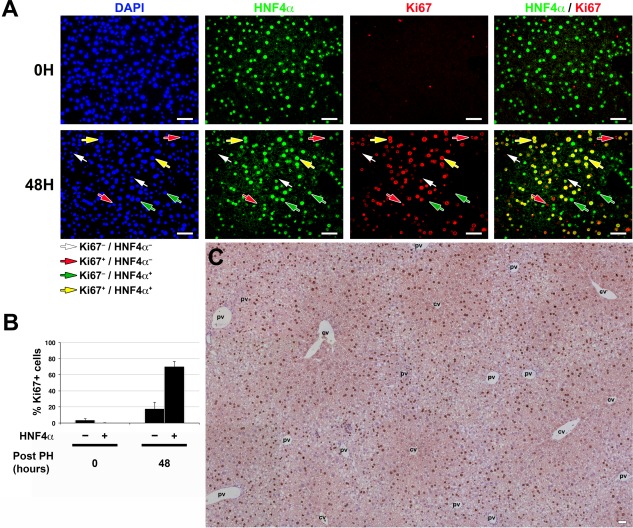
Most hepatocytes participate in the cell‐cycle response after PH. (A) Immunofluorescence analysis of paraffin‐embedded sections of resting (0H) and 48 hours post‐PH (48H) livers stained with DAPI (blue), hepatocyte‐specific anti‐HNF4α (green), and proliferation‐specific anti‐Ki67 (red) antibodies. White arrows identify noncycling (Ki67–), and red arrows identify cycling (Ki67+) HNF4α– nonhepatocytes. Green arrows identify noncycling (Ki67–), and yellow arrows identify cycling (Ki67+) HNF4α+ hepatocytes. (B) Graph showing the percentage of cycling (Ki67+) nonhepatocytes (HNF4α–) and hepatocytes (HNF4α+) in resting (0 hour) compared to 48 hours post‐PH livers (n = 5 mice/time point). The difference between percentages of cycling (Ki67+) nonhepatocytes (HNF4α–) at 0 hour and 48 hours after PH was significant (P = 0.01). The difference between percentages of cycling (Ki67+) hepatocytes (HNF4α+) at 0 hour and 48 hours after PH was highly significant (P = 1.37 × 10⁻⁵). The difference between percentages of cycling (Ki67+) nonhepatocytes (HNF4α–) and hepatocytes (HNF4α+) at 48 hours after PH was highly significant (P = 3.02 × 10⁻⁶). Displayed values are mean ± SD. (C) DAB immunostaining for Ki67 (brown) together with nuclear Mayer's hematoxylin staining (blue) in paraffin‐embedded sections of 48 hours post‐PH liver. The image shown is a composite image of several overlapping fields. Scale bar, 50 μm for all. Abbreviations: cv, central vein; DAB, diaminobenzidine; DAPI, 4´,6‐diamidino‐2‐phenylindole; pv, portal vein.
To observe any such pattern, for example, in relation to the PV and CV, we labeled all nuclei with Mayer's hematoxylin, used diaminobenzidine‐peroxidase secondary staining to identify nuclei stained with the Ki67 antibody, and imaged multiple lobules of the liver at a time. At 0 hour, as expected, there was little Ki67 staining (Supporting Fig. S7). At 48 hours after PH (Fig. 3C), this approach revealed a relatively panlobular Ki67+ staining pattern, although Ki67+ pericentral cells were under‐represented (Fig. 3C; see also Supporting Fig. S7). Thus, at 48 hours after PH, the pattern of proliferating cells is quite broad, making a defined origin of proliferating cells difficult to discern.
MIDLOBULAR HEPATOCYTES EXHIBIT AN EARLY CELL‐CYCLE RESPONSE AFTER PH
We then turned to probing the origin of proliferating cells within the lobule. For this purpose, we immunostained early regenerating livers for the G1‐phase marker CycD1 and acquired “tilescan” images of sections of entire liver lobes at high resolution (see, for example, Supporting Fig. S8). Higher magnifications of such microscopy are shown in Fig. 4. Consistent with its early role in cell‐division‐cycle progression, CycD1 increases in abundance early in the regenerating mouse liver2, 3, 12, 29, 30 (see also Fig. 2; Supporting Fig. S6). In the post‐PH sample (Fig. 4A, panel b), by 10 hours the nuclei of apparently midlobular hepatocytes were prominently stained with an evident network pattern, indicating that it is the midlobular hepatocytes that first enter the cell‐division cycle following PH.
Figure 4.
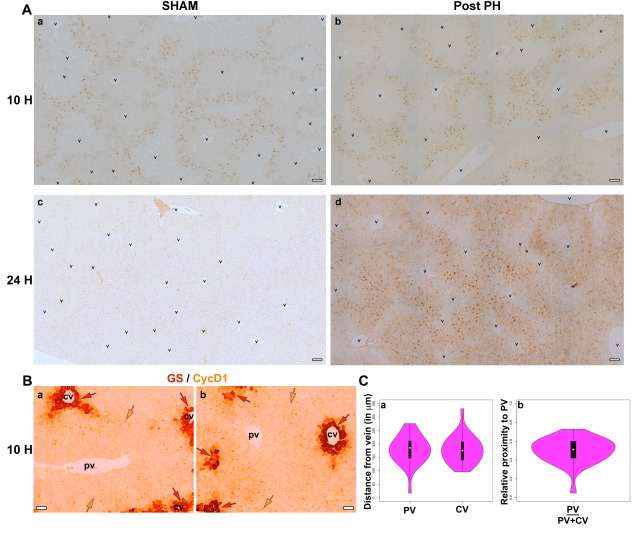
Midlobular hepatocytes show first response after PH. (A) DAB immunostaining for CycD1 (light brown) in paraffin‐embedded sections of (a) 10 hours post‐sham‐operation (10 H SHAM), (b) 10 hours post‐PH (10 H Post PH), (c) 24 hours post‐sham operation (24 H SHAM), and (d) 24 hours post‐PH (24 H Post PH) livers. (B) Two images of DAB immunostaining for CycD1 (light brown) together with DAB immunostaining for the GS pericentral‐hepatocyte marker (dark brownish‐red) in paraffin‐embedded sections of 10 hours post‐PH (10 H) liver are shown. The light brown arrows point to CycD1+ hepatocytes and dark brownish‐red arrows point to GS+ pericentral hepatocytes. (C) Violin plots showing the range of distal and proximal distances of the CycD1+ hepatocytes from either a PV or CV (n = 26). The relative proximity to PV was calculated by dividing the distance of a CycD1+ hepatocyte from its nearest PV by total distance between the surrounding PV and CV. Scale bar, 50 μm for all. Abbreviations: cv, central vein; DAB, diaminobenzidine; pv, portal vein.
Unexpectedly, however, after 10 hours, the livers after sham surgery displayed a strikingly similar network pattern of CycD1 midlobular hepatocyte staining. The positive staining is consistent with the parallel rise of Ccnd1 RNA levels in post‐PH and sham‐surgery livers (Fig. 2B, panel d). Nevertheless, at 24 hours, the PH and sham‐surgery samples differed greatly; whereas detectable CycD1 levels disappeared in the sham‐surgery livers, they became even more prominent in the post‐PH sample (Fig. 4A). Thus, the Ccnd1 gene can be activated selectively in midlobular hepatocytes by the surgical PH procedure absent liver resection, but only after PH is Ccnd1 expression reinforced later on, consistent with hepatocyte proliferation only after PH.
To determine precisely which hepatocytes induced Ccnd1 expression at the 10‐hour time point, we measured the distance between CycD1‐positive nuclei and their nearest PV and CV, the latter two being differentiated by the high levels of cytoplasmic glutamine synthetase (GS) within hepatocytes surrounding the CV (Fig. 4B). The results show that the distribution of CycD1‐positive cells centered on the midline between the PV and CV, i.e., are midlobular (Fig. 4C). Later, after PH, high CycD1 levels remain preferentially midlobular, exhibiting the network pattern albeit less well defined (Fig. 4A, panel d; Supporting Fig. S9). These results suggest that in mice the midlobular hepatocytes are the first hepatocytes to evidence cell‐division‐cycle entry after PH.
HEPATOCYTE GLYCOGEN CONTENT PATTERNS IN REGENERATING LIVER
Because the mice were feeding entrained, we were interested in examining the metabolic status of their post‐PH livers and, noting that post‐PH mouse livers display a decreased glycogen content,31 we used PAS staining to assay intracellular glycogen levels. Hepatocyte glycogen levels increase during feeding and decrease during fasting.32, 33 As the PH time series was initiated at ZT2, the samples collected at 0, 24, 48, and 72 hours as well as 1 week after PH were all collected after 2 hours of fasting.
PAS staining of ZT2 livers (i) resting (0 hour); (ii) 24, 48, 72 hours, or 1 week after PH; or (iii) 48 hours after sham surgery is shown in Fig. 5. The samples at 72 hours and 1 week after PH as well as the 48 hours after the sham operation gave enriched glycogen staining patterns similar to the resting liver (compare Fig. 5, panel a and d‐f). In contrast, at 24 and 48 hours after PH, clear zones of high glycogen depletion were evident (Fig. 5, panel b and c). The 24‐hour pattern resembled an accentuated resting liver pattern with a periportal focus (compare Fig. 5, panel a and b); in contrast, the 48‐hour pattern was conspicuously different with entangled zones of glycogen‐rich and glycogen‐poor cells (Fig. 5, panel c). In both cases, the pattern of depleted zones was not as pronounced at the nearby preceding 20‐ and 44‐hour post‐PH time points (ZT22) when mice had experienced 10 hours of feeding (Supporting Fig. S10), indicating that the glycogen‐depleted zones after 2 hours fasting in the samples 24 and 48 hours after PH result from recent depletion of glycogen content owing to fasting.
Figure 5.
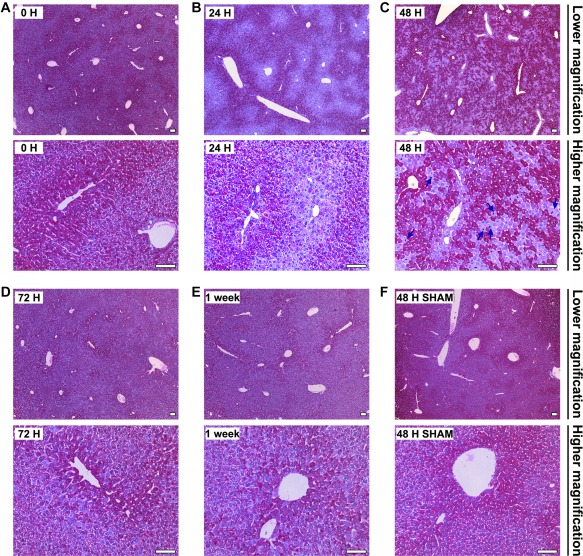
Intracellular glycogen levels show alterations in post‐PH livers. Hepatic glycogen content was detected by PAS staining (purple) in paraffin‐embedded sections from (a) resting control (0 H); (b) 24 (24 H), (c) 48 (48 H), and (d) 72 (72 H) hours and (e) 1 week post‐PH livers; and (f) 48 hours post‐sham‐operated (48 H SHAM) livers. The sections were also stained with nuclear Mayer's hematoxylin (blue). All livers were collected at ZT2 after 2 hours fasting. All time points are shown at lower and higher magnification as indicated. The blue arrows in panel c (high magnification) indicate mitotic indices. Scale bar, 100 μm for all.
Examination of the higher magnification of the 48‐hour sample, when many hepatocytes are in a first wave of cell division, suggested that the glycogen‐depleted hepatocytes were enriched for mitotic indices (Fig. 5, panel c [bottom, arrows]). We explored this relationship further (Fig. 6). High magnification (Fig. 6A) showed how at 48 hours after PH, but not in resting liver or 48 hours after sham surgery, adjacent individual hepatocytes can be either enriched or depleted for glycogen, with glycogen‐depleted hepatocytes exhibiting prominent mitotic indices. These results suggest that cell‐division‐cycling cells are preferentially depleted for glycogen at this time point.
Figure 6.
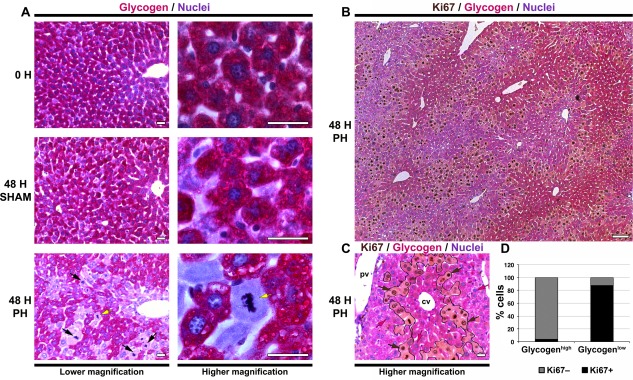
Glycogen‐depleted zones at 48 hours after PH are enriched for cell‐division‐cycling hepatocytes. (A) Hepatic glycogen content was detected in paraffin‐embedded sections from resting control (0 H), 48 hours post‐sham‐operated (48 H SHAM) livers, and 48 hours post‐PH (48 H PH) livers collected at ZT2 after 2 hours fasting, by PAS (purple) staining. The sections were also stained with nuclear Mayer's hematoxylin (blue). All time points are shown at lower and higher magnification as indicated. The black arrows in the 48 H PH sample indicate mitotic indices. The hepatocyte indicated by the yellow arrow is shown at higher magnification. (B) DAB immunostaining for Ki67 (brown) was done together with PAS (purple) staining in a paraffin‐embedded section from a 48‐hour post‐PH (48 H PH) liver. The section was also stained with nuclear Mayer's hematoxylin (blue). (C) Higher magnification view of Ki67 immunostaining (DAB, brown) done together with PAS (purple) staining in a paraffin‐embedded section from a 48‐hour post‐PH (48 H PH) liver. Black lines delineate the glycogen‐depleted and glycogen‐enhanced hepatocyte zones. Brown arrows point to glycogen‐depleted Ki67+ hepatocytes, and pink arrows point to glycogen‐containing Ki67‐ hepatocytes. (D) Graphs showing the percentage of Ki67+ (black zones) and Ki67– (gray zones) hepatocytes segregated into glycogen‐high (PAS+) or glycogen‐low (PAS–) zones in 48‐hour post‐PH livers (n = 5 each). Scale bar, 25 μm for A and C; 100 μm for B. Abbreviations: cv, central vein; DAB, diaminobenzidine; pv, portal vein.
To substantiate this conclusion, we stained for the Ki67 proliferation marker in combination with PAS staining; whereas before the position of Ki67‐positive hepatocytes was relatively unclear (see Fig. 3), glycogen staining by PAS correlated with clear zones of proliferating hepatocytes. Thus, as shown in a large region of a 48‐hour post‐PH liver in Fig. 6B, it is evident that the relatively glycogen‐depleted areas are enriched for proliferating hepatocytes. This differential “zonation” is rendered visible in Fig. 6C by the pattern of glycogen‐depleted cells overlapping the Ki67‐positive cells at higher magnification. Although not forming a contiguous readily evident region, the pattern suggests a midlobular origin. This observation is consistent with the degeneration from 10 to 48 hours after PH of the Ccnd1‐expression pattern seen in early post‐PH midlobular hepatocytes.
To quantitate the segregation of Ki67‐positive and Ki67‐negative hepatocytes into glycogen‐enriched or glycogen‐depleted populations, we outlined glycogen‐depleted cells (Fig. 6C) and determined the percentage of Ki67‐positive and Ki67‐negative nuclei in each population (Fig. 6D). Indeed, whereas less than 5% of glycogen‐enriched hepatocytes were Ki67 positive, about 85% of nuclei in the glycogen‐depleted population were Ki67 positive. Thus, there is a prominent segregation of hepatocytes with different combined metabolic and proliferative states in the early regenerating mouse liver; after 2 hours fasting, there was higher glycogen with low proliferation and lower glycogen with high proliferation.
This difference in glycogen content could be owing to a higher state of glycolysis in proliferating cells. Consistent with this hypothesis, we observed some increase in the glycolytic pathway enzyme glyceraldehyde‐3‐phophate dehydrogenase in proliferating hepatocytes (Supporting Fig. S11A‐C), although there was an overall decrease in levels of this enzyme after PH (Supporting Fig. S11D).
MAINTENANCE OF STRUCTURAL PERIPORTAL AND METABOLIC PERICENTRAL INTEGRITIES
The aforementioned studies divide the hepatocytes of the regenerating liver into three categories: midlobular proliferating hepatocytes with low glycogen content at 48 hours with 2 hours fasting and nonproliferating periportal and pericentral hepatocytes with higher glycogen content. The higher glycogen content of the nonproliferating hepatocytes mirrors the normal state of hepatocytes with 2‐hour fasting (see Fig. 5A) and thus suggests that these nonproliferating hepatocytes maintain normal functions of the liver. To probe the structural and metabolic states of the nonproliferating hepatocytes further, we respectively examined the staining pattern of (i) the adherens junction component E‐cadherin, which is specific to PV proximal hepatocytes and mimics the pattern of periportal metabolic markers34, 35 (Fig. 7A), and (ii) GS, which is specific for pericentral hepatocytes36, 37 (Fig. 7B), in the 48‐hour regenerating liver.
Figure 7.
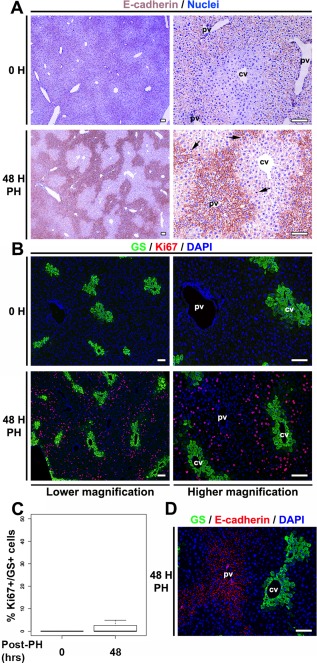
Structural and metabolic integrities maintained in periportal and pericentral hepatocytes during regeneration. (A) DAB immunostaining for E‐cadherin (brown) in paraffin‐embedded sections of resting (0 H) and 48‐hour post‐PH (48 H PH) livers. The sections were also stained with nuclear Mayer's hematoxylin (blue). Both time points are shown at lower and higher magnification as indicated. Black arrows indicate mitotic indices. (B) Immunofluorescence analysis of paraffin‐embedded sections stained with DAPI (blue) together with antibodies against GS (green) and Ki67 (red), from resting (0 H) and 48‐hour post‐PH (48 H PH) livers. Both time points are shown at lower and higher magnification as indicated. (C) Box plot showing the percentage of Ki67+/GS+ hepatocytes in resting (0 hour) and 48 hours post‐PH livers (n = 3 at 0 H; n = 9 at 48 H). The difference between percentages of Ki67+ and GS+ hepatocytes in resting (0 hour) and 48‐hour post‐PH livers was marginally significant (P = 0.048). (D) Immunofluorescence analysis of a paraffin‐embedded section stained with DAPI (blue) together with antibodies against GS (green) and E‐cadherin (red) from 48‐hour post‐PH (48 H PH) liver. Scale bar, 100 μm. Abbreviations: cv, central vein; DAB, diaminobenzidine; DAPI, 4´,6‐diamidino‐2‐phenylindole; pv, portal vein.
At 48 hours, the E‐cadherin staining became more robust while maintaining its periportal pattern, as noted previously after a milder 30% PH protocol.34 Here, mitotic figures were centered around the interface of the E‐cadherin‐positive and E‐cadherin‐negative regions, consistent with their primarily midlobular position, with both E‐cadherin‐positive and E‐cadherin‐negative hepatocytes displaying mitotic figures. (A metabolic periportal marker, PEPCK, also maintained its resting state periportal localization pattern at 48 hours after PH [Supporting Fig. S12]). GS‐positive hepatocytes also maintained their resting liver localization, in this case pericentral; however, in contrast to the E‐cadherin‐positive hepatocytes, the GS‐positive hepatocytes did not proliferate as evidenced by the lack of Ki67 labeling of GS‐positive hepatocytes at 48 hours (Fig. 7C). The nonoverlapping relationship of the staining zones of the structural periportal E‐cadherin and metabolic pericentral GS markers is visualized in Fig. 7D by an E‐cadherin and GS double labeling of a regenerating liver at 48 hours after PH.
In toto, these results indicate that, at 48 hours after PH with 2 hours fasting and while in segregated metabolic states, glycogen‐deficient midlobular hepatocytes proliferate and glycogen‐rich nonproliferating periportal and pericentral hepatocytes maintain metabolic functions of the liver.
Although the light‐ and feeding‐entrainment protocol influenced the glycogen content of individual cells at 48 hours, the overall pattern of cell proliferation was not affected by the entrainment. Thus, the pattern of elevated CycD1 and Ki67 levels were also midlobular without the light and feeding entrainment (Supporting Fig. S13A,B). In contrast, the glycogen content was more variable from individual to individual and differed in pattern (Supporting Fig. S13C), although cells in the process of mitosis remained glycogen deficient. Thus, the midlobular pattern of murine cell proliferation after PH described here is not owing to the light‐ and feeding‐entrainment protocol used.
Discussion
By performing PH 2 hours after the initiation of a light/fasting period of mice entrained in a 12‐hour‐dark feeding and 12‐hour‐light fasting protocol, we found that 48 hours after PH, at the peak of mitosis, dividing hepatocytes have a selective deficit in glycogen. The differential glycogen‐content pattern revealed two clearly demarcated intertwined regions of either elevated glycogen content with low mitotic activity or depressed glycogen content with high mitotic activity.
It is the combined patterns of PAS and Ki67 staining that clearly define the two different populations of juxtaposed cells. For example, Figs. 3C and 6B show essentially identical Ki67 staining except that in Fig. 6B there is the addition of PAS staining that makes more evident the two separate but entangled populations of proliferating and nonproliferating cells. Combined with the well‐defined early appearance of the G1‐phase cell‐division‐cycle marker CycD1 in midlobular cells, the pattern of mitotic activity at 48 hours after PH suggests that in the first round of hepatocyte division periportal and pericentral hepatocytes remain largely quiescent while midlobular cells become dedicated to proliferation to initiate the post‐PH compensatory hyperplasia. In this manner, the nonproliferating periportal and pericentral hepatocytes may maintain their respective liver homeostatic functions during regeneration, as evidenced specifically by the continued GS levels in the nonproliferating pericentral cells (see Fig. 7).
Lipid β‐oxidation, gluconeogenesis, cholesterol synthesis, and ammonia detoxification by urea synthesis are favored in periportal hepatocytes, whereas glutamine and bile acid synthesis, ketogenesis, lipogenesis, and glycolysis are favored in pericentral hepatocytes (Fig. 8). This distinct zonation of hepatocyte metabolic function has been observed in both mice and rats.5, 6, 7, 8, 38, 39 Thus, the midlobular region is unique in representing a transition point between the periportal and pericentral metabolic states. Superimposed on this transition point is the synthesis of the G1‐phase CycD1 marker at 10 hours after PH (Figs. 4 and 8).
Figure 8.
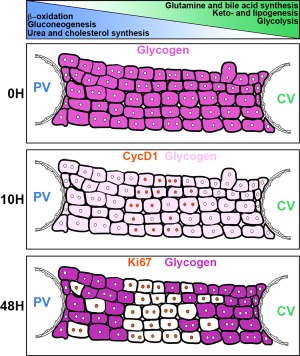
Schematic showing the relationship of midlobular hepatocyte cell‐division‐cycle entry and glycogen content in feeding‐entrained mice after PH. A simplified view of the classic liver architecture with hepatocytes shown between a portal vein on the left and a central vein on the right in resting (0H) and 10 (10H) and 48 hours (48H) post‐PH mouse livers. Distribution of some metabolic pathways preferentially found in periportal (blue gradient) or pericentral (green gradient) hepatocytes are depicted on the top. For further interpretation of the schematic, refer to text.
Torre et al.30 observed a midlobular CycD1 pattern at 24 hours after PH that is dependent on β‐catenin transcriptional activation, an end result of Wnt signaling. Here, acquiring entire areas of the liver lobe at 10 hours, we observed a clear interconnected midlobular network of CycD1 already present. Owing to patterns of hepatocyte proliferation observed in rats, hepatocyte proliferation during mouse liver regeneration is often referred to as panlobular,30 which made restricted midlobular Ccnd1 expression at 24 hours after PH appear discordant with hepatocyte proliferation. However, the early and continued midlobular Ccnd1 expression (Fig. 4) followed by midlobular‐dominated hepatocyte proliferation (Fig. 6) after PH, as observed in our study, showed that mouse hepatocyte proliferation is in fact concordant with CycD1 levels early in liver regeneration.
The gradual increase in the number of CycD1‐positive cells during post‐PH regeneration suggests that cells enter the cell‐division cycle progressively. Nevertheless, there is a largely synchronous transition through mitosis. This gradual and yet subsequently synchronous pattern can be explained by a Wee1 “gating” mechanism11 in which hepatocytes, starting with the most midlobular, enter the cell‐division cycle progressively and then eventually pass through mitosis synchronously.
Strikingly, the clear interconnected midlobular network of CycD1 in PH samples at 10 hours was also observed after sham surgery, suggesting an early Wnt‐signaling response of these hepatocytes to stress created by the surgery process itself even absent PH. By 24 hours, however, only in the PH sample did the CycD1 pattern continue, indeed becoming more robust, suggesting that the initial Ccnd1 expression is amplified during compensatory liver hyperplasia but silenced if no cell proliferation is required. These results suggest that midlobular hepatocytes first respond to stress, here either sham surgery or PH, and that from this cell pool a compensatory hyperplasia response follows after PH but not sham surgery. The post‐PH response pattern contrasts with that observed upon CCl4 toxic injury of mice10 where it is periportal hybrid hepatocytes that respond to compensate for the loss of injured pericentral hepatocytes over a span of a few months.
The post‐PH passage through cell division is highly synchronous,11 as evidenced here by immunostaining (Fig. 1) and the coordinate rise and fall of gene transcription of cell‐cycle genes (Fig. 2). Meanwhile, at 48 hours, the proliferative/glycogen‐depleted and nonproliferative/glycogen‐enriched cells are in entangled zones. Thus, there is an apparent binary switch that decides whether cells, even adjacent cells, proliferate or not and that those that do not proliferate maintain metabolic functions. We imagine that the entangled nature of the pattern reflects (i) that which way the switch is thrown in individual cells to generate the two cell populations has a stochastic component and/or (ii) that dynamics of post‐PH tissue remodeling mixes cells with predetermined proliferative or homeostatic maintenance functions.
The pattern of mouse hepatocyte proliferation during liver regeneration observed here, which was not dependent on the light and feeding entrainment protocol used, contrasts with the well‐defined pattern observed in rats. In rats, studies extending back 80 years14, 15, 16, 40, 41 have consistently shown that rat post‐PH liver regeneration involves a wave of cell‐division‐cycle entry beginning with periportal hepatocytes followed by midlobular and then pericentral hepatocytes, such that by the end of liver regeneration over 90% of hepatocytes enter the cell‐division cycle; this has been reviewed in numerous publications.2, 4, 12, 21, 22, 23, 24 As rats and mice are closely related rodent species, this well‐documented pattern of rat hepatocyte proliferative response to 70% PH has often been assumed to exist in mice as well.12, 23, 29, 30, 42
The results presented here, where a first round of mouse hepatocyte proliferation involves a synchronous midlobular‐centered proliferation of about two thirds of hepatocytes, suggest that a perspective of a common mouse and rat PH response should be revised. Indeed, the number of differences in structure and function of the liver in different mammalian species is considerable. For example, at the level of morphology, rats lack a gall bladder and the form of the liver lobes between rodent and human liver differs markedly. Furthermore, there is a difference in the timing of the first peak of S‐phase after PH seen in rats and mice; in rats the first peak of hepatocyte S phase after PH is 24 hours and in mice it is 36 hours.11, 15 The difference in origin within the lobule of proliferative hepatocytes for rat and mouse liver regeneration after PH illustrated in this study could be related to the timing difference. Thus, the liver appears to be a remarkably plastic organ both in morphology and regulation of cellular functions. Such evolutionary plasticity means that there is not a common mammalian liver regeneration process and that human liver regeneration, a process of considerable medical interest, cannot be assumed to resemble that in either rat or mouse, instead it may well also possess novel features.
The choice of midlobular cells in PH‐induced mouse liver regeneration may be opportune because in this case, unlike with toxin‐induced injury, both the periportal and pericentral cells in the nonexcised liver tissue are healthy. Thus, midlobular cells can take on the new task of cell proliferation while the periportal and pericentral cells maintain different specific metabolic functions.
Author names in bold designate shared co‐first authorship.
Supporting information
Additional Supporting Information may be found at onlinelibrary.wiley.com/doi/10.1002/hep4.1102/full.
Supporting Information Figure 1
Supporting Information Figure 2
Supporting Information Figure 3
Supporting Information Figure 4
Supporting Information Figure 5
Supporting Information Figure 6
Supporting Information Figure 7
Supporting Information Figure 8
Supporting Information Figure 9
Supporting Information Figure 10
Supporting Information Figure 11
Supporting Information Figure 12
Supporting Information Figure 13
Supporting Information 1
Acknowledgements
We thank S. Offner for advice on the partial hepatectomy surgery; Maykel Lopes for technical assistance; Yannick Krempp and Jean‐Yves Chatton for advice on tilescan imaging; the Cellular Imaging Facility of the University of Lausanne Faculty of Biology and Medicine for microscope access; Ueli Schibler for discussions; Hadrien Demagny, Vincent Dion, Lluis Fajas, and Nouria Hernandez for critical readings of the manuscript.
Potential conflict of interest: Nothing to report.
Supported by Swiss National Science Foundation grants CRSII3_160798 (WH) and 31003A_170150 (WH) and by the University of Lausanne (WH).
Present address for Leonor Rib is the Bioinformatics Center, Department of Biology & Biotech Research and Innovation Center, University of Copenhagen, Copenhagen, Denmark.
REFERENCES
- 1. Fausto N, Campbell JS, Riehle KJ. Liver regeneration. Hepatology 2006;43(Suppl. 1):S45‐S53. [DOI] [PubMed] [Google Scholar]
- 2. Michalopoulos GK. Liver regeneration. J Cell Physiol 2007;213:286‐300. [DOI] [PMC free article] [PubMed] [Google Scholar]
- 3. Michalopoulos GK. Hepatostat: liver regeneration and normal liver tissue maintenance. Hepatology 2017;65:1384‐1392. [DOI] [PubMed] [Google Scholar]
- 4. Michalopoulos GK, DeFrances MC. Liver regeneration. Science 1997;276:60‐66. [DOI] [PubMed] [Google Scholar]
- 5. Benhamouche S, Decaens T, Godard C, Chambrey R, Rickman DS, Moinard C, et al. Apc tumor suppressor gene is the “zonation‐keeper” of mouse liver. Dev Cell 2006;10:759‐770. [DOI] [PubMed] [Google Scholar]
- 6. Braeuning A, Ittrich C, Kohle C, Hailfinger S, Bonin M, Buchmann A, et al. Differential gene expression in periportal and perivenous mouse hepatocytes. FEBS J 2006;273:5051‐5061. [DOI] [PubMed] [Google Scholar]
- 7. Gebhardt R, Matz‐Soja M. Liver zonation: novel aspects of its regulation and its impact on homeostasis. World J Gastroenterol 2014;20:8491‐8504. [DOI] [PMC free article] [PubMed] [Google Scholar]
- 8. Kietzmann T. Metabolic zonation of the liver: the oxygen gradient revisited. Redox Biol 2017;11:622‐630. [DOI] [PMC free article] [PubMed] [Google Scholar]
- 9. Wang B, Zhao L, Fish M, Logan CY, Nusse R. Self‐renewing diploid Axin2(+) cells fuel homeostatic renewal of the liver. Nature 2015;524:180‐185. [DOI] [PMC free article] [PubMed] [Google Scholar]
- 10. Font‐Burgada J, Shalapour S, Ramaswamy S, Hsueh B, Rossell D, Umemura A, et al. Hybrid periportal hepatocytes regenerate the injured liver without giving rise to cancer. Cell 2015;162:766‐779. [DOI] [PMC free article] [PubMed] [Google Scholar]
- 11. Matsuo T, Yamaguchi S, Mitsui S, Emi A, Shimoda F, Okamura H. Control mechanism of the circadian clock for timing of cell division in vivo. Science 2003;302:255‐259. [DOI] [PubMed] [Google Scholar]
- 12. Fausto N, Campbell JS. The role of hepatocytes and oval cells in liver regeneration and repopulation. Mech Dev 2003;120:117‐130. [DOI] [PubMed] [Google Scholar]
- 13. Su AI, Guidotti LG, Pezacki JP, Chisari FV, Schultz PG. Gene expression during the priming phase of liver regeneration after partial hepatectomy in mice. Proc Natl Acad Sci U S A 2002;99:11181‐11186. [DOI] [PMC free article] [PubMed] [Google Scholar]
- 14. Grisham JW. A morphologic study of deoxyribonucleic acid synthesis and cell proliferation in regenerating rat liver; autoradiography with thymidine‐H3. Cancer Res 1962;22:842‐849. [PubMed] [Google Scholar]
- 15. Rabes HM. Kinetics of hepatocellular proliferation after partial resection of the liver. Prog Liver Dis 1976;5:83‐99. [PubMed] [Google Scholar]
- 16. Wu Y, Guo F, Liu J, Xiao X, Huang L, He D. Triple labeling with three thymidine analogs reveals a well‐orchestrated regulation of hepatocyte proliferation during liver regeneration. Hepatol Res 2011;41:1230‐1239. [DOI] [PubMed] [Google Scholar]
- 17. Mitchell C, Willenbring H. A reproducible and well‐tolerated method for 2/3 partial hepatectomy in mice. Nat Protoc 2008;3:1167‐1170. Erratum in: Nat Protoc 2014;9. [DOI] [PubMed] [Google Scholar]
- 18. Fischer AH, Jacobson KA, Rose J, Zeller R. Hematoxylin and eosin staining of tissue and cell sections. CSH Protoc 2008;2008:pdb.prot4986. [DOI] [PubMed] [Google Scholar]
- 19. Gilardi F, Migliavacca E, Naldi A, Baruchet M, Canella D, Le Martelot G, et al. Genome‐wide analysis of SREBP1 activity around the clock reveals its combined dependency on nutrient and circadian signals. PLoS Genet 2014;10:e1004155. [DOI] [PMC free article] [PubMed] [Google Scholar]
- 20. Le Martelot G, Canella D, Symul L, Migliavacca E, Gilardi F, Liechti R, et al.; CycliX Consortium . Genome‐wide RNA polymerase II profiles and RNA accumulation reveal kinetics of transcription and associated epigenetic changes during diurnal cycles. PLoS Biol 2012;10:e1001442. [DOI] [PMC free article] [PubMed] [Google Scholar]
- 21. Mange F, Praz V, Migliavacca E, Willis IM, Schutz F, Hernandez N; CycliX Consortium . Diurnal regulation of RNA polymerase III transcription is under the control of both the feeding‐fasting response and the circadian clock. Genome Res 2017;27:973‐984. [DOI] [PMC free article] [PubMed] [Google Scholar]
- 22. Sobel JA, Krier I, Andersin T, Raghav S, Canella D, Gilardi F, et al.; CycliX Consortium . Transcriptional regulatory logic of the diurnal cycle in the mouse liver. PLoS Biol 2017;15:e2001069. [DOI] [PMC free article] [PubMed] [Google Scholar]
- 23. Fausto N, Campbell JS, Riehle KJ. Liver regeneration. J Hepatol 2012;57:692‐694. [DOI] [PubMed] [Google Scholar]
- 24. Kang LI, Mars WM, Michalopoulos GK. Signals and cells involved in regulating liver regeneration. Cells 2012;1:1261‐1292. [DOI] [PMC free article] [PubMed] [Google Scholar]
- 25. Michalopoulos GK. Advances in liver regeneration. Expert Rev Gastroenterol Hepatol 2014;8:897‐907. [DOI] [PubMed] [Google Scholar]
- 26. Taub R. Liver regeneration: from myth to mechanism. Nat Rev Mol Cell Biol 2004;5:836‐847. [DOI] [PubMed] [Google Scholar]
- 27. Zou Y, Bao Q, Kumar S, Hu M, Wang GY, Dai G. Four waves of hepatocyte proliferation linked with three waves of hepatic fat accumulation during partial hepatectomy‐induced liver regeneration. PLoS One 2012;7:e30675. [DOI] [PMC free article] [PubMed] [Google Scholar]
- 28. Miyaoka Y, Miyajima A. To divide or not to divide: revisiting liver regeneration. Cell Div 2013;8:8. [DOI] [PMC free article] [PubMed] [Google Scholar]
- 29. Prigent C, Dimitrov S. Phosphorylation of serine 10 in histone H3, what for? J Cell Sci 2003;116:3677‐3685. [DOI] [PubMed] [Google Scholar]
- 30. Morgan DO. Principles of CDK regulation. Nature 1995;374:131‐134. [DOI] [PubMed] [Google Scholar]
- 31. Gougelet A, Colnot S. A complex interplay between Wnt/beta‐catenin signalling and the cell cycle in the adult liver. Int J Hepatol 2012;2012:816125. [DOI] [PMC free article] [PubMed] [Google Scholar]
- 32. Torre C, Benhamouche S, Mitchell C, Godard C, Veber P, Letourneur F, et al. The transforming growth factor‐alpha and cyclin D1 genes are direct targets of beta‐catenin signaling in hepatocyte proliferation. J Hepatol 2011;55:86‐95. [DOI] [PubMed] [Google Scholar]
- 33. Trotter NL. A fine structure study of lipid in mouse liver regenerating after partial hepatectomy. J Cell Biol 1964;21:233‐244. [DOI] [PMC free article] [PubMed] [Google Scholar]
- 34. Geisler CE, Hepler C, Higgins MR, Renquist BJ. Hepatic adaptations to maintain metabolic homeostasis in response to fasting and refeeding in mice. Nutr Metab (Lond) 2016;13:62. [DOI] [PMC free article] [PubMed] [Google Scholar]
- 35. Rui L. Energy metabolism in the liver. Compr Physiol 2014;4:177‐197. [DOI] [PMC free article] [PubMed] [Google Scholar]
- 36. Hempel M, Schmitz A, Winkler S, Kucukoglu O, Bruckner S, Niessen C, et al. Pathological implications of cadherin zonation in mouse liver. Cell Mol Life Sci 2015;72:2599‐2612. [DOI] [PMC free article] [PubMed] [Google Scholar]
- 37. Sekine S, Ogawa R, McManus MT, Kanai Y, Hebrok M. Dicer is required for proper liver zonation. J Pathol 2009;219:365‐372. [DOI] [PubMed] [Google Scholar]
- 38. Cadoret A, Ovejero C, Terris B, Souil E, Levy L, Lamers WH, et al. New targets of beta‐catenin signaling in the liver are involved in the glutamine metabolism. Oncogene 2002;21:8293‐8301. [DOI] [PubMed] [Google Scholar]
- 39. Gebhardt R, Mecke D. Heterogeneous distribution of glutamine synthetase among rat liver parenchymal cells in situ and in primary culture. EMBO J 1983;2:567‐570. [DOI] [PMC free article] [PubMed] [Google Scholar]
- 40. Jungermann K. Metabolic zonation of liver parenchyma. Semin Liver Dis 1988;8:329‐341. [DOI] [PubMed] [Google Scholar]
- 41. Jungermann K, Kietzmann T. Zonation of parenchymal and nonparenchymal metabolism in liver. Annu Rev Nutr 1996;16:179‐203. [DOI] [PubMed] [Google Scholar]
- 42. Brues AM, Marble BB. An analysis of mitosis in liver restoration. J Exp Med 1937;65:15‐27. [DOI] [PMC free article] [PubMed] [Google Scholar]
- 43. Fabrikant JI. The kinetics of cellular proliferation in regenerating liver. J Cell Biol 1968;36:551‐565. [DOI] [PMC free article] [PubMed] [Google Scholar]
- 44. Zimmermann A. Regulation of liver regeneration. Nephrol Dial Transplant 2004;19(Suppl. 4):iv6‐iv10. [DOI] [PubMed] [Google Scholar]
Associated Data
This section collects any data citations, data availability statements, or supplementary materials included in this article.
Supplementary Materials
Additional Supporting Information may be found at onlinelibrary.wiley.com/doi/10.1002/hep4.1102/full.
Supporting Information Figure 1
Supporting Information Figure 2
Supporting Information Figure 3
Supporting Information Figure 4
Supporting Information Figure 5
Supporting Information Figure 6
Supporting Information Figure 7
Supporting Information Figure 8
Supporting Information Figure 9
Supporting Information Figure 10
Supporting Information Figure 11
Supporting Information Figure 12
Supporting Information Figure 13
Supporting Information 1
Data Availability Statement
The data supporting the findings of this study are available within the paper and in its Supporting Information files.


