

Abstract
Background
Circulating total bilirubin is known to be inversely and independently associated with future risk of cardiovascular disease. However, the relationship of circulating total bilirubin with incident hypertension is uncertain. We aimed to assess the association of total bilirubin with future hypertension risk and supplemented this with a Mendelian randomization approach to investigate any causal relevance to the association.
Methods and Results
Plasma total bilirubin levels were measured at baseline in the PREVEND (Prevention of Renal and Vascular End‐Stage Disease) prospective study of 3989 men and women without hypertension. Hazard ratios (95% confidence intervals) of total bilirubin with incident hypertension were assessed. New‐onset hypertension was recorded in 1206 participants during a median follow‐up of 10.7 years. Baseline total bilirubin was approximately log‐linearly associated with hypertension risk. Age‐ and sex‐adjusted hazard ratio for hypertension per 1‐SD increase in loge total bilirubin was 0.86 (0.81–0.92; P<0.001), which was attenuated to 0.94 (0.88–0.99; P=0.040) after further adjustment for established risk factors and other potential confounders. The association was marginally significant on further adjustment for high‐sensitivity C‐reactive protein (0.94; 0.88–1.00; P=0.067). A genetic variant at the UGT1A1*28 locus consistently shown to be strongly associated with circulating bilirubin levels—rs6742078—was not significantly associated with blood pressure or hypertension (P>0.05 for all), arguing against a strong causal association of circulating bilirubin with blood pressure.
Conclusions
The weak and inverse association of circulating total bilirubin with future hypertension risk may be driven by biases such as unmeasured confounding and/or reverse causation. Further evaluation is warranted.
Keywords: bilirubin, cohort study, hypertension, Mendelian randomization, risk factor
Subject Categories: Risk Factors; Hypertension; Epidemiology; Primary Prevention; Genetic, Association Studies
Clinical Perspective
What Is New?
In a population‐based, prospective study of white men and women without a history of hypertension and pre‐existing apparent disease at baseline, increasing levels of circulating total bilirubin was associated with a reduced risk of future hypertension, which was consistent with a dose‐response relationship.
Findings from a Mendelian randomization approach provided weak evidence against a strong causal association of circulating bilirubin with blood pressure.
What Are the Clinical Implications?
Lifestyle interventions and pharmacological agents that cause safe elevations in circulating levels of bilirubin may represent a novel therapeutic target for the prevention of hypertension and, consequently, cardiovascular disease; however, further evaluation is needed.
Circulating total bilirubin has been consistently shown to be inversely and independently associated with cardiovascular disease (CVD) risk.1 Plausible mechanisms by which higher total bilirubin contributes to reduced CVD risk have been attributed to its antioxidant,2, 3 anti‐inflammatory,4 and antiatherogenic properties.5 Given the graded, inverse, and independent association between total bilirubin levels and CVD risk, there have been suggestions of a causal relationship. However, findings from 2 Mendelian randomization (MR) studies have not provided strong evidence for a causal association between total bilirubin levels and coronary heart disease risk.6, 7 Hypertension, which is a leading risk factor for the global burden of disease, is a key intermediate modifiable phenotype for CVD development8 and is included in the standard cardiovascular risk assessment panel.9 Major risk factors for hypertension include physical inactivity, obesity, and excess alcohol intake.10, 11 Given the close link between CVD and hypertension and the fact that they share common antecedent risk factors, there is emerging evidence that total bilirubin might also be linked to the development of hypertension. Indeed, a number of studies conducted in animal models suggest that bilirubin might reduce blood pressure through decreases in vascular oxidative stress.12, 13 A number of epidemiological observational studies have also suggested inverse associations. However, uncertainties remain about the nature and magnitude of the prospective association between total bilirubin and high blood pressure or hypertension, given that the majority of these limited earlier reports were based on cross‐sectional designs14 were insufficiently powerful to address aspects of the association15, 16 were based on younger populations17 or were conducted in populations with pre‐existing disease.15 In a recent analysis of data from the National Health and Nutrition Examination Surveys 1999–2012, which was based on a random sample of over 31 000 individuals, the researchers reported an inverse association between serum bilirubin and hypertension.14 Though the analysis was robust, the findings were limited by the cross‐sectional study design. With the ongoing debate on the potential value of total bilirubin levels in prevention and control of hypertension as well as coronary heart disease,14, 18, 19, 20 it will be clinically useful if circulating total bilirubin is shown to contribute to the development of future hypertension. In this context, our aim was to characterize and quantify more reliably the nature and magnitude of the prospective association between total bilirubin and the risk of future hypertension in the general population; by utilizing a large population‐based sample of 3989 participants from the well‐established PREVEND (Prevention of Renal and Vascular End‐Stage Disease) study, who were free of hypertension and pre‐existing apparent disease at baseline. Furthermore, we evaluated whether there might be a causal relation between total bilirubin and the development of hypertension, by querying the associations of systolic blood pressure (SBP), diastolic blood pressure (DBP), and hypertension with a common single‐nucleotide variant (SNV) found at the UGT1A1*28 locus—rs6742078—using published genome‐wide association studies. Because of the strong link between the rs6742078 SNV and bilirubin,21, 22 the use of this variant to assess the causal association between bilirubin and blood pressure is an informative application of the MR approach.
Materials and Methods
This report was conducted according to STROBE (Strengthening the Reporting of Observational Studies in Epidemiology) guidelines for reporting observational studies in epidemiology (Table S1).23
Study Population
This study was part of the ongoing PREVEND study, a large‐scale, observational, general population cohort study based in The Netherlands and which began in 1997. The PREVEND study was designed to investigate the predictive value of urinary albumin excretion and its relationship to renal and CVD progression. Details of the study design and recruitment have been described in previous reports.24, 25 Briefly, 8592 inhabitants aged 28 to 75 years were recruited from the city of Groningen in The Netherlands. Baseline measurements were performed between 1997 and 1998. For this analysis, we used data of participants who did not have CVD, hypertension, renal disease, or malignancy at baseline, which left a cohort of 3989 participants with nonmissing information on total bilirubin levels, relevant covariates, and incident hypertension. The PREVEND study was approved by the local medical ethics committee in accord with the Declaration of Helsinki. All participants provided written informed consent.
For the genetic association study, we utilized publicly available data from the International Consortium of Blood Pressure and the BPExome consortia, which have both been described in detail elsewhere.26, 27 Briefly, the International Consortium of Blood Pressure involves a meta‐analysis of genome‐wide association studies data evaluating the associations between 2.5 million genotyped or imputed single‐nucleotide polymorphisms and SBP and DBP in 69 395 individuals of European ancestry from 29 studies. The BPExome consortium is also a meta‐analysis of genome‐wide association studies data from 51 studies comprising 192 763 individuals, which assessed the associations of 242 296 SNVs with DBP, SBP, pulse pressure, and hypertension. The rs6742078 SNV was a suitable instrumental variable for the present analyses, given its robust specificity for serum total bilirubin levels (explaining up to 45% of the variation in circulating serum bilirubin levels22) and its use in previous studies to assess the causal relevance of total bilirubin to several disease outcomes.6, 7, 21
Risk‐Factor Assessment
Participants completed 2 outpatient visits to assess baseline data on demographics, anthropometric measurements, cardiovascular and renal history, and use of medication. Furthermore, information on medication use was complemented with data from all community pharmacies in the city of Groningen, which covers complete information on drug use in 95% of PREVEND participants. Blood pressure values were recorded as the mean of the last 2 readings of both visits, because this provides the values after stabilization of blood pressure. Blood pressure was measured at the right arm, in the supine position, every minute for 10 and 8 minutes, respectively, with an automatic device (Dinamap XL Model 9300; Johnson‐Johnson Medical, Tampa, FL). After an overnight fast and 15 minutes of rest, venous blood was obtained from participants. Plasma samples were prepared by centrifugation at 4°C. Plasma total bilirubin was measured by a colorimetric assay (2,4‐dicholoraniline reaction; Merck MEGA, Darmstadt, Germany), with the detection limit being 1.0 mmol/L. Interassay coefficients of variation were 3.8% and 2.9% in the lower normal and higher normal range, respectively. Glucose, total cholesterol, fasting insulin, and hsCRP (high‐sensitivity C‐reactive protein) were measured using standard laboratory protocols, which have been previously described.28, 29, 30 Urinary albumin excretion was estimated as the mean of two 24‐hour urine collections, and the concentration was determined by nephelometry (BNII; Dade Behring Diagnostics, Marburg, Germany). Estimated glomerular filtration rate was calculated using the Chronic Kidney Disease Epidemiology Collaboration combined creatinine‐cystatin C equation.31
End Point Ascertainment
The primary outcome for this study was first‐onset hypertension. Incident hypertension was defined as SBP of ≥140 mm Hg, a DBP of ≥90 mm Hg, or the use of antihypertensive medication, in accord with recommendations from the Seventh Joint National Committee on Prevention, Detection, Evaluation, and Treatment of High Blood Pressure.32
Statistical Analysis
Skewed variables (eg, total bilirubin and hsCRP) were natural log‐transformed to achieve approximately normal distributions. Descriptive analyses were preformed to summarize baseline characteristics of participants. We assessed cross‐sectional associations of total bilirubin levels with risk markers for hypertension by calculating partial correlation coefficients adjusted for age and sex. Cox proportional hazards models were used to assess the association between total bilirubin and incident hypertension risk after confirmation of no major departure from the proportionality of hazards assumptions using Schoenfeld residuals.33 To characterize the shape of the association between total bilirubin and hypertension risk, hazard ratios estimated within quartiles of baseline total bilirubin levels relative to the bottom quartile were plotted against mean loge total bilirubin levels in each quartile using floating absolute risks,34 details of which have been described previously.35 Subsidiary analyses involved fitting multivariate‐adjusted fractional polynomial models. Total bilirubin was modeled as both continuous (per 1‐SD higher loge total bilirubin levels) and categorical (quartiles defined according to the baseline distribution of total bilirubin level) variables. The SD of baseline loge total bilirubin level was 0.43 (equivalent to 1.5‐fold higher circulating total bilirubin level, as e0.43=1.54). Hazard ratios were progressively adjusted for (1) age and sex; (2) other established risk factors for hypertension (smoking status, history of diabetes mellitus, SBP, total cholesterol, body mass index, parental history of hypertension, alcohol consumption, and estimated glomerular filtration rate); (3) other potential confounders (urinary albumin excretion and homeostasis model assessment of insulin resistance); and (4) hsCRP. Selection of these confounders were based on their previously established role as risk factors for hypertension, evidence from previous research, or their potential as confounders based on known associations with the outcome of hypertension and observed associations with plasma total bilirubin using the available data. We used formal tests of interaction tests to assess statistical evidence of effect modification by individual characteristics, such as age, sex, and other risk markers for hypertension. To avoid potential bias attributed to reverse causation, we carried out sensitivity analyses that excluded participants with a history of diabetes mellitus at baseline, the first 2 years of follow‐up, or participants on regular statin medication, or participants with potential Gilbert's syndrome.1 We also utilized the use of complex survey design analyses,36 taking into account that the PREVEND cohort is oversampled for subjects with higher albuminuria levels, which enables the results to be extrapolated to the general population. All statistical analyses were conducted using Stata software (version 14; StataCorp LP, College Station, TX). The associations of rs6742078 were queried with SBP and DBP using data from the International Consortium of Blood Pressure and with SBP, DBP, and hypertension using data from the BPExome consortium.37
Results
Baseline Characteristics and Correlates of Total Bilirubin
Mean age of participants at study entry was 45 (SD, 11) years and 55% were women. Mean (SD) of loge total bilirubin level was 1.94 (0.43) μmol/L. Figure S1 shows a histogram representing the frequency distribution of total bilirubin levels in the study sample. Baseline descriptive characteristics of the participants are shown in Table 1. Except for parental history of hypertension, there were significant differences in baseline clinically relevant subgroups and levels of risk markers between participants who did and did not develop hypertension during follow‐up. There were weak and inverse correlations of loge total bilirubin levels with physical measures (body mass index, waist‐to‐hip ratio, and blood pressure), as well as with cholesterol and metabolic markers. There was a modest inverse correlation with loge hsCRP (r=−0.25). Baseline total bilirubin levels were higher by 25% in men compared with women. Levels were lower by 13% in the combined group of current and former smokers compared with noncurrent smokers (Table 2).
Table 1.
Baseline Participant Characteristics Overall and According to the Development of Incident Hypertension
| Overall (N=3989) Mean (SD) or Median (IQR) or n (%) | Without Incident Hypertension (N=2783) Mean (SD) or Median (IQR) or n (%) | With Incident Hypertension (N=1206) Mean (SD) or Median (IQR) or n (%) | P Value* | |
|---|---|---|---|---|
| Total bilirubin, μmol/L† | 7 (5–9) | 7 (5–9) | 7 (5–9) | <0.001 |
| Questionnaire | ||||
| Males‡ | 1790 (44.9) | 1188 (42.7) | 602 (49.9) | <0.001 |
| Age at survey, y§ | 45 (11) | 43 (10) | 50 (10) | <0.0001 |
| History of diabetes mellitus‡ | 19 (0.5) | 9 (0.3) | 10 (0.8) | 0.033 |
| Smoking‡ | ||||
| Current | 1365 (34.2) | 942 (33.9) | 423 (35.1) | |
| Former | 1351 (33.9) | 914 (32.8) | 437 (36.2) | 0.012 |
| Never | 1273 (31.9) | 927 (33.3) | 346 (28.7) | |
| Alcohol consumers‡ | 3121 (78.2) | 2217 (79.7) | 904 (75.0) | 0.001 |
| Parental history of hypertension‡ | 1185 (29.7) | 807 (29.0) | 378 (31.3) | 0.136 |
| Physical measurements | ||||
| BMI, kg/m2 § | 25 (4) | 25 (3) | 26 (4) | <0.0001 |
| WHR§ | 0.86 (0.09) | 0.84 (0.08) | 0.88 (0.09) | <0.0001 |
| SBP, mm Hg§ | 119 (11) | 116 (10) | 125 (10) | <0.0001 |
| DBP, mm Hg§ | 70 (7) | 68 (7) | 74 (7) | <0.0001 |
| Lipid, metabolic, inflammatory, and renal markers | ||||
| Total cholesterol, mmol/L§ | 5.48 (1.11) | 5.35 (1.07) | 5.77 (1.14) | <0.0001 |
| Glucose, mmol/L§ | 4.63 (0.87) | 4.55 (0.71) | 4.82 (1.13) | <0.0001 |
| Fasting insulin, units/mL† | 7.1 (5.1–10.2) | 6.8 (4.9–9.6) | 7.8 (5.5–11.6) | <0.0001 |
| HOMA‐IR† | 1.43 (0.99–2.12) | 1.36 (0.96–1.94) | 1.65 (1.10–2.50) | <0.0001 |
| hsCRP, mg/L† | 0.95 (0.43–2.30) | 0.85 (0.38–2.00) | 1.29 (0.58–2.87) | <0.0001 |
| eGFR, mL/min per 1.73 m2 § | 92.3 (14.0) | 93.7 (13.5) | 88.9 (14.3) | <0.0001 |
| UAE, mg/24 h† | 8.04 (5.86–12.45) | 7.61 (5.72–11.48) | 9.18 (6.38–15.55) | <0.0001 |
BMI indicates body mass index; DBP, diastolic blood pressure; eGFR, estimated glomerular filtration rate (as calculated using the Chronic Kidney Disease Epidemiology Collaboration combined creatinine‐cystatin C equation); HDL‐C, high‐density lipoprotein cholesterol; HOMA‐IR, homeostasis model assessment of insulin resistance; hsCRP, high‐sensitivity C‐reactive protein; IQR, interquartile range; SBP, systolic blood pressure; UAE, urinary albumin excretion; WHR, waist‐to‐hip ratio.
*Utilized a 2‐sample t tests for a difference in means for continuous variables and a chi‐square test for categorical variables.
†Reported as median (IQR).
‡ Reported as n (%).
§Reported as mean (SD).
Table 2.
Cross‐Sectional Correlates of Total Bilirubin
| Partial Correlation r (95% CI)* | Percentage Difference (95% CI) in Total Bilirubin Levels Per 1 SD Higher or Compared With Reference Category of Correlate† | |
|---|---|---|
| Total bilirubin, μmol/L | ··· | ··· |
| Sex | ||
| Female | ··· | Ref |
| Male | ··· | 25% (21, 28)∥ |
| Questionnaire | ||
| Age at survey, y | −0.05 (−0.08, −0.01)‡ | −2% (−3, −1)‡ |
| History of diabetes mellitus | ||
| No | ··· | Ref |
| Yes | ··· | −8% (−23, 12) |
| Smoking status | ||
| Nonsmokers | ··· | Ref |
| Current and former smokers | ··· | −13% (−16, −11)∥ |
| Alcohol consumption | ||
| Nonconsumers | ··· | Ref |
| Current consumers | ··· | 6% (3, 9)§ |
| Parental history of hypertension | ||
| No | ··· | Ref |
| Yes | ··· | −1% (−4, 2) |
| Physical measurements | ||
| BMI, kg/m2 | −0.17 (−0.20, −0.14)∥ | −7% (−8, −6)∥ |
| WHR | −0.14 (−0.17, −0.10)‡ | −7% (−9, −6)∥ |
| SBP, mm Hg | −0.05 (−0.08, −0.02)‡ | −2% (−4, −1)§ |
| DBP, mm Hg | −0.09 (−0.12, −0.06) | −4% (−5, −3)∥ |
| Lipid, metabolic, inflammatory, and renal markers | ||
| Total cholesterol, mmol/L | −0.15 (−0.18, −0.12)∥ | −7% (−8, −5)∥ |
| Glucose, mmol/L | −0.09 (−0.12, −0.06)§ | −4% (−5, −3)∥ |
| Fasting insulin, units/mL | −0.21 (−0.24, −0.18)∥ | −8% (−9, −7)∥ |
| HOMA‐IR | −0.21 (−0.24, −0.18)∥ | −8% (−10, −7)∥ |
| hsCRP, mg/L | −0.25 (−0.27, −0.22)∥ | −10% (−11, −9)∥ |
| eGFR, mL/min per 1.73 m2 | −0.01 (−0.04, 0.02) | −1% (−2, 1) |
| UAE, mg/24 h | −0.04 (−0.07, −0.01) | −1% (−2, 1) |
BMI indicates body mass index; DBP, diastolic blood pressure; eGFR, estimated glomerular filtration rate (as calculated using the Chronic Kidney Disease Epidemiology Collaboration combined creatinine‐cystatin C equation); HDL‐C, high‐density lipoprotein cholesterol; HOMA‐IR, homeostasis model assessment of insulin resistance; hsCRP, high‐sensitivity C‐reactive protein; Ref, reference; SBP, systolic blood pressure; UAE, urinary albumin excretion; WHR, waist‐to‐hip ratio.
*Partial correlation coefficients between loge total bilirubin and the row variables.
†Percentage change in total bilirubin levels per 1‐SD increase in the row variable (or for categorical variables, the percentage difference in mean total bilirubin levels for the category vs the reference) adjusted for age and sex.
Asterisks indicate the level of statistical significance: ‡ P<0.05; § P<0.01; ∥ P<0.001.
Total Bilirubin Levels and Risk of Incident Hypertension
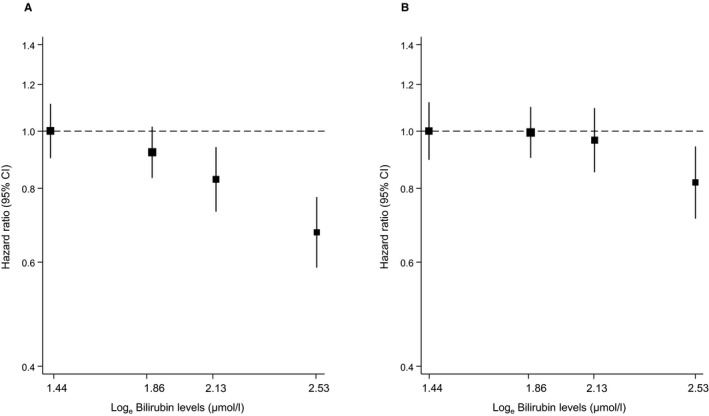
During a median (interquartile) follow‐up of 10.7 (5.5–11.6) years, 1206 incident hypertension cases (incidence rate of 34.3 per 1000 person‐years at risk; 95% confidence interval [CI], 32.4–36.3) were recorded. Total bilirubin was approximately log‐linearly associated with hypertension risk in analyses adjusted for established hypertension risk factors (smoking status, history of diabetes mellitus, SBP, total cholesterol, body mass index, parental history of hypertension, alcohol consumption, and estimated glomerular filtration rate; Figure 1). A linear shape was also suggested on fitting a fractional polynomial model (Figure S2). In age‐ and sex‐adjusted analysis, the hazard ratio for hypertension per 1‐SD change in loge total bilirubin was 0.86 (95% CI, 0.81–0.92; P<0.001), which was attenuated to 0.94 (95% CI, 0.88–0.99; P=0.035) after further adjusting for several risk factors for hypertension. The results remained consistent on further adjustment for urinary albumin excretion and homeostasis model assessment of insulin resistance 0.94 (95% CI, 0.88–0.99; P=0.040). The association did not reach formal significance after additional adjustment for hsCRP 0.94 (95% CI, 0.88–1.00; P=0.067; Table 3). However, in an age‐ and sex‐only–adjusted analysis, the initial association 0.86 (95% CI, 0.81–0.92; P<0.001) was only minimally attenuated after single additional adjustment for hsCRP 0.90 (95% CI, 0.85–0.96; P=0.001). In analyses that compared the top versus bottom quartile of total bilirubin, the inverse associations between total bilirubin and incident hypertension were maintained (Table 3). In sensitivity analyses, the hazard ratios remained similar on exclusion of the first 2 years of follow‐up, people with diabetes mellitus at baseline, people on cholesterol lowering medication, or people with potential Gilbert's syndrome (Table S2). The association between total bilirubin and incident hypertension was not statistically significantly modified by several clinically relevant characteristics (Figure 2). The association between total bilirubin and hypertension risk remained consistent similar when design‐based Cox regression analysis was used (Table S3).
Figure 1.
Hazard ratios for incident hypertension, by baseline levels of total bilirubin using floating absolute risks. A, Hazard ratios were adjusted for age and sex; (B) adjustment in A plus smoking status, history of diabetes mellitus, systolic blood pressure, total cholesterol, body mass index, parental history of hypertension, alcohol consumption, and estimated glomerular filtration rate (as calculated using the Chronic Kidney Disease Epidemiology Collaboration combined creatinine‐cystatin C equation). CI indicates confidence interval.
Table 3.
Association of Baseline Total Bilirubin Levels With Incident Hypertension
| Total Bilirubin Level, μmol/L | Events/Total | Model 1 | Model 2 | Model 3 | Model 4 | ||||
|---|---|---|---|---|---|---|---|---|---|
| HR (95% CI) | P Value | HR (95% CI) | P Value | HR (95% CI) | P Value | HR (95% CI) | P Value | ||
| Per 1‐SD increase | 1206/3989 | 0.86 (0.81–0.92) | <0.001 | 0.94 (0.88–0.99) | 0.035 | 0.94 (0.88–0.99) | 0.040 | 0.94 (0.88–1.00) | 0.067 |
| Q1 (0.95–5) | 367/1134 | Ref | Ref | Ref | |||||
| Q2 (6–7) | 381/1184 | 0.92 (0.80–1.06) | 0.267 | 1.00 (0.86–1.16) | 0.978 | 0.99 (0.86–1.15) | 0.924 | 1.00 (0.86–1.16) | 0.992 |
| Q3 (8–9) | 243/826 | 0.83 (0.70–0.98) | 0.026 | 0.97 (0.82–1.14) | 0.700 | 0.97 (0.82–1.15) | 0.736 | 0.98 (0.83–1.16) | 0.834 |
| Q4 (≥10) | 215/845 | 0.68 (0.57–0.81) | <0.001 | 0.82 (0.68–0.98) | 0.033 | 0.82 (0.68–0.99) | 0.035 | 0.83 (0.69–1.00) | 0.055 |
Model 1: Age and sex. Model 2: Model 1 plus smoking status, history of diabetes mellitus, systolic blood pressure, total cholesterol, body mass index, parental history of hypertension, alcohol consumption, and estimated glomerular filtration rate (as calculated using the Chronic Kidney Disease Epidemiology Collaboration combined creatinine‐cystatin C equation). Model 3: Model 2 plus loge urinary albumin excretion and loge homeostasis model assessment of insulin resistance. Model 4: Model 3 plus loge high‐sensitivity C‐reactive protein. CI indicates confidence interval; HR, hazard ratio; Q, quintile.
Figure 2.
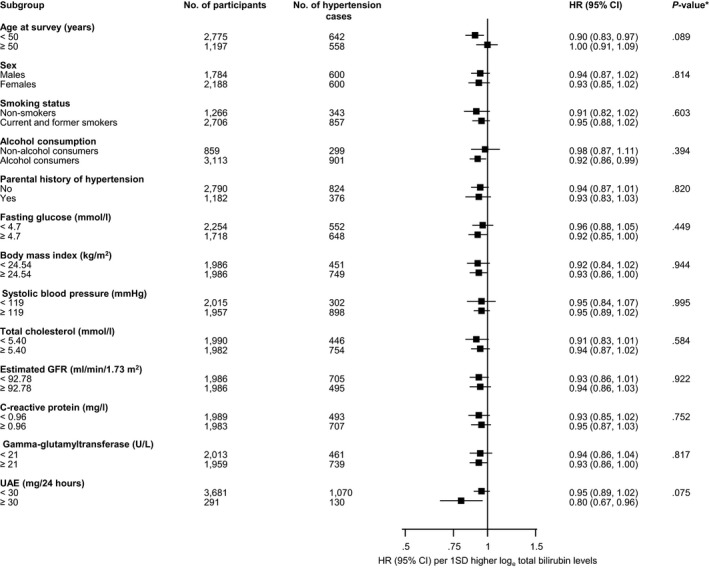
Hazard ratios for total bilirubin and hypertension risk by several participant level characteristics. Ratios were adjusted for age, sex, smoking status, history of diabetes mellitus, systolic blood pressure, total cholesterol, body mass index, parental history of hypertension, alcohol consumption, and estimated glomerular filtration rate (GFR; as calculated using the Chronic Kidney Disease Epidemiology Collaboration combined creatinine‐cystatin C equation); CI indicates confidence interval (bars); HR, hazard ratio; UAE, urine albumin excretion. *P value for interaction; cutoffs used for fasting glucose, body mass index, systolic blood pressure, total cholesterol, estimated GFR, and C‐reactive protein are median values.
Evidence From Genome‐Wide Association Studies
In the International Consortium of Blood Pressure, the associations of rs6742078 with blood pressure were not statistically significant; 0.187 mm Hg per additional copy of the T allele (SE, 0.103; P=0.06) for SBP and 0.122 (SE, 0.066; P=0.07) for DBP. Similarly, in the BPExome consortium, associations were nonstatistically significant; P=0.24 for SBP, P=0.85 for DBP, and P=0.97 for hypertension. These results provide evidence against a strong causal role of long‐term elevated levels of bilirubin in decreasing blood pressure.
Discussion
Key Findings
In this population‐based study comprising white men and women without a history of hypertension and pre‐existing disease at baseline, we have shown that total bilirubin is inversely associated with the future risk of hypertension in an approximately log‐linear fashion. The association was independent of several established risk factors for hypertension and other potential confounders. The association was marginally significant on further adjustment for hsCRP; however, the association was only minimally attenuated after single adjustment for hsCRP in an analysis that was initially only adjusted for age and sex. The inverse association between total bilirubin and incident hypertension was not modified by several clinically relevant characteristics and remained consistent in several sensitivity analyses. Furthermore, utilizing large‐scale genetic data, the rs6742078 SNV had small effects on blood pressure, but lacked statistical significance. The current results argue against a strong causal role of circulating bilirubin in the etiology of blood pressure reduction, but cannot rule out a weak causal effect.
Comparison With Previous Studies
A number of epidemiological studies have suggested an inverse association between total bilirubin and hypertension or blood pressure; but there were several limitations of these previous reports and which included utilization of cross‐sectional designs, small sample sizes, or use of selected populations.15, 16, 20, 38 Chin et al, in their analysis of a cohort of 1208 normotensive Korean men and women, showed serum bilirubin to be associated with lower incidence of hypertension.16 However, this analysis was somewhat limited by the relatively low event rate in the exposed group, the staggered follow‐up evaluations, and the sampling frame, which was not representative of the general population. In an elegant analysis of National Health and Nutrition Examination Surveys 1999–2012, Wang and Bautista robustly demonstrated that serum bilirubin was inversely associated with SBP and hypertension14; however, the main limitation of this study was its cross‐sectional design, which precluded the ability to assess the temporal relationship between bilirubin and risk of hypertension and minimize reverse causation bias. To our knowledge, our study is the first to assess the long‐term prospective association between total bilirubin and risk of hypertension in a general white population. We demonstrated a modest effect of total bilirubin on hypertension risk, a finding that was also demonstrated in the National Health and Nutrition Examination Surveys 1999–2012 analysis. In a recent study, which evaluated the association between bilirubin and several cardiovascular risk factors, the researchers demonstrated a lack of an effect of bilirubin on blood pressure in both observational and MR analyses.22 Whether baseline circulating total bilirubin has an inverse association with future hypertension risk may need to be confirmed in other large‐scale, prospective cohort studies, given the limited evidence.
Potential Explanations for Findings
Bilirubin, iron, and carbon monoxide (CO) constitute the 3 metabolites of heme degradation by heme oxygenase (HO). These degradation products of the HO reaction have been suggested to regulate important functions in cells.39 Bilirubin has been suggested to contribute to reduced CVD risk mainly through its antioxidant actions2, 3 and anti‐inflammatory effects.4 Like CVD, oxidative stress mechanisms are involved in the pathophysiology of hypertension.40, 41 Vascular reactive oxygen species, which are generated during oxidative reactions, are known to be important contributors to the development of hypertension,42 because they cause impairment of mechanisms that modulate arterial blood pressure.43, 44 Increased production of reactive oxygen species in the renal medulla is primarily responsible for angiotensin‐II–dependent hypertension.45 Given this, it has been postulated that the protective effect of bilirubin on elevated blood pressure may be through its potent antioxidant effects.46 It has been suggested that the primary role of bilirubin in the whole process is its inhibition of nicotinamide adenine dinucleotide phosphate oxidase, which is the main enzyme responsible for the generation of vascular reactive oxygen species.47, 48 Bilirubin also inhibits protein kinase C activity49 and scavenges the superoxide anions in vascular cells, which inhibits the pressor actions of angiotensin II.13 In addition to its antioxidant effects, bilirubin exhibits anti‐inflammatory effects through its anticomplement actions.50 Given that inflammation has been implicated in the development of hypertension, circulating bilirubin might be involved in the modulation of blood pressure through its anti‐inflammatory effects.51 Finally, low serum bilirubin levels have been shown to be associated with impaired flow‐mediated vasodilation52 a measure of endothelial dysfunction; which has been shown to precede the development of hypertension.53 There is also a possibility that the blood‐pressure–lowering effect of bilirubin could be partly attributed to CO, mostly known as a toxic gas if the exposure is high. Though the function of CO has not been clearly elucidated; in low concentrations, CO has antiapoptotic properties as well as vascular protective and anti‐inflammatory properties,54, 55 which may contribute to blood pressure regulation. The effects of CO include vasodilation, inhibition of vascular smooth muscle cells proliferation, and induction of angiogenesis.56, 57 Accumulating evidence suggests that the HO pathway, through the production of CO and bilirubin, may be responsible for regulating vascular function as well as blood pressure.39 Findings from the current study do not provide strong evidence for a causal association between circulating total bilirubin and hypertension. This suggests that the inverse associations demonstrated in the current and previous observational studies may be driven by biases such as unmeasured confounding and/or reverse causation.
Implications of Findings
Irrespective of the weak protective effective of total bilirubin on future hypertension risk and lack of evidence of a strong causal role, its potential role in the prevention and control of hypertension as well as CVD has been the subject of considerable debate.14, 18, 19, 20 Proven interventions that induce increase in safe levels of circulating bilirubin leading to clinically relevant decreases in blood pressure are currently unavailable. Lifestyle interventions (such as smoking cessation, weight loss, and physical activity)58, 59 and pharmacological agents (HO‐1 inducers such as statins, aspirin, resveratrol, and niacin and drugs that inhibit hepatic uptake)60, 61 may cause safe elevations in circulating levels of bilirubin, but there is limited evidence on their potential effects on blood pressure. These pharmacological agents cause mild‐to‐moderate elevations in circulating levels of bilirubin and have been proposed as future tools for CVD prevention and treatment.62 It has been suggested that the HO‐1 pathway may represent a novel therapeutic target for the prevention of CVD.39 The measurement of circulating total bilirubin involves a routinely available blood test, which is simple, cheap, and well standardized; therefore, it would be of immense clinical benefit if bilirubin is demonstrated to have a role in preventing hypertension as well as CVD. However, further research is needed and caution is required given that markedly elevated levels of bilirubin levels may exert toxic effects4, 63 and cause an increase in the risk of CVD64, 65 and mortality.66
Strengths and Limitations
The strengths of the current study include the large, population‐based cohort, which was representative of the general population; exclusion of hypertensive individuals at baseline as well as those with pre‐existing diseases, such as CVD, renal disease, or malignancy, which minimized any possibilities of reverse‐causation bias; comprehensive data on lifestyle and biochemical factors, which allowed control for potential confounders; comprehensive analysis, such as evaluating the shape of the association and effect modification by clinically relevant characteristics; and robustness of the findings in several sensitivity analyses. Furthermore, we have utilized an MR approach using summarized large‐scale published data to assess the associations of a specific genetic variant for circulating bilirubin with blood pressure. A number of limitations should also be considered when interpreting these results. First, because our data were observational, residual confounding attributed to errors in risk marker measurements and unmeasured confounders remains an alternative explanation. Second, absence of repeat measurements of total bilirubin precluded the ability to correct for within‐person variability in plasma total bilirubin levels and this could have underestimated the associations, as a result of regression dilution given the long‐term follow‐up of the cohort.67, 68 Circulating bilirubin has been shown to exhibit high within‐person variability,69 hence the associations demonstrated may even be stronger. Larger‐scale prospective studies with repeat measurements of circulating total bilirubin are needed to reliably assess the magnitude of the associations. Third, measurements of total bilirubin in the PREVEND study involved prolonged plasma storage, which could have contributed to the modest effect of total bilirubin on hypertension risk. Fourth, we assessed bilirubin concentrations in the fasting state, when the levels are highest. Because we had no data on nonfasting bilirubin concentrations, we were unable to investigate its concentrations in the nonfasting state and how these concentrations affect hypertension. Fifth, the current analysis involved principally white‐European participants, which hampers the generalization of our findings. Finally, our MR approach was based on published publicly available data, which precluded the ability to fully assess instrumental variable assumptions. Given the unavailability of interventions that specifically influence levels of bilirubin alone70 and can be safely administered to large numbers of subjects for a prolonged period, causal inferences using randomized trials of interventions that modify bilirubin levels are not feasible in the short term. Further MR studies using large‐scale, individual‐level data may help to establish or rule out causality.
Conclusions
The weak and inverse association of circulating total bilirubin with future hypertension risk may be driven by biases such as unmeasured confounding and/or reverse causation. However, given the limitations of the present study, further evaluation is needed to rule out any causal association and assess any potential relevance of circulating total bilirubin in the prevention of hypertension.
Sources of Funding
The Dutch Kidney Foundation supported the infrastructure of the PREVEND program from 1997 to 2003 (Grant E.033). The University Medical Center Groningen supported the infrastructure from 2003 to 2006. Dade Behring, Ausam, Roche, and Abbott financed laboratory equipment and reagents by which various laboratory determinations could be performed. The Dutch Heart Foundation supported studies on lipid metabolism (Grant 2001‐005). The funding sources had no role in study design; in data collection, analysis, or interpretation of the data; in writing of the report; or in the decision to submit for publication.
Disclosures
None.
Supporting information
Table S1. STROBE 2007 Statement—Checklist of Items That Should Be Included in Reports of Cohort Studies
Table S2. Association of Baseline Total Bilirubin Levels With Incident Hypertension in Several Sensitivity Analyses
Table S3. Association of Baseline Total Bilirubin Levels With Incident Hypertension Using Complex Survey Analyses
Figure S1. Frequency distribution of plasma total bilirubin in the study sample.
Figure S2. Hazard ratios for incident hypertension using multivariate‐adjusted fractional polynomials.
(J Am Heart Assoc. 2017;6:e006503 DOI: 10.1161/JAHA.117.006503.)29133521
References
- 1. Kunutsor SK, Bakker SJ, Gansevoort RT, Chowdhury R, Dullaart RP. Circulating total bilirubin and risk of incident cardiovascular disease in the general population. Arterioscler Thromb Vasc Biol. 2015;35:716–724. [DOI] [PubMed] [Google Scholar]
- 2. Vitek L. The role of bilirubin in diabetes, metabolic syndrome, and cardiovascular diseases. Front Pharmacol. 2012;3:55. [DOI] [PMC free article] [PubMed] [Google Scholar]
- 3. Schwertner HA, Vitek L. Gilbert syndrome, UGT1A1*28 allele, and cardiovascular disease risk: possible protective effects and therapeutic applications of bilirubin. Atherosclerosis. 2008;198:1–11. [DOI] [PubMed] [Google Scholar]
- 4. Vitek L, Schwertner HA. The heme catabolic pathway and its protective effects on oxidative stress‐mediated diseases. Adv Clin Chem. 2007;43:1–57. [DOI] [PubMed] [Google Scholar]
- 5. Perlstein TS, Pande RL, Creager MA, Weuve J, Beckman JA. Serum total bilirubin level, prevalent stroke, and stroke outcomes: NHANES 1999–2004. Am J Med. 2008;121:781–788.e1. [DOI] [PMC free article] [PubMed] [Google Scholar]
- 6. Kunutsor SK. Serum total bilirubin levels and coronary heart disease—causal association or epiphenomenon? Exp Gerontol. 2015;72:63–66. [DOI] [PubMed] [Google Scholar]
- 7. Stender S, Frikke‐Schmidt R, Nordestgaard BG, Grande P, Tybjaerg‐Hansen A. Genetically elevated bilirubin and risk of ischaemic heart disease: three Mendelian randomization studies and a meta‐analysis. J Intern Med. 2013;273:59–68. [DOI] [PubMed] [Google Scholar]
- 8. Lawes CM, Bennett DA, Feigin VL, Rodgers A. Blood pressure and stroke: an overview of published reviews. Stroke. 2004;35:776–785. [DOI] [PubMed] [Google Scholar]
- 9. Authors/Task Force M , Piepoli MF, Hoes AW, Agewall S, Albus C, Brotons C, Catapano AL, Cooney MT, Corra U, Cosyns B, Deaton C, Graham I, Hall MS, Hobbs FD, Lochen ML, Lollgen H, Marques‐Vidal P, Perk J, Prescott E, Redon J, Richter DJ, Sattar N, Smulders Y, Tiberi M, van der Worp HB, van Dis I, Verschuren WM; Additional Contributor: Simone B, Document Reviewers; De Backer G, Roffi M, Aboyans V, Bachl N, Bueno H, Carerj S, Cho L, Cox J, De Sutter J, Egidi G, Fisher M, Fitzsimons D, Franco OH, Guenoun M, Jennings C, Jug B, Kirchhof P, Kotseva K, Lip GY, Mach F, Mancia G, Bermudo FM, Mezzani A, Niessner A, Ponikowski P, Rauch B, Ryden L, Stauder A, Turc G, Wiklund O, Windecker S, Zamorano JL. 2016 European guidelines on cardiovascular disease prevention in clinical practice: the Sixth Joint Task Force of the European Society of Cardiology and Other Societies on Cardiovascular Disease Prevention in Clinical Practice (constituted by representatives of 10 societies and by invited experts): developed with the special contribution of the European Association for Cardiovascular Prevention & Rehabilitation (EACPR). Eur J Prev Cardiol. 2016;23:NP1–NP96. [DOI] [PubMed] [Google Scholar]
- 10. Whelton PK, He J, Appel LJ, Cutler JA, Havas S, Kotchen TA, Roccella EJ, Stout R, Vallbona C, Winston MC, Karimbakas J; National High Blood Pressure Education Program Coordinating Committee . Primary prevention of hypertension: clinical and public health advisory from the National High Blood Pressure Education Program. JAMA. 2002;288:1882–1888. [DOI] [PubMed] [Google Scholar]
- 11. Stamler J, Stamler R, Neaton JD, Wentworth D, Daviglus ML, Garside D, Dyer AR, Liu K, Greenland P. Low risk‐factor profile and long‐term cardiovascular and noncardiovascular mortality and life expectancy: findings for 5 large cohorts of young adult and middle‐aged men and women. JAMA. 1999;282:2012–2018. [DOI] [PubMed] [Google Scholar]
- 12. Vera T, Granger JP, Stec DE. Inhibition of bilirubin metabolism induces moderate hyperbilirubinemia and attenuates ANG II‐dependent hypertension in mice. Am J Physiol Regul Integr Comp Physiol. 2009;297:R738–R743. [DOI] [PMC free article] [PubMed] [Google Scholar]
- 13. Pflueger A, Croatt AJ, Peterson TE, Smith LA, d'Uscio LV, Katusic ZS, Nath KA. The hyperbilirubinemic Gunn rat is resistant to the pressor effects of angiotensin II. Am J Physiol Renal Physiol. 2005;288:F552–F558. [DOI] [PubMed] [Google Scholar]
- 14. Wang L, Bautista LE. Serum bilirubin and the risk of hypertension. Int J Epidemiol. 2015;44:142–152. [DOI] [PMC free article] [PubMed] [Google Scholar]
- 15. Papadakis JA, Ganotakis ES, Jagroop IA, Mikhailidis DP, Winder AF. Effect of hypertension and its treatment on lipid, lipoprotein(a), fibrinogen, and bilirubin levels in patients referred for dyslipidemia. Am J Hypertens. 1999;12:673–681. [DOI] [PubMed] [Google Scholar]
- 16. Chin HJ, Song YR, Kim HS, Park M, Yoon HJ, Na KY, Kim Y, Chae DW, Kim S. The bilirubin level is negatively correlated with the incidence of hypertension in normotensive Korean population. J Korean Med Sci. 2009;24(Suppl):S50–S56. [DOI] [PMC free article] [PubMed] [Google Scholar]
- 17. Madhavan M, Wattigney WA, Srinivasan SR, Berenson GS. Serum bilirubin distribution and its relation to cardiovascular risk in children and young adults. Atherosclerosis. 1997;131:107–113. [DOI] [PubMed] [Google Scholar]
- 18. Horsfall LJ, Nazareth I, Petersen I. Cardiovascular events as a function of serum bilirubin levels in a large, statin‐treated cohort. Circulation. 2012;126:2556–2564. [DOI] [PubMed] [Google Scholar]
- 19. Seppen J, Bosma P. Bilirubin, the gold within. Circulation. 2012;126:2547–2549. [DOI] [PubMed] [Google Scholar]
- 20. Schwertner HA, Fischer JR Jr. Comparison of various lipid, lipoprotein, and bilirubin combinations as risk factors for predicting coronary artery disease. Atherosclerosis. 2000;150:381–387. [DOI] [PubMed] [Google Scholar]
- 21. Stender S, Frikke‐Schmidt R, Nordestgaard BG, Tybjaerg‐Hansen A. Extreme bilirubin levels as a causal risk factor for symptomatic gallstone disease. JAMA Intern Med. 2013;173:1222–1228. [DOI] [PubMed] [Google Scholar]
- 22. McArdle PF, Whitcomb BW, Tanner K, Mitchell BD, Shuldiner AR, Parsa A. Association between bilirubin and cardiovascular disease risk factors: using Mendelian randomization to assess causal inference. BMC Cardiovasc Disord. 2012;12:16. [DOI] [PMC free article] [PubMed] [Google Scholar]
- 23. von Elm E, Altman DG, Egger M, Pocock SJ, Gotzsche PC, Vandenbroucke JP. The strengthening the reporting of observational studies in epidemiology (STROBE) statement: guidelines for reporting observational studies. J Clin Epidemiol. 2008;61:344–349. [DOI] [PubMed] [Google Scholar]
- 24. Lambers Heerspink HJ, Brantsma AH, de Zeeuw D, Bakker SJ, de Jong PE, Gansevoort RT; PREVEND Study Group . Albuminuria assessed from first‐morning‐void urine samples versus 24‐hour urine collections as a predictor of cardiovascular morbidity and mortality. Am J Epidemiol. 2008;168:897–905. [DOI] [PubMed] [Google Scholar]
- 25. Kunutsor SK, Bakker SJ, Kootstra‐Ros JE, Gansevoort RT, Dullaart RP. Circulating gamma glutamyltransferase and prediction of cardiovascular disease. Atherosclerosis. 2014;238:356–364. [DOI] [PubMed] [Google Scholar]
- 26. Ehret GB, Munroe PB, Rice KM, et al Genetic variants in novel pathways influence blood pressure and cardiovascular disease risk. Nature. 2011;478:103–109. [DOI] [PMC free article] [PubMed] [Google Scholar]
- 27. Surendran P, Drenos F, Young R, et al Trans‐ancestry meta‐analyses identify rare and common variants associated with blood pressure and hypertension. Nat Genet. 2016;48:1151–1161. [DOI] [PMC free article] [PubMed] [Google Scholar]
- 28. Borggreve SE, Hillege HL, Dallinga‐Thie GM, de Jong PE, Wolffenbuttel BH, Grobbee DE, van Tol A, Dullaart RP; PREVEND Study Group . High plasma cholesteryl ester transfer protein levels may favour reduced incidence of cardiovascular events in men with low triglycerides. Eur Heart J. 2007;28:1012–1018. [DOI] [PubMed] [Google Scholar]
- 29. Dullaart RP, Perton F, van der Klauw MM, Hillege HL, Sluiter WJ; PREVEND Study Group . High plasma lecithin:cholesterol acyltransferase activity does not predict low incidence of cardiovascular events: possible attenuation of cardioprotection associated with high HDL cholesterol. Atherosclerosis. 2010;208:537–542. [DOI] [PubMed] [Google Scholar]
- 30. Corsetti JP, Bakker SJ, Sparks CE, Dullaart RP. Apolipoprotein A‐II influences apolipoprotein E‐linked cardiovascular disease risk in women with high levels of HDL cholesterol and C‐reactive protein. PLoS One. 2012;7:e39110. [DOI] [PMC free article] [PubMed] [Google Scholar]
- 31. Inker LA, Schmid CH, Tighiouart H, Eckfeldt JH, Feldman HI, Greene T, Kusek JW, Manzi J, Van Lente F, Zhang YL, Coresh J, Levey AS; CKD‐EPI Investigators. Estimating glomerular filtration rate from serum creatinine and cystatin C. N Engl J Med. 2012;367:20–29. [DOI] [PMC free article] [PubMed] [Google Scholar]
- 32. Executive summary of the Third Report of the National Cholesterol Education Program (NCEP) expert panel on detection, evaluation, and treatment of high blood cholesterol in adults (adult treatment panel III). JAMA. 2001;285:2486–2497. [DOI] [PubMed] [Google Scholar]
- 33. Therneau TM, Grambsch PM. Modeling Survival Data: Extending the Cox Model. New York: Springer; 2000. [Google Scholar]
- 34. Easton DF, Peto J, Babiker AG. Floating absolute risk: an alternative to relative risk in survival and case‐control analysis avoiding an arbitrary reference group. Stat Med. 1991;10:1025–1035. [DOI] [PubMed] [Google Scholar]
- 35. Kunutsor SK, Khan H, Nyyssonen K, Laukkanen JA. Lipoprotein(a) and risk of sudden cardiac death in middle‐aged Finnish men: a new prospective cohort study. Int J Cardiol. 2016;220:718–725. [DOI] [PubMed] [Google Scholar]
- 36. Heeringa SG, West BT, Berglund PA. Applied Survey Data Analysis. Boca Raton, FL Florida: Chapman & Hall/CRC; 2010. [Google Scholar]
- 37. Staley JR, Blackshaw J, Kamat MA, Ellis S, Surendran P, Sun BB, Paul DS, Freitag D, Burgess S, Danesh J, Young R, Butterworth AS. PhenoScanner: a database of human genotype‐phenotype associations. Bioinformatics. 2016;32:3207–3209. [DOI] [PMC free article] [PubMed] [Google Scholar]
- 38. Djoussé L, Levy D, Cupples LA, Evans JC, D'Agostino RB, Ellison RC. Total serum bilirubin and risk of cardiovascular disease in the Framingham offspring study. Am J Cardiol. 2001;87:1196–1200; A4, 7. [DOI] [PubMed] [Google Scholar]
- 39. Abraham NG, Junge JM, Drummond GS. Translational significance of heme oxygenase in obesity and metabolic syndrome. Trends Pharmacol Sci. 2016;37:17–36. [DOI] [PMC free article] [PubMed] [Google Scholar]
- 40. Ceriello A. Possible role of oxidative stress in the pathogenesis of hypertension. Diabetes Care. 2008;31(Suppl 2):S181–S184. [DOI] [PubMed] [Google Scholar]
- 41. Rodrigo R, Gonzalez J, Paoletto F. The role of oxidative stress in the pathophysiology of hypertension. Hypertens Res. 2011;34:431–440. [DOI] [PubMed] [Google Scholar]
- 42. Kitiyakara C, Wilcox CS. Antioxidants for hypertension. Curr Opin Nephrol Hypertens. 1998;7:531–538. [DOI] [PubMed] [Google Scholar]
- 43. Bouloumie A, Bauersachs J, Linz W, Scholkens BA, Wiemer G, Fleming I, Busse R. Endothelial dysfunction coincides with an enhanced nitric oxide synthase expression and superoxide anion production. Hypertension. 1997;30:934–941. [DOI] [PubMed] [Google Scholar]
- 44. Gryglewski RJ, Palmer RM, Moncada S. Superoxide anion is involved in the breakdown of endothelium‐derived vascular relaxing factor. Nature. 1986;320:454–456. [DOI] [PubMed] [Google Scholar]
- 45. Reckelhoff JF, Romero JC. Role of oxidative stress in angiotensin‐induced hypertension. Am J Physiol Regul Integr Comp Physiol. 2003;284:R893–R912. [DOI] [PubMed] [Google Scholar]
- 46. Ohnaka K, Kono S. Bilirubin, cardiovascular diseases and cancer: epidemiological perspectives. Expert Rev Endocrinol Metab. 2010;5:891–904. [DOI] [PubMed] [Google Scholar]
- 47. Lanone S, Bloc S, Foresti R, Almolki A, Taille C, Callebert J, Conti M, Goven D, Aubier M, Dureuil B, El‐Benna J, Motterlini R, Boczkowski J. Bilirubin decreases nos2 expression via inhibition of NAD(P)H oxidase: implications for protection against endotoxic shock in rats. FASEB J. 2005;19:1890–1892. [DOI] [PubMed] [Google Scholar]
- 48. Jiang F, Roberts SJ, Datla SR, Dusting GJ. NO modulates NADPH oxidase function via heme oxygenase‐1 in human endothelial cells. Hypertension. 2006;48:950–957. [DOI] [PubMed] [Google Scholar]
- 49. Sano K, Nakamura H, Matsuo T. Mode of inhibitory action of bilirubin on protein kinase C. Pediatr Res. 1985;19:587–590. [DOI] [PubMed] [Google Scholar]
- 50. Nakagami T, Toyomura K, Kinoshita T, Morisawa S. A beneficial role of bile pigments as an endogenous tissue protector: anti‐complement effects of biliverdin and conjugated bilirubin. Biochim Biophys Acta. 1993;1158:189–193. [DOI] [PubMed] [Google Scholar]
- 51. Harrison DG, Guzik TJ, Lob HE, Madhur MS, Marvar PJ, Thabet SR, Vinh A, Weyand CM. Inflammation, immunity, and hypertension. Hypertension. 2011;57:132–140. [DOI] [PMC free article] [PubMed] [Google Scholar]
- 52. Erdogan D, Gullu H, Yildirim E, Tok D, Kirbas I, Ciftci O, Baycan ST, Muderrisoglu H. Low serum bilirubin levels are independently and inversely related to impaired flow‐mediated vasodilation and increased carotid intima‐media thickness in both men and women. Atherosclerosis. 2006;184:431–437. [DOI] [PubMed] [Google Scholar]
- 53. Rossi R, Chiurlia E, Nuzzo A, Cioni E, Origliani G, Modena MG. Flow‐mediated vasodilation and the risk of developing hypertension in healthy postmenopausal women. J Am Coll Cardiol. 2004;44:1636–1640. [DOI] [PubMed] [Google Scholar]
- 54. Ryter SW, Alam J, Choi AM. Heme oxygenase‐1/carbon monoxide: from basic science to therapeutic applications. Physiol Rev. 2006;86:583–650. [DOI] [PubMed] [Google Scholar]
- 55. Motterlini R, Otterbein LE. The therapeutic potential of carbon monoxide. Nat Rev Drug Discov. 2010;9:728–743. [DOI] [PubMed] [Google Scholar]
- 56. Duckers HJ, Boehm M, True AL, Yet SF, San H, Park JL, Clinton Webb R, Lee ME, Nabel GJ, Nabel EG. Heme oxygenase‐1 protects against vascular constriction and proliferation. Nat Med. 2001;7:693–698. [DOI] [PubMed] [Google Scholar]
- 57. Dulak J, Deshane J, Jozkowicz A, Agarwal A. Heme oxygenase‐1 and carbon monoxide in vascular pathobiology: focus on angiogenesis. Circulation. 2008;117:231–241. [DOI] [PMC free article] [PubMed] [Google Scholar]
- 58. O'Malley SS, Wu R, Mayne ST, Jatlow PI. Smoking cessation is followed by increases in serum bilirubin, an endogenous antioxidant associated with lower risk of lung cancer and cardiovascular disease. Nicotine Tob Res. 2014;16:1145–1149. [DOI] [PMC free article] [PubMed] [Google Scholar]
- 59. Swift DL, Johannsen NM, Earnest CP, Blair SN, Church TS. Effect of different doses of aerobic exercise training on total bilirubin levels. Med Sci Sports Exerc. 2012;44:569–574. [DOI] [PMC free article] [PubMed] [Google Scholar]
- 60. McCarty MF. “Iatrogenic Gilbert syndrome”—a strategy for reducing vascular and cancer risk by increasing plasma unconjugated bilirubin. Med Hypotheses. 2007;69:974–994. [DOI] [PubMed] [Google Scholar]
- 61. Peterson SJ, Frishman WH, Abraham NG. Targeting heme oxygenase: therapeutic implications for diseases of the cardiovascular system. Cardiol Rev. 2009;17:99–111. [DOI] [PubMed] [Google Scholar]
- 62. Targher G. Risk of ischemic stroke and decreased serum bilirubin levels: is there a causal link? Arterioscler Thromb Vasc Biol. 2014;34:702–704. [DOI] [PubMed] [Google Scholar]
- 63. Franchini M, Targher G, Lippi G. Serum bilirubin levels and cardiovascular disease risk: a Janus Bifrons? Adv Clin Chem. 2010;50:47–63. [DOI] [PubMed] [Google Scholar]
- 64. Koeth RA, Wang Z, Levison BS, Buffa JA, Org E, Sheehy BT, Britt EB, Fu X, Wu Y, Li L, Smith JD, DiDonato JA, Chen J, Li H, Wu GD, Lewis JD, Warrier M, Brown JM, Krauss RM, Tang WH, Bushman FD, Lusis AJ, Hazen SL. Intestinal microbiota metabolism of L‐carnitine, a nutrient in red meat, promotes atherosclerosis. Nat Med. 2013;19:576–585. [DOI] [PMC free article] [PubMed] [Google Scholar]
- 65. Vermeer SE, van Dijk EJ, Koudstaal PJ, Oudkerk M, Hofman A, Clarke R, Breteler MM. Homocysteine, silent brain infarcts, and white matter lesions: the Rotterdam Scan Study. Ann Neurol. 2002;51:285–289. [DOI] [PubMed] [Google Scholar]
- 66. Ong KL, Allison MA, Cheung BM, Wu BJ, Barter PJ, Rye KA. The relationship between total bilirubin levels and total mortality in older adults: the United States National Health and Nutrition Examination Survey (NHANES) 1999–2004. PLoS One. 2014;9:e94479. [DOI] [PMC free article] [PubMed] [Google Scholar]
- 67. Smabrekke B, Rinde LB, Hindberg K, Hald EM, Vik A, Wilsgaard T, Lochen ML, Njolstad I, Mathiesen EB, Hansen JB, Braekkan S. Atherosclerotic risk factors and risk of myocardial infarction and venous thromboembolism; time‐fixed versus time‐varying analyses. The Tromso Study. PLoS One. 2016;11:e0163242. [DOI] [PMC free article] [PubMed] [Google Scholar]
- 68. Horvei LD, Grimnes G, Hindberg K, Mathiesen EB, Njolstad I, Wilsgaard T, Brox J, Braekkan SK, Hansen JB. C‐reactive protein, obesity, and the risk of arterial and venous thrombosis. J Thromb Haemost. 2016;14:1561–1571. [DOI] [PubMed] [Google Scholar]
- 69. Bosma PJ, van der Meer IM, Bakker CT, Hofman A, Paul‐Abrahamse M, Witteman JC. UGT1A1*28 allele and coronary heart disease: the Rotterdam Study. Clin Chem. 2003;49:1180–1181. [DOI] [PubMed] [Google Scholar]
- 70. Bruckert E, Labreuche J, Amarenco P. Meta‐analysis of the effect of nicotinic acid alone or in combination on cardiovascular events and atherosclerosis. Atherosclerosis. 2010;210:353–361. [DOI] [PubMed] [Google Scholar]
Associated Data
This section collects any data citations, data availability statements, or supplementary materials included in this article.
Supplementary Materials
Table S1. STROBE 2007 Statement—Checklist of Items That Should Be Included in Reports of Cohort Studies
Table S2. Association of Baseline Total Bilirubin Levels With Incident Hypertension in Several Sensitivity Analyses
Table S3. Association of Baseline Total Bilirubin Levels With Incident Hypertension Using Complex Survey Analyses
Figure S1. Frequency distribution of plasma total bilirubin in the study sample.
Figure S2. Hazard ratios for incident hypertension using multivariate‐adjusted fractional polynomials.