

Abstract
Background
Atherosclerosis progression during aging culminates in the development of vulnerable plaques, which may increase the risk of cardiovascular events. Increased generation and/or decreased scavenging of reactive oxygen species in the vascular wall are major contributors to atherogenesis. We previously showed that superoxide dismutase 2 deficiency increased vascular oxidative stress and reduced aortic compliance in aged wild‐type mice and that young Apoe −/−/Sod2 +/− had increased mitochondrial DNA damage and atherosclerosis versus young Apoe −/− mice. Here we investigated the effects of superoxide dismutase 2 deficiency on atherosclerosis progression and plaque morphology in middle‐aged Apoe −/− mice.
Methods and Results
Compared with Apoe −/−, middle‐aged Apoe −/−/Sod2 +/− mice had increased vascular wall reactive oxygen species (P<0.05) and higher atherosclerotic lesion area (P<0.001). The atherosclerotic plaques in middle‐aged Apoe −/−/Sod2 +/− mice had an increased necrotic core with higher inflammatory cell infiltration, a thinned fibrous cap with depleted smooth muscle content, and intraplaque hemorrhage. In addition, the plaque shoulder area had higher levels of calpain‐2, caspase‐3, and matrix metalloproteinase‐2 in intimal smooth muscle cells and depleted fibrous cap collagen. Targeting mitochondrial reactive oxygen species with MitoTEMPO attenuated features of atherosclerotic plaque vulnerability in middle‐aged Apoe −/−/Sod2 +/− mice by lowering expression of calpain‐2, caspase‐3, and matrix metalloproteinase‐2 and decreasing smooth muscle cell apoptosis and matrix degradation.
Conclusions
Enhanced mitochondrial oxidative stress under hyperlipidemic conditions in aging induces plaque instability, in part by increasing smooth muscle cell apoptosis, necrotic core expansion, and matrix degradation. Targeting mitochondrial reactive oxygen species or its effectors may be a viable therapeutic strategy to prevent aging‐associated and oxidative stress–related atherosclerosis complications.
Keywords: atherosclerosis, calpains, DNA damage, fibroatheroma, mitochondria, oxidative stress
Subject Categories: Animal Models of Human Disease, Cell Signalling/Signal Transduction, Oxidant Stress, Vascular Biology, Pathophysiology
Clinical Perspective
What Is New?
Vascular mitochondrial oxidative stress increases with aging under hyperlipidemic conditions, resulting in enhanced atherosclerotic plaque inflammation, necrotic core and fibrous cap remodeling, and susceptibility to rupture.
Selective targeting of mitochondrial reactive oxygen species with a superoxide dismutase mimetic attenuated features of atherosclerotic plaque instability in aging hypercholesterolemic mice.
What Are the Clinical Implications?
Screening and monitoring of elderly coronary artery disease patients for mitochondrial oxidative stress markers such as mitochondrial DNA damage may help identify individuals with vulnerable plaques and increased risk of adverse cardiovascular events.
Using mitochondria‐targeted antioxidants as adjunct therapy to traditional coronary artery disease treatments may prevent atherosclerotic plaque destabilization and reduce atherosclerosis complications.
Cardiovascular diseases, including atherosclerosis and its sequelae, are leading causes of death in the Western world. Together, ischemic heart disease and stroke were responsible for over 10 million deaths globally in 20131 and for 1 in 3 deaths in the United States.2 Atherosclerotic plaque temporal changes are characterized by progression from pathological intimal thickening to fibroatheroma to thin‐cap fibroatheroma and, ultimately, to plaque rupture and thrombus formation.3 The culprit plaque, often described as unstable or vulnerable plaque, is characterized by a large necrotic core and a thin fibrous cap infiltrated with macrophages and lymphocytes and with the absence of or a few smooth muscle cells (SMC).4, 5 The pathophysiology of vulnerable atherosclerotic plaque has been extensively studied; however, the exact molecular mechanisms of plaque progression and the triggers of plaque rupture remain largely unknown.
Aging is one of the major nonmodifiable risk factors for atherosclerosis and related vascular complications. The prevalence of coronary heart disease is 10‐fold greater in the 40‐ to 59‐year age group than in the 20‐ to 39‐year age group, increasing linearly in the older population.2 Similarly, the prevalence of cardiovascular disease is 4‐fold greater in the 40‐ to 59‐year group versus the 20‐ to 39‐year age group, increasing rapidly in the older population, albeit in a nonlinear fashion. Cardiovascular aging is associated with chronic vascular inflammation and dysfunction, extensive extracellular matrix remodeling, and fibrotic changes.6, 7 At the cellular level, aging results in enhanced oxidative stress and macromolecular damage, increased cell proliferation, senescence, and apoptosis. Further, increased levels of reactive oxygen species (ROS) in the vascular wall were implicated as causative during all clinical stages of atherosclerosis.8 Consistent with this, aging was associated with increased cellular and mitochondrial ROS (mtROS) in the vascular cells and augmented atherosclerotic lesions with enhanced macrophage infiltration in hypercholesterolemic mice.9 Further, aging‐associated mitochondrial oxidative stress (mtOS) resulted in mitochondrial DNA (mtDNA) damage, mitochondrial and vascular dysfunction, and atherosclerosis.10, 11 The cellular redox balance in aging vasculature shifts toward decreased levels of antioxidant enzymes, including mitochondrial superoxide dismutase 2 (SOD2).12 We previously showed that SOD2 deficiency in aging mice results in vascular SMC apoptosis and matrix remodeling, leading to increased vascular and cardiac dysfunction.13 Additionally, middle‐aged Apoe −/− mice fed a Western diet had increased mtROS levels, and treatment with MitoTEMPO, a mitochondrial antioxidant, decreased atherosclerosis and preserved vascular and cardiac function.9
The current study investigated whether SOD2 deficiency in oxidative stress‐ and atherosclerosis‐prone middle‐aged Apoe −/− mice exacerbates atherosclerotic plaque burden and induces plaque instability, using young (4‐month‐old) and middle‐aged (16‐month old) Apoe −/− and Apoe −/−/Sod2 +/− mice fed a high‐fat diet. We found that SOD2 deficiency in middle‐aged Apoe −/− mice further increased mtROS levels, nuclear and mtDNA damage, mitochondrial dysfunction, activation of calcium‐sensitive proteases, SMC apoptosis, and progressive expansion of atherosclerotic lesions with features of vulnerable plaque. In addition, pharmacological targeting of mtROS in middle‐aged Apoe −/− and Apoe −/−/Sod2 +/− mice attenuated atherosclerosis and improved plaque stability, implicating mitochondrial dysfunction in aging‐associated atherosclerotic complications under hyperlipidemic conditions.
Methods
Animals
All procedures were performed in compliance with protocols approved by the University of Michigan Institutional Animal Care and Use Committee in accordance with NIH guidelines. All mice were purchased from Jackson Laboratory (Bar Harbor, ME). Male wild‐type, Sod2 +/− (B6.129S7‐Sod2 tm1Leb/J), Apoe −/− (B6.129P2‐Apoe tm1Unc/J), and Apoe −/−/Sod2 +/− mice were bred on the C57BL/6J background. Experimental mice were generated from breeding heterozygous mice, and genotypes were confirmed by polymerase chain reaction. Mice were housed in specific pathogen‐free rooms in ventilated cages at 22°C with 12‐hour light/dark cycles and free access to food and water. Animals (n=16 per group) were fed standard rodent chow for 1 (young) or 13 months (middle‐aged) and then switched to the Western diet (Harlan Teklad TD.88137; Envigo, Madison, WI) for 3 months.
Mice were treated with MitoTEMPO (Sigma‐Aldrich, St. Louis, MO) at 1500 μg/kg per day for 12 weeks as described previously.9 Briefly, at 13 months of age mice were randomly assigned to a MitoTEMPO or a vehicle treatment group (n=12). Microosmotic pumps (ALZET 1004; Durect, Cupertino, CA) were implanted subcutaneously under 2% inhaled isoflurane/O2 anesthesia. The pumps were replaced every 4 weeks. Mice were fed the Western diet for the duration of the experiment.
Vascular SMC Isolation, Culture, and siRNA Transfection
The SMC were isolated from aortas of 4‐ and 16‐month old wild‐type and Sod2 +/− mice as described before.9 Aortas from 3 to 4 animals were pooled together as 1 isolate, and 2 to 3 different isolates were used in 3 to 4 independent experiments. Cells were grown in DMEM supplemented with 10% fetal bovine serum and an antibiotic‐antimycotic in a 5% CO2 incubator at 37°C. Cells were used between passages 3 and 10.
Mouse Capn2 ON‐TARGET plus SMARTpool siRNA (L‐043027‐00) and nontargeting siRNA control (D‐001810‐01) were purchased from Dharmacon (GE Healthcare, Pittsburgh, PA). Cells were transfected using p5RHH peptide‐siRNA nanocomplexes as described before.14 Briefly, nanocomplexes were prepared by mixing p5RHH peptide and siRNA oligo at 1:200 in Opti‐MEM medium and incubating for 40 minutes at 37°C. Vascular SMC (VSMC) were grown in 6‐well plates to 70% confluence, quiesced overnight in DMEM, incubated with nanocomplexes for 4 hours at 37°C, and then treated with tumor necrosis factor α plus interferon γ (TNFα+IFNγ) or vehicle for 16 hours. Efficiency of siRNA knockdown was confirmed by Western blot analysis.
Histology and Immunostaining
Mice were euthanized with inhaled isoflurane and perfused with phosphate‐buffered saline through a cardiac puncture. Aortas were dissected, opened longitudinally, pinned on black wax, stained with oil red O and 0.1% toluidine blue, and imaged. Alternatively, aortas were fresh frozen in OCT compound (Sakura Finetek, Torrance, CA), and transverse serial sections were cut at 10‐μm thickness every 100 μm through aortic arch and descending thoracic aorta. Frozen tissue sections were stained with oil red O, Verhoeff picrosirius red, or hematoxylin and eosin, imaged, and analyzed with NIH ImageJ 1.49 (Bethesda, MD).
Immunohistochemistry and immunofluorescence were performed as described previously.9 Consecutive adjacent sections from ascending aorta and aortic arch were stained for various markers, and representative images from several mice (n=6‐8) were selected. The antibodies used were against CD11b (Abnova, Walnut, CA), α‐smooth muscle actin, CD3γ (Abcam, Cambridge, MA), α‐smooth muscle actin FITC‐conjugated (Sigma‐Aldrich, St. Louis, MO), calpain‐2 large subunit, cleaved caspase‐3 (Cell Signaling Technology, Danvers, MA), matrix metalloproteinase 2 (MMP2), ATP5G2, VCAM1, CD68 Cy3‐conjugated (Bioss, Woburn, MA), 8‐hydroxyguanosine (8‐OHdG), erythroid cell antibody (TER119) and Alexa Fluor 594 goat anti‐rabbit IgG, Alexa Fluor 488 goat anti‐rabbit IgG, or Alexa Fluor 568 rabbit anti‐goat IgG (Thermo Scientific, Waltham, MA). Sections were mounted with Vectastain mounting medium for fluorescence with 4′,6‐diamidino‐2‐phenylindole (DAPI) (Vector Laboratories, Burlingame, CA). Fluorescence or bright‐field images were acquired with a Nikon Microphot‐FX microscope at the same exposure, gain, and offset. Fluorescent images for each color channel were merged using Adobe Photoshop CC. Fluorescence intensity was determined by integrated density (mean gray value per area) measured with NIH ImageJ in the defined region of interest (ROI) and adjusted to the number of cell nuclei within the ROI. In the images stained for calpain‐2 and cleaved caspase‐3 ROI included the fibrocellular cap at the plaque shoulder region and adjacent media. In the images stained for MMP2 ROI included fibrous cap, neointima, and adjacent media at the plaque shoulder region.
In the images of the aortic section stained for 8‐OHdG and counterstained with DAPI, nuclei positive for 8‐OHdG were pseudocolored green and counted as a fraction of total nuclei number per section. In the images of the aortic sections costained for 8‐OHdG, ATP5G2, and DAPI, the cells with nonnuclear 8‐OHdG and mitochondrial colocalization were counted as a fraction of total cell number per section.15
Western Blot Analysis
Western blot analysis was performed as described.9 Primary antibodies used were against calpain‐1 (Thermo Scientific), calpain‐2 large subunit, cleaved caspase‐3 (Asp175), MMP2, phospho‐H2AX (Cell Signaling Technology), and β‐actin (Sigma‐Aldrich). With use of appropriate secondary horseradish peroxidase–conjugated antibody, protein bands were visualized with chemiluminescent reagent on x‐ray film. Densitometric quantification was performed using NIH ImageJ 1.49.
ROS Detection
Aortic wall ROS were detected with DHE and MitoSOX Red fluorescence as described previously.9 Fluorescence images were taken using a Nikon Microphot‐FX microscope with 510 nm excitation/580 nm emission filters. Grayscale images were analyzed with NIH ImageJ 1.49 software to determine mean gray value per area of the plaque and adjacent media (integrated density).
The cellular superoxide levels were determined with HPLC detection of 2‐hydroxyethidium as described before.9, 16 Briefly, after treatments VSMC were incubated with 50 μmol/L of DHE (Thermo Scientific), harvested in acetonitrile, and supernatants dried using Savant ISS 100 (Thermo Scientific). Samples were dissolved in PBS and analyzed with an Agilent 1100 HPLC system equipped with a Partisil 5 μm ODS3 250×4.6 mm column (Phenomenex, Torrance, CA). Quantification was performed using the 2‐hydroxyethidium standard (Noxygen Science Transfer & Diagnostics GmbH, Elzach, Germany).
TUNEL Assay
Transverse aortic sections were terminal deoxynucleotidyl transferase dUTP nick end labeling (TUNEL) stained using an In Situ Cell Death Detection Kit (Roche, Indianapolis, IN) following the manufacturer's protocol. Briefly, sections were fixed in 4% paraformaldehyde, permeabilized in 0.1% Triton X‐100, and incubated with a mixture of terminal deoxynucleotidyl transferase and labeled nucleotides. Sections were mounted with Vectastain mounting medium for fluorescence with DAPI (Vector Laroratories, Burlingame, CA). Fluorescence images were acquired with a Nikon Microphot‐FX microscope and analyzed using NIH ImageJ 1.49 software. In the analyzed images TUNEL‐positive nuclei were pseudocolored green and counted as a fraction of total number of nuclei within the plaque.
In Situ Zymography
The MMP activity in the aortic wall was determined as described previously.17 Briefly, fresh frozen aortic sections were incubated with 20 μg/mL of DQ gelatin conjugated to fluorescein (Thermo Scientific) for 30 minutes at 37°C. The enzymatic activity of metalloproteinase in situ results in accumulation of highly fluorescent peptides. Fluorescent images were acquired with a Nikon Microphot‐FX microscope using 495 nm excitation/515 nm emission filters. Fluorescence intensity was determined using NIH ImageJ by measuring integrated density normalized to the number of cell nuclei within the defined ROI that included fibrous cap, neointima and adjacent media at the plaque shoulder region.
Mitochondrial Protein Carbonyl Content and Mitochondrial Function
Mitochondria were isolated from VSMC of 4‐ and 16‐month‐old wild‐type and Sod2 +/− mice using the Mitochondria Isolation Kit for Cultured Cells (Thermo Scientific) and protein carbonyl concentration was measured using the Protein Carbonyl Assay Kit (Cayman Chemical Company, Ann Arbor, MI) according to the manufacturer's protocol.
Mitochondrial complex I activity was determined by measuring the reduction of NADH‐sensitive Epsilon dye at 450 nm using Complex I Enzyme Activity Microplate Assay Kit (Abcam) following the manufacturer's protocol. Mitochondrial complex III activity was determined in isolated mitochondria by measuring the reduction of cytochrome C at 550 nm with antimycin A‐specific activity subtracted from the total activity to calculate complex III‐specific activity, as described in.9, 18
Plasma Sample Collection, Clinical Biochemistry Tests and Free 8‐Isoprostane Levels
Plasma samples were collected from anesthetized mice through cardiac puncture as described previously.19 Plasma lipid levels were measured using the AMS Lyasis 330 Clinical Chemistry System (AMS Diagnostics, Weston, FL). Plasma ALT, creatinine, and BUN were measured on an Automated Chemical Analyzer VT350 (Johnson & Johnson, New Brunswick, NJ). Plasma levels of free 8‐isoprostane were determined with the EIA kit (Cayman Chemical) according to the manufacturer's protocol.
Statistical Analysis
All analyses were performed using JMP Pro 11.0.0 (SAS Institute, Cary, NC) or Prism 7 (GraphPad Software, La Jolla, CA). All data were tested for normality using the Shapiro–Wilk test. The data were transformed using square root, logarithm or a reciprocal transformation until the goodness‐of‐fit test was no longer reaching significance. Transformed data were analyzed by one‐way ANOVA following multiple comparisons with correction using the Newman–Keuls test or repeated measures ANOVA, without assuming sphericity, and with Greenhouse–Geisser correction when multiple measurements were made in the same animals. The untransformed data were reported in the results. Data that did not pass the normality test were analyzed by nonparametric test with correction for multiple comparisons using Dunn's test. Two‐way ANOVA was used to test for the effect of interaction between genotype and age on atherosclerotic plaque parameters. Differences were considered significant at P<0.05.
Results
Middle‐Aged Apoe −/− Mice With SOD2 Deficiency Develop Extensive, Advanced Atherosclerotic Lesions and Show Enhanced Vascular and mtROS Levels and DNA Damage
To test the role of impaired mitochondrial antioxidant defense on atherogenesis in aging, we examined the atherosclerotic plaque burden in young and middle‐aged Apoe −/− and Apoe −/−/Sod2 +/− mice that were fed a Western diet. Experimental reduction in SOD2 protein levels increased atherosclerosis under hyperlipidemic conditions in both young and middle‐aged Apoe −/− mice. Aortic atherosclerotic lesion size increased by 60% in young Apoe −/−/Sod2 +/− compared to young Apoe −/− mice, as previously reported by us11 and by 54% in middle‐aged Apoe −/−/Sod2 +/− compared to middle‐aged Apoe −/− mice (Figure 1A). Aging significantly increased the atherosclerotic burden as middle‐aged Apoe −/− had a 250% increase in aortic atherosclerotic lesion size compared to young Apoe −/− mice, similar to our earlier findings.9 Likewise, lifelong deficiency in SOD2 protein levels exacerbated aortic atherosclerosis as lesion size increased by 240% in middle‐aged compared to young Apoe −/−/Sod2 +/− mice (Figure 1A). Moreover, middle‐aged Apoe −/−/Sod2 +/− mice had the highest aortic atherosclerotic plaque burden, ≈50% of total aortic area. In addition, 2‐way ANOVA demonstrated a significant interaction between the effects of aging and SOD2 deficiency on atherosclerotic lesion size (P=0.0102).
Figure 1.
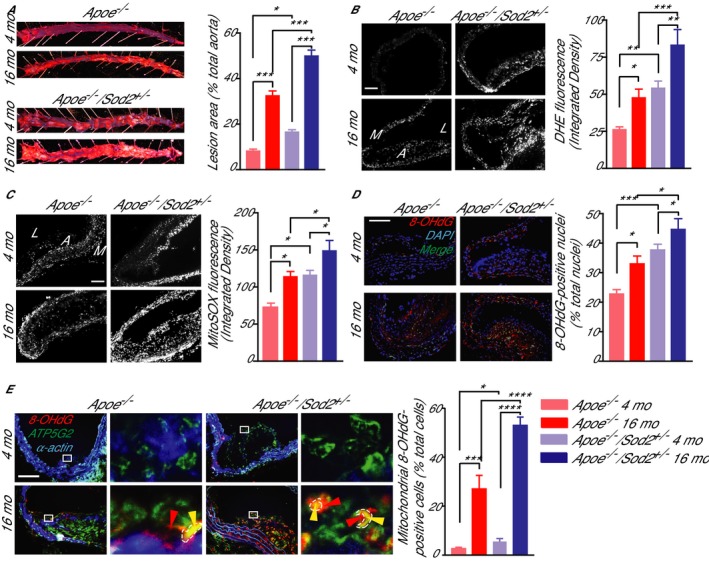
Aortic atherosclerosis burden, aortic wall ROS levels and morphology in young and middle‐aged Apoe −/−/Sod2 +/− compared with Apoe −/− mice. A, Representative images of oil red O–stained aortas and the atherosclerotic lesion area from 4‐ and 16‐month‐old mice fed a Western diet for 3 months and atherosclerotic lesion area quantification (mean±SEM, n=8). B and C, Representative images of mouse aorta transverse sections stained with DHE (B) or MitoSOX red (C) and quantification of DHE and MitoSOX red fluorescence (mean±SEM, n=8). D, Representative images of aortic transverse sections stained for 8‐OHdG (red) and DAPI (blue) and quantification of percentage of 8‐OHdG‐positive nuclei (green) (mean±SEM, n=9). E, Representative images of aortic transverse sections stained for 8‐OHdG (red), ATP5G2 (green), and smooth muscle α‐actin (blue) and quantification of nonnuclear mitochondria‐localized 8‐OHdG‐positive cells (mean±SEM, n=7). High magnification of insets (white rectangle) to the right show nuclear (red arrowheads) and mitochondrial (marked in dashed line and by yellow arrowheads) localized 8‐OHdG staining. *P<0.05; **P<0.01; ***P<0.001; ****P<0.0001. DHE indicates dihydroethidium; mo, months; ROS, reactive oxygen species; SEM, standard error of the mean.
To assess the interactive effects of aging, SOD2 deficiency, and hypercholesterolemia on overall vascular ROS levels, we determined aortic wall dihydroethidium fluorescence in young and middle‐aged Apoe −/− and Apoe −/−/Sod2 +/− mice fed a Western diet. Vascular ROS levels increased by 88% in middle‐aged compared to young Apoe −/− mice and by 54% in middle‐aged compared to young Apoe −/−/Sod2 +/− mice (Figure 1B). SOD2 protein deficiency increased ROS levels by 108% in young Apoe −/− and by 75% in middle‐aged Apoe −/− mice in cells within the media and atherosclerotic lesion cap. The highest vascular ROS levels were present in the middle‐aged Apoe −/−/Sod2 +/− mice fed a Western diet, reflecting the cumulative effect on the vessel wall from the interaction of aging and hypercholesterolemia, the atherosclerotic risk factors, with weakened antioxidant response due to decreased SOD2 expression.
Because mtOS is associated with atherogenesis in both humans and mouse models and mitochondrial antioxidant enzymes regulate mitochondrial oxidative status,9, 10, 20 we measured aortic mtROS levels, using MitoSOX fluorescence, in the aortic walls of young and middle‐aged Apoe −/− and Apoe −/−/Sod2 +/− mice on Western diet. Endogenous mtROS levels were increased in atherosclerotic lesion cap area of middle‐aged Apoe −/− (56% increase versus young Apoe −/−), whereas SOD2 deficiency increased mtROS levels in young Apoe −/−/Sod2 +/− (59% increase versus young Apoe −/−) to the levels similar to middle‐aged Apoe −/− mice (Figure 1C). Smaller but significant increases in mtROS levels were also observed in middle‐aged Apoe −/−/Sod2 +/− compared to middle‐aged Apoe −/− (25%) and young Apoe −/−/Sod2 +/− (22%) mice. As in total vascular ROS levels, mtROS levels were maximum in middle‐aged Apoe −/−/Sod2 +/− compared to other groups, indicating how cellular ROS in general and mtROS in particular contribute to increased atherosclerotic burden in middle‐aged Apoe −/−/Sod2 +/− mice.
Increased DNA damage was reported in human atherosclerotic plaque VSMC, promoting plaque instability.21 To understand the role of increased oxidative stress on atherosclerotic plaque morphology in aging and hypercholesterolemia, we measured nuclear DNA damage by immunostaining aortic cross sections for 8‐hydroxy‐2′‐deoxyguanosine (8‐OHdG), an oxidative DNA damage marker.9 A significant increase in 8‐OHdG‐positive nuclei was observed with age in the aortas of both Apoe −/− and Apoe −/−/Sod2 +/− mice (P<0.05 versus respective young mice; Figure 1D), whereas that number was higher in the aortas of both young and middle‐aged Apoe −/−/Sod2 +/− compared to age‐matched Apoe −/− mice (P<0.001 and P<0.05, respectively). Two‐way ANOVA showed a significant interaction between the effects of aging and genotype (P=0.0096), indicating that increased nuclear DNA damage with age and SOD2 deficiency increases atherosclerotic plaque burden and induces features of plaque instability.
Because increased mtDNA damage was correlated with the plaque size in experimental and human atherosclerosis and considered a causal factor in atherogenesis,11, 22 we also investigated mtDNA damage in young and middle‐aged Apoe −/−/Sod2 +/− mice. Similar to nuclear DNA damage, mtDNA damage, as determined by colocalization of immunoreactive nonnuclear 8‐OHdG and ATP synthase 5 subunit C2 (ATP5G2), a mitochondrial marker, increased with age in the aortas of both Apoe −/− and Apoe −/−/Sod2 +/− and in young and middle‐aged Apoe −/−/Sod2 +/− compared to age‐matched Apoe −/− mice (Figure 1E). MtDNA damage was prominent in VSMC of advanced atherosclerotic plaques and was primarily evident in the fibrous cap area at the plaque shoulder regions. SOD2 deficiency did not affect lipid metabolism (Figure S1), further affirming the direct roles the role of mtOS and mtDNA damage in age‐associated atherosclerosis in hypercholesterolemic settings.
Atherosclerotic Lesions in Middle‐Aged Apoe −/−/Sod2 +/− Mice Exhibit Features of Vulnerable Plaque
To determine whether SOD2 deficiency had an effect on features of atherosclerotic plaque stability in aging under hypercholesterolemic conditions, transverse aortic sections from young and middle‐aged Apoe −/− and Apoe −/−/Sod2 +/− mice were examined for features that affect plaque stability, including increased plaque macrophage infiltration,23, 24 increased T cell content,25 increased necrotic core and decreased fibrous cap thickness,4, 5 decreased plaque SMC content,26 the presence of intraplaque hemorrhage,27 and fibrous cap integrity. First, inflammatory cell infiltration into plaques, as determined by CD11b immunostaining, increased with age in Apoe −/− mice (Figure 2A), as described by us previously.9 Inflammatory cell infiltration was also significantly enhanced in young Apoe −/−/Sod2 +/− compared to young Apoe −/− mice. In contrast, inflammatory cell infiltration into the plaques of 16‐month‐old Apoe −/−/Sod2 +/− was not statistically different from age‐matched Apoe −/− mice. However, middle‐aged Apoe −/−/Sod2 +/− mice had increased activation of inflammatory pathways as indicated by a marked increase in expression of immunoreactive vascular cell adhesion molecule‐1 (VCAM1) in atheroma and medial SMC compared with young and age‐matched Apoe −/− mice (Figure 2B). Second, an increased presence of CD3+ T‐cells was evident in the atheromas of middle‐aged Apoe −/−/Sod2 +/− compared with Apoe −/− mice (Figure 2C), similar to vulnerable plaques in humans.25 Third, necrotic core size, determined by measuring the acellular area, resulting from macrophage apoptosis, in the atherosclerotic plaque cross sections was significantly higher in young Apoe −/−/Sod2 +/− compared with age‐matched Apoe −/− mice (P<0.05), and increased with age in both genotypes (P<0.001) but was significantly higher in middle‐aged Apoe −/−/Sod2 +/− compared to middle‐aged Apoe −/− mice (P<0.05; Figure 2D). Fourth, fibrous cap thickness at the plaque shoulder region, the common site of fibrous cap disruption and plaque rupture,3 was similar in aortas of young Apoe −/− and Apoe −/−/Sod2 +/− mice but increased significantly in middle‐aged Apoe −/− mice (P<0.001; Figure 2E). However, cap thickness was drastically decreased in middle‐aged Apoe −/−/Sod2 +/− versus age‐matched Apoe −/− mice (P<0.01), indicating higher activation of inflammatory pathways and increased extracellular matrix degradation with SOD2 deficiency. A smaller but significant decrease in cap thickness was observed in middle‐aged Apoe −/−/Sod2 +/− when compared to young Apoe −/−/Sod2 +/− mice. Fifth, the SMC content of the plaque, determined by smooth muscle actin immunostaining, was significantly higher in young SOD2‐deficient Apoe −/− mice compared to young Apoe −/− mice (P<0.001; Figure 2F). Similarly, the SMC content increased significantly with age in plaques of Apoe −/− mice (P<0.001). However, atherosclerotic plaques from middle‐aged Apoe −/−/Sod2 +/− mice had a significant decrease in SMC content compared to young Apoe −/−/Sod2 +/− and middle‐aged Apoe −/− mice. For both the fibrous cap thickness and plaque SMC content, 2‐way ANOVA demonstrated a significant interaction between the effects of aging and SOD2 deficiency (P<0.0001), suggesting that the decrease in these plaque morphological features is characteristic of middle‐aged Apoe −/−/Sod2 +/− mice. Sixth, the presence of red blood cells within the plaque, an indicator of intraplaque hemorrhage, was evident only in middle‐aged Apoe −/−/Sod2 +/− mice (Figure 2G). Finally, analysis of atherosclerotic plaque morphology showed that only middle‐aged Apoe −/−/Sod2 +/− mice showed interruption of fibrous cap at the plaque shoulder region without signs of thrombus formation, consistent with a plaque fissure28 (Figure 2H). Together, these data demonstrate that impairment of SOD2 activity in advanced atherosclerosis induces features of an unstable plaque phenotype.
Figure 2.
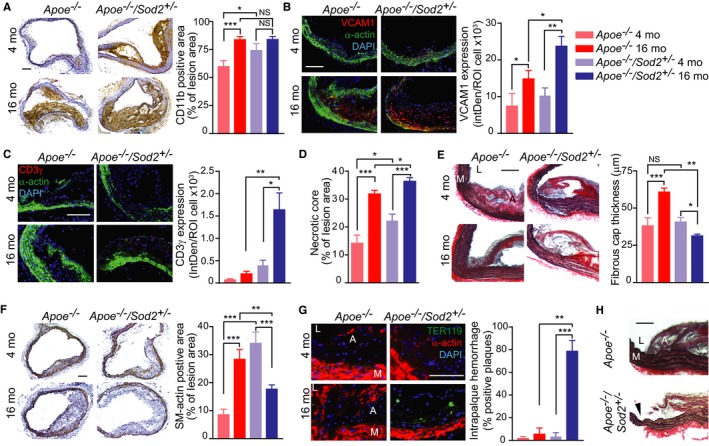
Atherosclerotic plaque morphology in young and middle‐aged Apoe −/− and Apoe −/−/Sod2 +/− mice. A, Representative images of aortic transverse sections were stained for immunoreactive CD11b and inflammatory cell infiltration determined by quantification of the CD11b‐positive staining area (mean±SEM, n=8). B and C, Representative images of aortic transverse sections stained for immunoreactive VCAM1 (B) or CD3γ (C) (red), smooth muscle α‐actin (green), and DAPI (blue) and quantification of VCAM1 (B) or CD3γ (C) expression represented as fluorescence integrated density (IntDen) per number of cells (mean±SEM, n=8). D, Necrotic core size was determined by measuring the acellular fraction of the total plaque area (mean±SEM, n=9). E, Representative images of transverse aortic sections stained with Verhoeff picrosirius red and quantification of the fibrous cap thickness measured at the atherosclerotic plaque shoulder region (mean±SEM, n=8). F, Representative images of transverse sections stained for smooth muscle α‐actin. Atherosclerotic plaque smooth muscle content was quantified by measuring the α‐actin‐positive staining area (mean±SEM, n=8). G, Representative images of aortic sections stained for TER119 (green), smooth muscle α‐actin (red) and DAPI (blue) and quantification of number of transverse aortic sections positive for intraplaque hemorrhage (mean±SEM, n=9). H, Representative images of transverse aortic sections from middle‐aged Apoe −/− and Apoe −/−/Sod2 +/− mice stained with Verhoeff picrosirius red showing interruption of fibrous cap (arrowhead). A indicates atheroma; L, lumen; M, media. Scale is 100 μm. *P<0.05; **P<0.01; ***P<0.001; NS, not significant; SEM, standard error of the mean.
Increase in mtROS With Aging in VSMC of Sod2 +/− Mice Induces Mitochondrial Dysfunction
To understand the mechanisms that regulate VSMC function in the progression of advanced atherosclerotic lesions during aging and to avoid the confounding effects of hypercholesterolemia, we examined mitochondrial function in VSMC isolated from young and middle‐aged wild‐type and Sod2 +/− mice. Because atherosclerotic plaque SMC are exposed to IFNγ secreted by T‐cells and TNFα from activated macrophages in the lesions,29 we first determined the combined effect of these 2 cytokines on VSMC ROS levels by measuring 2‐hydroxyethidium, a superoxide‐specific product of hydroethidine, by HPLC analysis. The TNFα and IFNγ‐induced superoxide levels were significantly higher in the cells from both middle‐aged wild‐type and Sod2 +/− mice compared to their respective young controls (Figure 3A). In addition, SOD2 deficiency significantly enhanced cytokine‐induced superoxide levels in VSMC from middle‐aged wild‐type mice. To determine whether the cytokines exert an effect primarily on mtROS levels, VSMC were treated with the cytokines in the presence and absence of MitoTEMPO.9 MitoTEMPO pretreatment decreased cellular ROS levels to near‐basal levels in all the groups, indicating that the observed increases in superoxide levels in response to various vasoactive agonists in aortic VSMC were of mitochondrial origin. However, MitoTEMPO treatment did not decrease ROS to the basal levels of young mice VSMC, suggesting that extramitochondrial sources of cellular superoxide such as NADPH oxidases, lipoxygenases, and monoamine oxidase may contribute to aging‐associated oxidative stress.
Figure 3.

Increased mtROS results in impaired mitochondrial function in VSMC from 4‐ vs 16‐month‐old Sod2+/− mice. A, Superoxide generation was measured by 2‐OH‐ethidium HPLC analysis in VSMC treated with 100 ng/mL TNFα, 200 ng/mL IFNγ, and/or 10 μmol/L MitoTEMPO. Results were normalized to protein concentration (mean±SEM, n=4). B, Mitochondrial protein carbonyl content was determined in mitochondria isolated from VSMC. Results were normalized to protein concentration (mean±SEM, n=6). C and D, Mitochondrial complex I (C) and complex III (D) activities in VSMC presented as changes in substrate concentration adjusted to protein concentration (mean±SEM, n=4). *P<0.05; **P<0.01; ***P<0.001; ****P<0.0001. HPLC indicates high‐precision liquid chromatography; mo, months; mtROS, mitochondrial reactive oxygen species; SEM, standard error of the mean; VSMC, vascular smooth muscle cells.
The current data showing a significant increase in carbonylation of mitochondrial proteins with age in VSMC from Sod2 +/− mice compared to wild‐type (Figure 3B) are consistent with our prior results, which showed the association of increased mtROS levels with mitochondrial protein oxidative modification during aging.9 Reflecting the increased protein carbonylation, activities of mitochondrial complex I and complex III were significantly lower in VSMC from both middle‐aged wild‐type and Sod2 +/− mice compared with their respective young controls; the SOD2 deficiency had an even greater inhibitory effect on age‐associated decline in complex I and III activities in VSMC (P<0.05 versus wild‐type; Figure 3C and 3D). Together, these data showed that the impaired antioxidant defense system further exacerbates the adverse effects of aging on mitochondrial oxidative burden and function in the aortic vascular cells.
Aging‐Associated Mitochondrial Dysfunction Induces Activation of Calpain‐2 and MMP2 and DNA Damage in VSMC From Sod2 +/− Mice
Calpains are calcium‐sensitive cysteine proteases that regulate inflammation, induce apoptosis, activate MMP2, and facilitate fibrotic changes in aortic wall in aging and atherosclerosis.30, 31 To determine whether SOD2 deficiency and inflammatory cytokines affect calpain expression during aging, we measured calpain‐1 and calpain‐2 expression in VSMC from young and middle‐aged wild‐type and Sod2 +/− mice at basal levels and in response to TNFα+IFNγ treatment. Calpain‐1 expression was 3.5‐fold higher in VSMC from both middle‐aged wild‐type and Sod2 +/− mice compared with their respective controls (Figure 4A). However, TNFα+IFNγ treatment had no significant effect on calpain‐1 expression in VSMC from both young and middle‐aged mice. Basal calpain‐2 expression was higher in VSMC from young Sod2 +/− mice versus wild‐type mice. Its expression increased with age in cells from both groups but was significantly higher in the VSMC from middle‐aged Sod2 +/− than in cells from middle‐aged wild‐type mice (Figure 4A). TNFα+IFNγ treatment caused a robust increase of calpain‐2 protein levels in VSMC from middle‐aged versus young Sod2 +/− mice but had no effect in cells from either young or middle‐aged wild‐type mice, suggesting that increased mitochondrial oxidative stress in aging selectively upregulates vascular calpain‐2 expression (Figure 4A). To determine whether increased calpain‐2 expression regulates VSMC apoptosis, we transfected VSMC with nontargeting siRNA:p5RHH or Capn2 siRNA:p5RHH nanocomplexes14 and measured cleaved caspase‐3 expression by Western analysis. Capn2 siRNA transfection selectively and significantly decreased basal calpain‐2 protein levels in VSMC from middle‐aged wild‐type mice (Figure S2) and TNFα+IFNγ–induced calpain‐2 levels in VSMC from both young and middle‐aged wild‐type and Sod2 +/− mice compared to nontargeting siRNA (Figure 4B). Cleaved caspase‐3 protein levels, which increased with age in both the cell types but significantly in VSMC from Sod2 +/− mice, were attenuated with Capn2 siRNA transfection (Figure 4B). In contrast, Capn2 siRNA transfection had no effect on TNFα+IFNγ–induced cleaved caspase‐3 levels in wild‐type cells. Together, these data show that impaired antioxidant defense in aging activates signaling pathways that affect VSMC viability in the vascular wall.
Figure 4.

Increased mtROS and impaired mitochondrial function result in increased calpain‐2, cleaved caspase‐3, and MMP2 levels in VSMC from middle‐aged Sod2+/− mice. A, Western blot analysis and densitometric quantification of calpain‐1 and calpain‐2 expression in VSMC treated with 100 ng/mL TNFα and 200 ng/mL IFNγ (mean±SEM, n=4). B, Western blot analysis and densitometric quantification of calpain‐2 and cleaved caspase‐3 levels in VSMC treated with TNFα+IFNγ and nontargeting control or Capn2 siRNA (mean±SEM, n=4). C, Western blot analysis and densitometric quantification of MMP2 and phospho‐H2AX levels in VSMC treated with TNFα+ IFNγ and 100 μmol/L PD150606 (mean±SEM, n=4). N represents a number of independent experiments. *P<0.05; **P<0.01; ***P<0.001; ****P<0.0001; MMP indicates matrix metalloproteinase; mo, months; mtROS, mitochondrial reactive oxygen species; NS, not significant; SEM, standard error of the mean; VSMC, vascular smooth muscle cells.
Basal MMP2 protein levels were significantly higher in both young and middle‐aged Sod2 +/− VSMC compared to the wild‐type cells; aging further increasing the protein levels in Sod2 +/− cells (Figure 4C). TNFα+IFNγ treatment had no significant effect on MMP2 protein content in young and middle‐aged wild‐type and young Sod2 +/− VSMC. However, the MMP2 protein content was increased 2.6‐fold in middle‐aged Sod2 +/− VSMC treated with TNFα+IFNγ. Pretreatment of cells with calpain inhibitor PD150606 significantly decreased basal as well as TNFα+IFNγ–induced MMP2 levels in both wild‐type and Sod2 +/− VSMC (Figure 4C), suggesting that calpains are major regulators of MMP2 expression in VSMC.31, 32 Because calpains regulate apoptosis30 and DNA damage induces VSMC apoptosis,33 we asked whether calpain induction regulates DNA damage in VSMC in aging under increased mtOS. Phosphorylation of histone H2AX (γH2AX), a marker of DNA double‐strand breaks and DNA damage response,21 was significantly increased with age in both wild‐type and Sod2 +/− VSMC (Figure 4C). The TNFα+IFNγ treatment had no effect on γH2AX levels in both young and middle‐aged wild‐type and young Sod2 +/− VSMC but caused a significant increase (2.5‐fold) in middle‐aged Sod2 +/− VSMC. Pretreatment with PD150606 decreased γH2AX to near basal levels in middle‐aged Sod2 +/− VSMC, providing evidence for the regulatory role of calpains in DNA damage in VSMC with increased mtOS during aging. Taken together, these data indicate that impaired SOD2 activity in aging might affect features of plaque stability by inducing mitochondrial dysfunction, matrix degradation, and VSMC apoptosis via increased mitochondrial protein oxidation and regulation of calpains, particularly calpain‐2.
Atherosclerotic Plaque Shoulder Regions in Middle‐Aged Apoe −/−/Sod2 +/− Mice Show Increased Calpain‐2 and MMP2 Expression and Matrix Remodeling
It was previously reported that calpain‐2 levels were significantly elevated in low‐density lipoprotein receptor knockout (Ldlr −/−) mice fed a high‐cholesterol diet, and calpain inhibitors suppressed hypercholesterolemia‐induced atherosclerosis and vascular inflammation.34 Further, increased calpain and caspase‐3 activities in isolated perfused hearts were significantly reduced in transgenic mice with cardiac‐specific overexpression of SOD2 compared with hearts of wild‐type mice.35 To determine whether SOD2 deficiency affects features of atherosclerotic plaque stability in aging under hypercholesterolemic conditions by regulating calpain levels, we performed immunofluorescence analysis of calpain‐2 levels in atherosclerotic plaque shoulder regions of young and middle‐aged Apoe −/− and Apoe −/−/Sod2 +/− mice fed a Western diet. SOD2 deficiency markedly increased immunoreactive calpain‐2 expression in plaque shoulder regions in the young and significantly in the middle‐aged Apoe −/− mice (P<0.01 versus Apoe −/− 16 months and Apoe −/− /Sod2 +/− 4 months; Figure 5A, top and middle panels). Specifically, calpain‐2 expression was significantly increased in the plaque SMC constituting the fibrous cap (Figure 5A, middle panel). Compared with Apoe −/−, some middle‐aged Apoe −/−/Sod2 +/− mice had depleted intimal SMC content in the atherosclerotic lesions and the absence of immunoreactive calpain‐2 at the plaque shoulder regions but not in media (Figure 5A, lower panel). A significant increase in expression of immunoreactive cleaved caspase‐3 was confined to intimal SMC in middle‐aged Apoe −/−/Sod2 +/− aortas (P<0.05 versus Apoe −/− 16 months and Apoe −/− /Sod2 +/− 4 months), whereas it was minimal and restricted to the necrotic core area in middle‐aged Apoe −/− aortas (Figure 5B, top and middle panels). The plaque shoulder regions with depleted intimal SMC content had low levels of immunoreactive cleaved caspase‐3 (Figure 5B, lower panel), suggesting that intimal SMC apoptosis is induced by calpain‐2‐mediated activation of caspase‐3.36
Figure 5.
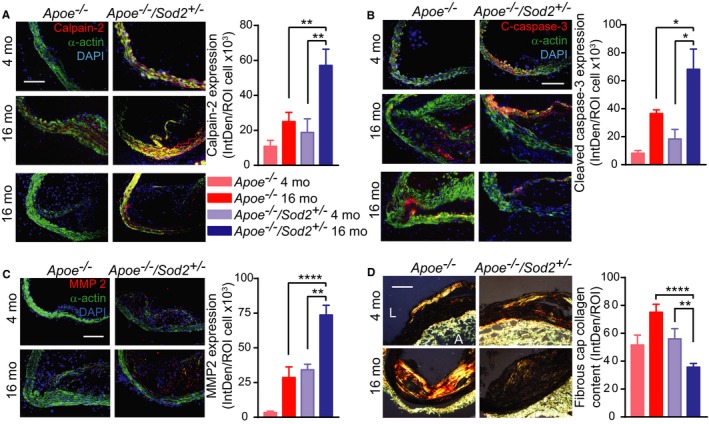
Increased calpain‐2 expression correlates with smooth muscle apoptosis and matrix degradation at the shoulder region of atherosclerotic plaque in middle‐aged Apoe −/−/Sod2 +/− mice. A through C, Representative fluorescent microscopy images and quantification of aortic sections stained for immunoreactive calpain‐2 (A), cleaved caspase‐3 (B), and MMP2 (C) (red); smooth muscle α‐actin (green), and DAPI (blue). Data presented as fluorescence integrated density (IntDen) per number of cells (mean±SEM, n=6). D, Representative polarized microscopy images of aortic sections stained with picrosirius red and fibrous cap collagen content quantification. Data presented as fluorescence integrated density (mean±SEM, n=8). A indicates adventitia; L, lumen; MMP, matrix metalloproteinase; mo, months; ROI, region of interest. Scale is 100 μm. *P<0.05; **P<0.01; ****P<0.0001.
Because calpains activate matrix‐degrading metalloproteinases31 and MMP2 activity increases in the arterial wall of middle‐aged Sod2 +/− mice,13 we analyzed MMP2 expression in mouse atherosclerotic plaque shoulder regions. The immunoreactive MMP2 expression was markedly increased in the fibrous cap as well as in total atherosclerotic plaque area in Apoe −/−/Sod2 +/− compared with Apoe −/− mice; MMP2 expression was significantly higher in middle‐aged Apoe −/−/Sod2 +/− than in other mouse groups (Figure 5C). Analysis of aortic sections stained with picrosirius red in polarized light showed evenly distributed collagen fibers in fibrous caps in 4‐month‐old Apoe −/− and Apoe −/−/Sod2 +/− mice. The collagen fibers were compactly arranged in atherosclerotic lesions of 16‐month‐old Apoe −/−, whereas they were disorganized in middle‐aged Apoe −/−/Sod2 +/− mice (Figure 5D). In addition, the amount of fibrous cap collagen was significantly lower in atherosclerotic plaque fibrous cap of middle‐aged Apoe −/−/Sod2 +/− mice. These results suggest that increased mtOS in aging under hypercholesterolemic conditions promotes features of atherosclerotic plaque vulnerability by inducing calpain‐2 expression, increasing caspase‐3 activation and MMP2‐mediated SMC apoptosis and matrix degradation in the plaque shoulder regions, resulting in thin fibrous caps with low cellularity.
Phenotypic transition of atherosclerotic plaque VSMC into macrophage‐like cells enhances intraplaque inflammation and contributes to the plaque pathogenesis.37 To assess whether aging and SOD2 deficiency contribute to SMC transdifferentiation, we analyzed mouse atherosclerotic plaques for cells coexpressing markers of both SMC (SMMHC and α‐actin) and macrophage (CD68 and Mac3) lineages.38, 39 Cells costained with immunoreactive SMMHC and CD68 were primarily localized to the core area of the plaque. The proportion of these cells to all CD68+ cells increased significantly in the plaque core of middle‐aged Apoe −/− and Apoe −/−/Sod2 +/− as compared to young mice but was not significantly different between the genotypes (Figure S3). Similarly, the number of cells costained with immunoreactive Mac3 and α‐actin increased significantly in atherosclerotic plaques of middle‐aged compared with young mice. These data suggest that aging may enhance plaque SMC transdifferentiation resulting in increased accumulation of inflammatory cells in the core. A lack of significant difference between aged Apoe −/− and Apoe −/−/Sod2 +/− mice suggests that mtOS contributes to the core expansion through increased cell apoptosis rather than SMC transdifferentiation.
MitoTEMPO Reduces Features of Plaque Vulnerability in Middle‐Aged Apoe −/−/Sod2 +/− Mice
Because MitoTEMPO treatment attenuated the aging‐associated increase in atherosclerosis,9 we examined whether it would exert similar salutary effects on plaque morphology in advanced atherosclerosis by treating middle‐aged Apoe −/− and Apoe −/−/Sod2 +/− mice fed a Western diet with MitoTEMPO or vehicle for 3 months. A significant reduction in atherosclerotic burden in MitoTEMPO versus vehicle‐treated Apoe −/− mice (Figure 6A) is consistent with our previous data.9 However, MitoTEMPO had no significant inhibitory effect on plaque burden in middle‐aged Apoe −/−/Sod2 +/− mice with advanced atherosclerosis, although the lesion size trended downward with the treatment. It would be worth investigating whether a higher dose or longer treatment of MitoTEMPO significantly reduces atherosclerotic burden in these mice. Nevertheless, MitoTEMPO treatment of middle‐aged Apoe −/− and Apoe −/−/Sod2 +/− mice significantly decreased plasma free 8‐isoprostane levels, a measure of systemic oxidative stress (Figure 6B). Neither MitoTEMPO nor vehicle had significant effects on lipid metabolism in middle‐aged mice (Figure S4A and S4B). The treatment protocol had no toxic effects as determined by blood urea nitrogen (Figure S4C), creatinine (Figure S4D), alanine aminotransferase (Figure S4E) levels and kidney (Figure S4F) or liver morphological changes (Figure S4G). Atherosclerotic plaque mtROS levels were significantly decreased by MitoTEMPO in both middle‐aged Apoe −/− and Apoe −/−/Sod2 +/− mice (Figure 6C). Additionally, MitoTEMPO significantly lowered the number of cells with 8‐OHdG modification of mtDNA at the atherosclerotic plaque shoulder regions in both genotypes (Figure 6D).
Figure 6.
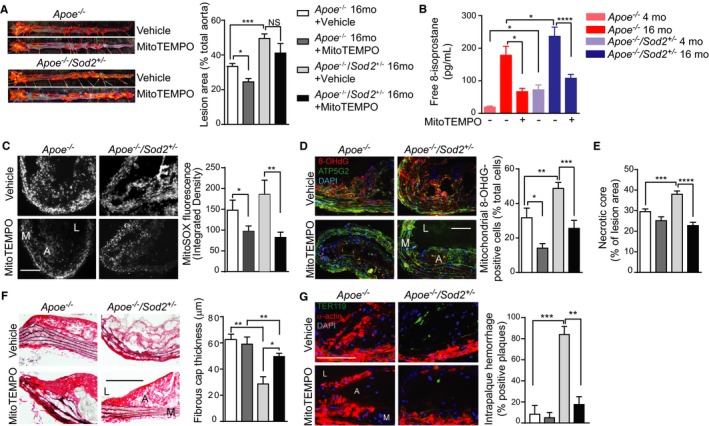
MitoTEMPO treatment reduced mtOS and atherosclerotic plaque remodeling but not atherosclerosis progression in middle‐aged Apoe −/−/Sod2 +/− mice. A, Representative images of oil red O–stained aortas and quantification of atherosclerotic lesions in 16‐months old Apoe −/− and Apoe −/−/Sod2 +/− mice treated with MitoTEMPO and fed a Western diet for 3 months (mean±SEM, n=8). B, Plasma levels of free 8‐isoprostane (mean±SEM, n=8). C, Representative images and quantification of mouse aorta transverse sections stained with MitoSOX Red (mean±SEM, n=7). D, Representative images of aortic transverse sections stained for 8‐OHdG (red), ATP5G2 (green), and DAPI (blue), and quantification of mitochondrial 8‐OHdG‐positive cells (mean±SEM, n=5). E, Atherosclerotic lesion necrotic core size presented as acellular fraction of the total plaque area (mean±SEM, n=7). F, Representative images of aortic transverse sections stained with Verhoeff picrosirius red and quantification of the fibrous cap thickness at the atherosclerotic plaque shoulder region (mean±SEM, n=7). G, Representative fluorescent microscopy images of aortic sections stained for TER119 (green), smooth muscle α‐actin (red), and DAPI (blue) and quantification of the number of aortic sections showing intraplaque hemorrhage (n=7). A indicates atheroma; L, lumen; M, media; mo, months; mtOS, mitochondrial oxygen stress; NS, not significant; SEM, standard error of the mean. Scale is 100 μm. *P<0.05; **P<0.01; ***P<0.001; ****P<0.0001.
Analysis of aortic cross sections showed that necrotic core size, which was significantly increased in middle‐aged Apoe −/−/Sod2 +/− versus middle‐aged Apoe −/− mice, was markedly decreased in response to MitoTEMPO treatment (Figure 6E). Additionally, Verhoeff picrosirius red staining of aortic sections showed that the fibrous cap thickness at the shoulder regions of atherosclerotic plaque, which was markedly decreased in vehicle‐treated middle‐aged Apoe −/−/Sod2 +/− versus middle‐aged Apoe −/− mice, was significantly increased after MitoTEMPO treatment (Figure 6F). In addition, treatment with MitoTEMPO resulted in a marked reduction in the presence of red blood cells within the plaque in middle‐aged Apoe −/−/Sod2 +/− mice (Figure 6G). These results showed that MitoTEMPO treatment in middle‐aged mice markedly reduced features of vulnerable plaque.
Further analysis of atherosclerotic plaques in mice treated with MitoTEMPO revealed a substantial reduction in immunoreactive calpain‐2 expression in middle‐aged Apoe −/−/Sod2 +/− versus vehicle‐treated mice (Figure 7A). Correspondingly, the fibrous cap at the shoulder regions of atherosclerotic plaque demonstrated higher cellularity and SMC content in MitoTEMPO‐treated versus vehicle‐treated middle‐aged Apoe −/−/Sod2 +/− mice. Similarly, the immunoreactive cleaved caspase‐3 expression was reduced and fibrous cap SMC content was preserved by MitoTEMPO treatment in atherosclerotic plaque of middle‐aged Apoe −/−/Sod2 +/− mice (Figure 7B). Further, TUNEL‐stained aortic sections showed a significant increase in the number of TUNEL+ medial and intimal SMC as well as core macrophages in middle‐aged Apoe −/−/Sod2 +/− versus Apoe −/− mice (Figure 7C); MitoTEMPO treatment markedly decreased the percentage of TUNEL+ cells in the middle‐aged Apoe −/−/Sod2 +/− mice. In addition, MitoTEMPO treatment significantly reduced MMP2 expression by medial and neointimal SMC (α‐actin+; Figure 7D) as well as plaque macrophages (CD68+ cells; Figure S5) in the atherosclerotic lesions of middle‐aged Apoe −/−/Sod2 +/− mice. Consistent with increased expression levels, in situ zymography using fluorescein‐labeled MMP substrate showed increased MMP2 activity (enhanced cleaved substrate accumulation) in the atherosclerotic aortas from middle‐aged Apoe −/−/Sod2 +/− compared with middle‐aged Apoe −/− mice; MMP2 activity was noticeably reduced in MitoTEMPO‐treated aortas from middle‐aged Apoe −/−/Sod2 +/− mice (Figure 7E). As a consequence of reduced MMP2 expression and activity, analysis of polarized microscopy images of aortic sections stained with picrosirius red showed the enhanced presence of organized collagen fibers in the shoulder region of atherosclerotic plaques from MitoTEMPO‐treated Apoe −/−/Sod2 +/− mice (Figure 7F). Taken together, these data suggest that even in the absence of a significant reduction in atherosclerotic lesion size, MitoTEMPO treatment may exert a salutary effect on advanced atherosclerosis in aging under hypercholesterolemic conditions by inhibiting mtOS, reducing apoptosis, and attenuating features of atherosclerotic plaque vulnerability.
Figure 7.

Treatment with MitoTEMPO decreases smooth muscle apoptosis and matrix remodeling and preserves fibrous cap integrity in the atherosclerotic plaque shoulder region in middle‐aged Apoe −/−/Sod2 +/− mice. A and B, Representative fluorescent microscopy images and quantification of aortic sections stained for immunoreactive calpain‐2 (A), cleaved caspase‐3 (B) (red), smooth muscle α‐actin (green) and DAPI (blue). Data presented as fluorescence integrated density (IntDen) per number of cells (mean±SEM, n=5). C, Representative fluorescent microscopy images of TUNEL‐stained aortic sections (TUNEL—red, nuclei—blue, TUNEL + nuclei—pseudo‐colored green) and quantification of TUNEL + nuclei (mean±SEM, n=5). D, Representative fluorescent microscopy images of aortic sections stained for MMP 2 (red), smooth muscle α‐actin (green) and DAPI (blue). Data presented as fluorescence integrated density (IntDen) per number of cells (mean±SEM, n=5). E, Representative fluorescent microscopy images of aortic sections following in situ zymography (green) and stained with DAPI (blue) and quantification of cleaved substrate fluorescence per number of cells in atherosclerotic plaque section (mean±SEM, n=5). F, Representative polarized microscopy images of aortic sections stained with picrosirius red (A indicates adventitia; L, lumen; n=5). Scale is 100 μm. *P<0.05; **P<0.01; ***P<0.001; ****P<0.0001. IntDen indicates integrated density; MMP, matrix metalloproteinase; ROI, region of interest; SEM, standard error of the mean; TUNEL, terminal deoxynucleotidyl transferase dUTP nick end labeling.
Discussion
The present studies were designed to determine the interplay of impaired SOD2 activity, aging, and hypercholesterolemia on aortic atherosclerotic burden and on features of atherosclerotic plaque stability, which are associated with major adverse cardiovascular events.40 We used middle‐aged, 16‐month‐old mice, which are equivalent to ≈54‐year‐old humans,41, 42 an age group with an exponential increase in the incidence of coronary heart disease and other cardiovascular diseases compared to a younger 20‐ to 39‐year age group.2 Lifelong deficiency of SOD2 activity increased atherosclerotic lesion volume and multiple features of plaque vulnerability in middle‐aged hyperlipidemic mice, including decreased plaque SMC content and fibrous cap thickness, increased VCAM1 expression and T‐cell content, enlarged necrotic core size, and evidence of intraplaque hemorrhage and plaque fissures. The fibrous cap changes compatible with plaque fissure observed in these mice may also be a source of intraplaque hemorrhage.43 In addition, our data provide evidence that in SOD2‐deficient mice, mtOS regulates calpain‐2 expression in advanced atherosclerosis, and caplain‐2 may mediate features of plaque vulnerability, including decreased plaque SMC content and fibrous cap thickness, via the activation of caspase‐3 and MMP2, respectively. It is also possible, but less likely, that calpain‐1‐dependent MMP2 expression contributes to plaque instability in middle‐aged Apoe −/−/Sod2 +/− mice fed a Western diet as a significant, albeit similar, increase in calpain‐1 expression was observed in VSMC from aged wild‐type and middle‐aged Sod2 +/− mice. More importantly, these studies show that although MitoTEMPO treatment did not significantly reduce aortic atherosclerotic burden, it did preserve features of plaque stability including SMC content and fibrous cap thickness in middle‐aged hyperlipidemic Sod2 +/− mice; the most salutary effects were seen in inhibiting SMC apoptosis, macrophage recruitment, and inhibition of calpain‐2 expression and caspase‐3 and MMP2 activities. Taken together, these data suggest that increased mtOS and mitochondrial dysfunction under hyperlipidemic conditions in aging not only increases atherosclerotic plaque volume but also induces features of plaque instability, by accentuating DNA damage, perhaps via calpain‐2‐mediated mechanisms.
The current data showing extensive and advanced atherosclerosis in middle‐aged hyperlipidemic SOD2 +/− mice are consistent with a previous report in which age‐accelerated atherosclerosis in lipoprotein receptor knockout mice was attributed to an inability to mount a robust antioxidant response.12 In this context, it is worth noting that the increased oxidized low‐density lipoprotein levels under hyperlipidemic conditions, as seen in Apoe −/− mice, exacerbate mtROS production and induce cell apoptosis by stimulating SOD2 ubiquitination and degradation.44 We and others demonstrated previously that cellular ROS levels are correlated with mtDNA damage, an early event in atherogenesis.11, 45 The results of the present studies demonstrating increased features of atherosclerotic plaque vulnerability with increases in mtOS and mtDNA damage are consistent with a report by Yu et al22 that mtDNA damage is an indicator of high‐risk plaques in advanced atherosclerosis.
Our results demonstrate that plaque SMC content increased in both young Apoe −/− mice that were deficient in SOD2 as well as in middle‐aged Apoe −/− mice with increased endogenous mtROS levels. In contrast, the plaque SMC content decreased significantly in middle‐aged Apoe −/−/Sod2 +/− mice, indicating “threshold effects” of decreased SOD2 activity on atherosclerosis in aging and under hyperlipidemic conditions; lower levels of mtROS increase atherosclerotic plaque burden by promoting SMC proliferation, but when SOD2 activity falls below a minimum threshold required for cell survival, plaque instability results.46 It is relevant that SMC apoptosis is sufficient for the progression of the plaque to an unstable state.47 Increased VCAM1 levels in atheroma and medial SMC in middle‐aged Apoe −/−/Sod2 +/− mice suggest that impaired SOD2 activity increases and sustains endothelial, SMC, and macrophage‐derived inflammation, which could lead to evolution of the inflamed lesion into an unstable plaque.48 Increased infiltration of CD3+ T cells in advanced atherosclerotic lesions in middle‐aged Apoe −/−/Sod2 +/− mice on activation by LDL fragments could destabilize plaques by secreting TNFα and IFNγ.5 The macrophage‐activating interferon promotes a vulnerable phenotype by inducing inflammation of both endothelial cells and SMC and inhibiting collagen synthesis by SMC, affecting fibrous cap thickness, as observed in the present study.
Recent evidence indicates that SMC within lesions transition to cells with multiple phenotypes including macrophage‐like cells with increased expression of proinflammatory cytokines, affecting plaque composition and stability.37 Our results suggest that these processes are enhanced during aging and, in conjunction with increased mtOS, promote apoptosis and expansion of the necrotic core. The infiltration of erythrocytes in the lesions in middle‐aged Apoe −/−/Sod2 +/− mice on a high‐fat diet is an indication of hemorrhage and evidence of intraplaque microvessels, which increase lesion vulnerability by facilitating continued extravasation of inflammatory cells into the lesions.49 Increased blood pressure, another significant factor influencing plaque stability, increases peak circumferential stress at the plaque shoulder.50 The elevated diastolic blood pressure and increased arterial stiffness in aged Sod2 +/− mice13 might increase peak circumferential stress and, in combination with decreased cap thickness, may trigger plaque rapture at the shoulder region.51
The data from our mechanistic studies on mouse aortic SMC, which are consistent with the in vivo findings, elucidate the underlying molecular mechanisms affecting atherosclerotic plaque burden and plaque vulnerability when multiple atherosclerotic risk factors including aging, increased oxidative stress, and hyperlipidemia converge on the vessel wall. Our results showing increased nuclear DNA damage in the aortas of middle‐aged Apoe −/−/Sod2 +/− mice are consistent with a previous report that demonstrated elevated levels of 8‐OHdG in nuclear DNA in SOD2+/− mice.52 This is important because nuclear DNA damage promotes mitochondrial dysfunction and mtDNA damage,53 which increases atherogenesis and induces plaque vulnerability, as observed by a significant decline in the activities of mitochondrial complexes I and III in VSMC from middle‐aged SOD2+/− mice exposed to the inflammatory cytokines TNFα and IFNγ as well as increased mitochondrial 8‐OHdG levels in the plaques of middle‐aged Apoe−/−/Sod2+/− mice. Decreased mitochondrial ATP generation from mtDNA damage and mitochondrial dysfunction dysregulates cellular Ca2+ homeostasis by impairing the activity of the plasma membrane and sarcoplasmic reticulum Ca2+‐ATPase.54 The opening of mitochondrial permeability transition pores following mitochondrial dysfunction55 from prolonged mtOS in middle‐aged Apoe −/−/Sod2 +/− mice on high‐fat diets may also contribute to increased cytosolic Ca2+ levels, activating calpains. Here, it is of particular interest to note that Ca2+‐dependent calpain activation, cytochrome C release, and caspase‐3 activation were reported in human microvascular endothelial cells exposed to oxidized LDL.56 Calpains have been implicated in atherosclerosis30, 34; however, our data reveal for the first time that SOD2 is an important regulator of calpain‐2 induction, which mediates plaque vulnerability in mice during aging under hyperlipidemic conditions. In contrast to the report of Miyazaki et al34 that calpain‐2 is preferentially induced in endothelial cells in atheroma, our data show robust expression of the protease in SMC, both in vitro and in atherosclerotic lesions. Selective activation of caspase‐3 by calpain‐2 but not calpain‐1 was previously reported,36 which supports our results of selective activation of caspase‐3 in a calpain‐2‐dependent manner. Additionally, our results showing that calpain‐2 regulates MMP2 expression are consistent with a previous study showing that MMP2 expression in aging is regulated by calpains.31 The increased expression of MMP2 along with depleted and disorganized collagen fibers in atherosclerotic plaque shoulder regions of middle‐aged Apoe −/−/Sod2 +/− mice (indicating increased plaque vulnerability) are consistent with the data from the Atherosclerosis Risk in Communities Carotid MRI Study in which the MMP2 C1306T variant is associated with lower MMP2 expression and a thicker fibrous cap.57
The morphological features of advanced atherosclerotic plaques in middle‐aged mice that we describe are relevant to age‐dependent changes in human atherosclerosis. Kang et al reported that patients who are smokers and >65 years had more plaque burden and plaque instability (more necrotic core, thin‐cap fibroatheromas, and positive remodeling) and more ruptures compared to patients who are nonsmokers and ≤65 years.58, 59 In a similar report, Wendorff et al found a continuous increase in carotid plaque instability in men with age and a significant increase in plaque instability in the 65‐ to 69‐year‐old age group of patients in the probability analysis of age‐associated quartiles related to the first quartile.60
Statins have been established as the best pharmacotherapy for reduction of cardiovascular risk. In addition to lowering lipid levels, statins exert plaque stabilization effects by reducing intraplaque hemorrhage, plaque neovascularization, and endothelial dysfunction.26, 49 However, a significant residual cardiovascular risk remains in patients on statin treatment. The success of immunomodulatory agents such as blocking antibodies against IFNγ and CCL5 antagonists in inducing plaque stabilization in mouse models highlights the importance of inflammation in plaque destabilization. These reports are entirely consistent with the results of the present investigation showing that MitoTEMPO treatment improves atherosclerotic plaque stability in aging‐associated atherosclerosis by attenuating mtOS and vascular inflammation. Also of potential relevance for cardiovascular risk reduction are reports that MitoTEMPO exerts salutary effects on angiotensin II–induced hypertension61 and aging‐associated decline in arterial compliance9 in mouse models. More importantly, MitoTEMPO reduced hypertension and improved vasorelaxation in a mouse model of hyperacetylated and hypofunctional SOD2.62 Targeting mtOS and dysfunction using mitochondria‐targeted antioxidants, such as MitoTEMPO, in combination with statins may represent an important opportunity for prevention of atherosclerotic plaque progression and instability during aging.
Sources of Funding
This work was supported by NIH grants AG024282 and HL111664.
Disclosures
Dr. Samuel Wickline has equity in Trasir Therapeutics, LLC.
Supporting information
Figure S1. Plasma lipid levels in young and aged Apoe−/− compared with Apoe−/−/Sod2+/− mice. A and B, Plasma levels of total cholesterol (A) and triglycerides (B). Data are mean±SEM, n=12. SEM indicates standard error of the mean.
Figure S2. Transfection of VSMC from middle‐age wild‐type mice with Capn2 siRNA:p5RHH nanocomplexes effectively reduces calpain‐2 but not calpain‐1 expression levels. Western blot analysis of calpain‐2 and calpain‐1 expression in VSMC transfected with scrambled siRNA or Capn2 siRNA:p5RHH nanocomplexes. VSMC indicates vascular smooth muscle cells.
Figure S3. Plaque VSMC transdifferentiation to macrophage‐like cells in Apoe −/− and Apoe −/−/Sod2 +/− mice. A, Representative fluorescent microscopy images of fresh‐frozen transverse aortic sections stained for immunoreactive CD68 (red), smooth muscle SM‐MHC (green), and DAPI (blue) and quantification of proportion of CD68+ SM‐MHC+ cells relative to total core CD68+ cells (mean±SEM, n=6). B, Representative fluorescent microscopy images of fresh‐frozen transverse aortic sections stained for immunoreactive Mac3 (green), smooth muscle α‐actin (red), and DAPI (blue) and quantification of proportion of Mac3+ α‐actin+ cells relative to total plaque Mac3+ cells (mean±SEM, n=6). Scale is 100 μm. SEM indicates standard error of the mean; VSMC, vascular smooth muscle cells..
Figure S4. Systemic effects of MitoTEMPO treatment in middle‐aged Apoe −/− and Apoe −/−/Sod2 +/− mice. A through E, Plasma levels of total cholesterol (A), triglycerides (B), blood urea nitrogen (BUN) (C), creatinine (D), and alanine aminotransferase (E). Data are mean±SEM, n=8. F and G, Representative images of mouse kidney (F) and liver (G) sections stained with H&E. N=4. Scale is 100 μm. H&E indicates hematoxylin and eosin; SEM, standard error of the mean.
Figure S5. Frozen transverse aortic sections stained for immunoreacative MMP2 (green), CD68 (red) and DAPI (blue) and quantification of MMP2 expression in CD68+ cells represented as fluorescence integrated density (IntDen) per number of cells (mean±SEM, n=6). Scale is 100 μm. *P<0.05; **P<0.01. MMP indicates matrix metalloproteinase; SEM, standard error of the mean.
Acknowledgments
We are thankful to Dr Judith Connett for her critical reading of the article.
(J Am Heart Assoc. 2017;6:e006775 DOI: 10.1161/JAHA.117.006775.)29079564
References
- 1. Roth GA, Huffman MD, Moran AE, Feigin V, Mensah GA, Naghavi M, Murray CJ. Global and regional patterns in cardiovascular mortality from 1990 to 2013. Circulation. 2015;132:1667–1678. [DOI] [PubMed] [Google Scholar]
- 2. Mozaffarian D, Benjamin EJ, Go AS, Arnett DK, Blaha MJ, Cushman M, Das SR, de Ferranti S, Despres JP, Fullerton HJ, Howard VJ, Huffman MD, Isasi CR, Jimenez MC, Judd SE, Kissela BM, Lichtman JH, Lisabeth LD, Liu S, Mackey RH, Magid DJ, McGuire DK, Mohler ER III, Moy CS, Muntner P, Mussolino ME, Nasir K, Neumar RW, Nichol G, Palaniappan L, Pandey DK, Reeves MJ, Rodriguez CJ, Rosamond W, Sorlie PD, Stein J, Towfighi A, Turan TN, Virani SS, Woo D, Yeh RW, Turner MB; American Heart Association Statistics Committee and Stroke Statistics Subcommittee . Heart disease and stroke statistics—2016 update: a report from the American Heart Association. Circulation. 2016;133:e38–e360. [DOI] [PubMed] [Google Scholar]
- 3. Sakakura K, Nakano M, Otsuka F, Ladich E, Kolodgie FD, Virmani R. Pathophysiology of atherosclerosis plaque progression. Heart Lung Circ. 2013;22:399–411. [DOI] [PubMed] [Google Scholar]
- 4. Virmani R, Burke AP, Farb A, Kolodgie FD. Pathology of the vulnerable plaque. J Am Coll Cardiol. 2006;47:C13–C18. [DOI] [PubMed] [Google Scholar]
- 5. Hansson GK, Libby P, Tabas I. Inflammation and plaque vulnerability. J Intern Med. 2015;278:483–493. [DOI] [PMC free article] [PubMed] [Google Scholar]
- 6. Chiao YA, Lakatta E, Ungvari Z, Dai D‐F, Rabinovitch P. Cardiovascular disease and aging In: Sierra F, Kohanski R, eds. Advances in Geroscience. Cham: Springer International Publishing; 2016;121–160. [Google Scholar]
- 7. Wang JC, Bennett M. Aging and atherosclerosis: mechanisms, functional consequences, and potential therapeutics for cellular senescence. Circ Res. 2012;111:245–259. [DOI] [PubMed] [Google Scholar]
- 8. Madamanchi NR, Runge MS. Redox signaling in cardiovascular health and disease. Free Radic Biol Med. 2013;61:473–501. [DOI] [PMC free article] [PubMed] [Google Scholar]
- 9. Vendrov A, Vendrov K, Smith A, Yuan J, Sumida A, Robiduox J, Runge MS, Madamanchi NR. NOX4 NADPH oxidase‐dependent mitochondrial oxidative stress in aging‐associated cardiovascular disease. Antioxid Redox Signal. 2015;23:1389–1409. [DOI] [PMC free article] [PubMed] [Google Scholar]
- 10. Madamanchi NR, Runge MS. Mitochondrial dysfunction in atherosclerosis. Circ Res. 2007;100:460–473. [DOI] [PubMed] [Google Scholar]
- 11. Ballinger SW, Patterson C, Knight‐Lozano CA, Burow DL, Conklin CA, Hu Z, Reuf J, Horaist C, Lebovitz R, Hunter GC, McIntyre K, Runge MS. 2002;106:544–549. [DOI] [PubMed] [Google Scholar]
- 12. Collins AR, Lyon CJ, Xia X, Liu JZ, Tangirala RK, Yin F, Boyadjian R, Bikineyeva A, Pratico D, Harrison DG, Hsueh WA. Age‐accelerated atherosclerosis correlates with failure to upregulate antioxidant genes. Circ Res. 2009;104:e42–e54. [DOI] [PubMed] [Google Scholar]
- 13. Zhou RH, Vendrov AE, Tchivilev I, Niu XL, Molnar KC, Rojas M, Carter JD, Tong H, Stouffer GA, Madamanchi NR, Runge MS. Mitochondrial oxidative stress in aortic stiffening with age: the role of smooth muscle cell function. Arterioscler Thromb Vasc Biol. 2012;32:745–755. [DOI] [PMC free article] [PubMed] [Google Scholar]
- 14. Lozhkin A, Vendrov AE, Pan H, Wickline SA, Madamanchi NR, Runge MS. NADPH oxidase 4 regulates vascular inflammation in aging and atherosclerosis. J Mol Cell Cardiol. 2017;102:10–21. [DOI] [PMC free article] [PubMed] [Google Scholar]
- 15. Wang Y, Wang GZ, Rabinovitch PS, Tabas I. Macrophage mitochondrial oxidative stress promotes atherosclerosis and nuclear factor‐κB‐mediated inflammation in macrophages. Circ Res. 2014;114:421–433. [DOI] [PMC free article] [PubMed] [Google Scholar]
- 16. Zielonka J, Hardy M, Kalyanaraman B. HPLC study of oxidation products of hydroethidine in chemical and biological systems: ramifications in superoxide measurements. Free Radic Biol Med. 2009;46:329–338. [DOI] [PMC free article] [PubMed] [Google Scholar]
- 17. Satoh K, Nigro P, Matoba T, O'Dell MR, Cui Z, Shi X, Mohan A, Yan C, Abe J, Illig KA, Berk BC. Cyclophilin A enhances vascular oxidative stress and the development of angiotensin II‐induced aortic aneurysms. Nat Med. 2009;15:649–656. [DOI] [PMC free article] [PubMed] [Google Scholar]
- 18. Luo C, Long J, Liu J. An improved spectrophotometric method for a more specific and accurate assay of mitochondrial complex III activity. Clin Chim Acta. 2008;395:38–41. [DOI] [PubMed] [Google Scholar]
- 19. Vendrov AE, Madamanchi NR, Niu XL, Molnar KC, Runge M, Szyndralewiez C, Page P, Runge MS. NADPH oxidases regulate CD44 and hyaluronic acid expression in thrombin‐treated vascular smooth muscle cells and in atherosclerosis. J Biol Chem. 2010;285:26545–26557. [DOI] [PMC free article] [PubMed] [Google Scholar]
- 20. Wang Y, Tabas I. Emerging roles of mitochondria ROS in atherosclerotic lesions: causation or association? J Atheroscler Thromb. 2014;21:381–390. [DOI] [PMC free article] [PubMed] [Google Scholar]
- 21. Gray K, Kumar S, Figg N, Harrison J, Baker L, Mercer J, Littlewood T, Bennett M. Effects of DNA damage in smooth muscle cells in atherosclerosis. Circ Res. 2015;116:816–826. [DOI] [PubMed] [Google Scholar]
- 22. Yu E, Calvert PA, Mercer JR, Harrison J, Baker L, Figg NL, Kumar S, Wang JC, Hurst LA, Obaid DR, Logan A, West NE, Clarke MC, Vidal‐Puig A, Murphy MP, Bennett MR. Mitochondrial DNA damage can promote atherosclerosis independently of reactive oxygen species through effects on smooth muscle cells and monocytes and correlates with higher‐risk plaques in humans. Circulation. 2013;128:702–712. [DOI] [PubMed] [Google Scholar]
- 23. Davies MJ, Richardson PD, Woolf N, Katz DR, Mann J. Risk of thrombosis in human atherosclerotic plaques: role of extracellular lipid, macrophage, and smooth muscle cell content. Br Heart J. 1993;69:377–381. [DOI] [PMC free article] [PubMed] [Google Scholar]
- 24. Mazzolai L, Duchosal MA, Korber M, Bouzourene K, Aubert JF, Hao H, Vallet V, Brunner HR, Nussberger J, Gabbiani G, Hayoz D. Endogenous angiotensin II induces atherosclerotic plaque vulnerability and elicits a Th1 response in ApoE‐/‐ mice. Hypertension. 2004;44:277–282. [DOI] [PubMed] [Google Scholar]
- 25. van Dijk RA, Duinisveld AJ, Schaapherder AF, Mulder‐Stapel A, Hamming JF, Kuiper J, de Boer OJ, van der Wal AC, Kolodgie FD, Virmani R, Lindeman JH. A change in inflammatory footprint precedes plaque instability: a systematic evaluation of cellular aspects of the adaptive immune response in human atherosclerosis. J Am Heart Assoc. 2015;4:e001403 DOI: 10.1161/JAHA.114.001403. [DOI] [PMC free article] [PubMed] [Google Scholar]
- 26. Silvestre‐Roig C, de Winther MP, Weber C, Daemen MJ, Lutgens E, Soehnlein O. Atherosclerotic plaque destabilization: mechanisms, models, and therapeutic strategies. Circ Res. 2014;114:214–226. [DOI] [PubMed] [Google Scholar]
- 27. Kolodgie FD, Gold HK, Burke AP, Fowler DR, Kruth HS, Weber DK, Farb A, Guerrero LJ, Hayase M, Kutys R, Narula J, Finn AV, Virmani R. Intraplaque hemorrhage and progression of coronary atheroma. N Engl J Med. 2003;349:2316–2325. [DOI] [PubMed] [Google Scholar]
- 28. Falk E, Nakano M, Bentzon JF, Finn AV, Virmani R. Update on acute coronary syndromes: the pathologists' view. Eur Heart J. 2013;34:719–728. [DOI] [PubMed] [Google Scholar]
- 29. Geng YJ, Wu Q, Muszynski M, Hansson GK, Libby P. Apoptosis of vascular smooth muscle cells induced by in vitro stimulation with interferon‐gamma, tumor necrosis factor‐alpha, and interleukin‐1 beta. Arterioscler Thromb Vasc Biol. 1996;16:19–27. [DOI] [PubMed] [Google Scholar]
- 30. Howatt DA, Balakrishnan A, Moorleghen JJ, Muniappan L, Rateri DL, Uchida HA, Takano J, Saido TC, Chishti AH, Baud L, Subramanian V. Leukocyte calpain deficiency reduces angiotensin II‐induced inflammation and atherosclerosis but not abdominal aortic aneurysms in mice. Arterioscler Thromb Vasc Biol. 2016;36:835–845. [DOI] [PMC free article] [PubMed] [Google Scholar]
- 31. Jiang L, Zhang J, Monticone RE, Telljohann R, Wu J, Wang M, Lakatta EG. Calpain‐1 regulation of matrix metalloproteinase 2 activity in vascular smooth muscle cells facilitates age‐associated aortic wall calcification and fibrosis. Hypertension. 2012;60:1192–1199. [DOI] [PMC free article] [PubMed] [Google Scholar]
- 32. Jang HS, Lal S, Greenwood JA. Calpain 2 is required for glioblastoma cell invasion: regulation of matrix metalloproteinase 2. Neurochem Res. 2010;35:1796–1804. [DOI] [PMC free article] [PubMed] [Google Scholar]
- 33. Mercer J, Figg N, Stoneman V, Braganza D, Bennett MR. Endogenous p53 protects vascular smooth muscle cells from apoptosis and reduces atherosclerosis in ApoE knockout mice. Circ Res. 2005;96:667–674. [DOI] [PubMed] [Google Scholar]
- 34. Miyazaki T, Taketomi Y, Takimoto M, Lei XF, Arita S, Kim‐Kaneyama JR, Arata S, Ohata H, Ota H, Murakami M, Miyazaki A. m‐Calpain induction in vascular endothelial cells on human and mouse atheromas and its roles in VE‐cadherin disorganization and atherosclerosis. Circulation. 2011;124:2522–2532. [DOI] [PubMed] [Google Scholar]
- 35. Shan L, Li J, Wei M, Ma J, Wan L, Zhu W, Li Y, Zhu H, Arnold JM, Peng T. Disruption of Rac1 signaling reduces ischemia‐reperfusion injury in the diabetic heart by inhibiting calpain. Free Radic Biol Med. 2010;49:1804–1814. [DOI] [PubMed] [Google Scholar]
- 36. Blomgren K, Zhu C, Wang X, Karlsson JO, Leverin AL, Bahr BA, Mallard C, Hagberg H. Synergistic activation of caspase‐3 by m‐calpain after neonatal hypoxia‐ischemia: a mechanism of “pathological apoptosis”? J Biol Chem. 2001;276:10191–10198. [DOI] [PubMed] [Google Scholar]
- 37. Shankman LS, Gomez D, Cherepanova OA, Salmon M, Alencar GF, Haskins RM, Swiatlowska P, Newman AA, Greene ES, Straub AC, Isakson B, Randolph GJ, Owens GK. KLF4‐dependent phenotypic modulation of smooth muscle cells has a key role in atherosclerotic plaque pathogenesis. Nat Med. 2015;21:628–637. [DOI] [PMC free article] [PubMed] [Google Scholar]
- 38. Albarran‐Juarez J, Kaur H, Grimm M, Offermanns S, Wettschureck N. Lineage tracing of cells involved in atherosclerosis. Atherosclerosis. 2016;251:445–453. [DOI] [PubMed] [Google Scholar]
- 39. Chappell J, Harman JL, Narasimhan VM, Yu H, Foote K, Simons BD, Bennett MR, Jorgensen HF. Extensive proliferation of a subset of differentiated, yet plastic, medial vascular smooth muscle cells contributes to neointimal formation in mouse injury and atherosclerosis models. Circ Res. 2016;119:1313–1323. [DOI] [PMC free article] [PubMed] [Google Scholar]
- 40. Stone GW, Maehara A, Lansky AJ, de Bruyne B, Cristea E, Mintz GS, Mehran R, McPherson J, Farhat N, Marso SP, Parise H, Templin B, White R, Zhang Z, Serruys PW; PROSPECT Investigators . A prospective natural‐history study of coronary atherosclerosis. N Engl J Med. 2011;364:226–235. [DOI] [PubMed] [Google Scholar]
- 41. Flurkey K, Currer JM, Harrison DE. The mouse in aging research In: Fox JG, Davisson MT, Quimby FW, Barthold SW, Newcomer CE, Smith AL, eds. The Mouse in Biomedical Research. 2nd ed Burlington, MA: Elsevier; 2007:637–672. [Google Scholar]
- 42. Dutta S, Sengupta P. Men and mice: relating their ages. Life Sci. 2016;152:244–248. [DOI] [PubMed] [Google Scholar]
- 43. Daemen MJ, Ferguson MS, Gijsen FJ, Hippe DS, Kooi ME, Demarco K, van der Wal AC, Yuan C, Hatsukami TS. Carotid plaque fissure: an underestimated source of intraplaque hemorrhage. Atherosclerosis. 2016;254:102–108. [DOI] [PMC free article] [PubMed] [Google Scholar]
- 44. Takabe W, Li R, Ai L, Yu F, Berliner JA, Hsiai TK. Oxidized low‐density lipoprotein‐activated c‐Jun NH2‐terminal kinase regulates manganese superoxide dismutase ubiquitination: implication for mitochondrial redox status and apoptosis. Arterioscler Thromb Vasc Biol. 2010;30:436–441. [DOI] [PMC free article] [PubMed] [Google Scholar]
- 45. Ballinger SW, Patterson C, Yan CN, Doan R, Burow DL, Young CG, Yakes FM, Van Houten B, Ballinger CA, Freeman BA, Runge MS. Hydrogen peroxide‐ and peroxynitrite‐induced mitochondrial DNA damage and dysfunction in vascular endothelial and smooth muscle cells. Circ Res. 2000;86:960–966. [DOI] [PubMed] [Google Scholar]
- 46. Harrison CM, Pompilius M, Pinkerton KE, Ballinger SW. Mitochondrial oxidative stress significantly influences atherogenic risk and cytokine‐induced oxidant production. Environ Health Perspect. 2011;119:676–681. [DOI] [PMC free article] [PubMed] [Google Scholar]
- 47. Clarke MC, Figg N, Maguire JJ, Davenport AP, Goddard M, Littlewood TD, Bennett MR. Apoptosis of vascular smooth muscle cells induces features of plaque vulnerability in atherosclerosis. Nat Med. 2006;12:1075–1080. [DOI] [PubMed] [Google Scholar]
- 48. da Cunha V, Martin‐McNulty B, Vincelette J, Choy DF, Li WW, Schroeder M, Mahmoudi M, Halks‐Miller M, Wilson DW, Vergona R, Sullivan ME, Wang YX. Angiotensin II induces histomorphologic features of unstable plaque in a murine model of accelerated atherosclerosis. J Vasc Surg. 2006;44:364–371. [DOI] [PubMed] [Google Scholar]
- 49. Chistiakov DA, Orekhov AN, Bobryshev YV. Contribution of neovascularization and intraplaque haemorrhage to atherosclerotic plaque progression and instability. Acta Physiol (Oxf). 2015;213:539–553. [DOI] [PubMed] [Google Scholar]
- 50. Finet G, Ohayon J, Rioufol G. Biomechanical interaction between cap thickness, lipid core composition and blood pressure in vulnerable coronary plaque: impact on stability or instability. Coron Artery Dis. 2004;15:13–20. [DOI] [PubMed] [Google Scholar]
- 51. Ohayon J, Teppaz P, Finet G, Rioufol G. In‐vivo prediction of human coronary plaque rupture location using intravascular ultrasound and the finite element method. Coron Artery Dis. 2001;12:655–663. [DOI] [PubMed] [Google Scholar]
- 52. Van Remmen H, Ikeno Y, Hamilton M, Pahlavani M, Wolf N, Thorpe SR, Alderson NL, Baynes JW, Epstein CJ, Huang TT, Nelson J, Strong R, Richardson A. Life‐long reduction in MnSOD activity results in increased DNA damage and higher incidence of cancer but does not accelerate aging. Physiol Genomics. 2003;16:29–37. [DOI] [PubMed] [Google Scholar]
- 53. Mercer JR, Cheng KK, Figg N, Gorenne I, Mahmoudi M, Griffin J, Vidal‐Puig A, Logan A, Murphy MP, Bennett M. DNA damage links mitochondrial dysfunction to atherosclerosis and the metabolic syndrome. Circ Res. 2010;107:1021–1031. [DOI] [PMC free article] [PubMed] [Google Scholar]
- 54. Yu E, Mercer J, Bennett M. Mitochondria in vascular disease. Cardiovasc Res. 2012;95:173–182. [DOI] [PubMed] [Google Scholar]
- 55. Gorlach A, Bertram K, Hudecova S, Krizanova O. Calcium and ROS: a mutual interplay. Redox Biol. 2015;6:260–271. [DOI] [PMC free article] [PubMed] [Google Scholar]
- 56. Vindis C, Elbaz M, Escargueil‐Blanc I, Auge N, Heniquez A, Thiers JC, Negre‐Salvayre A, Salvayre R. Two distinct calcium‐dependent mitochondrial pathways are involved in oxidized LDL‐induced apoptosis. Arterioscler Thromb Vasc Biol. 2005;25:639–645. [DOI] [PubMed] [Google Scholar]
- 57. Volcik KA, Campbell S, Chambless LE, Coresh J, Folsom AR, Mosley TH, Ni H, Wagenknecht LE, Wasserman BA, Boerwinkle E. MMP2 genetic variation is associated with measures of fibrous cap thickness: the Atherosclerosis Risk in Communities Carotid MRI Study. Atherosclerosis. 2010;210:188–193. [DOI] [PMC free article] [PubMed] [Google Scholar]
- 58. Kang SJ, Mintz GS, Weisz G, Mehran R, Rabbani LE, Verheye S, Serruys PW, Xu K, Stone GW, Maehara A. Age‐related effects of smoking on coronary artery disease assessed by gray scale and virtual histology intravascular ultrasound. Am J Cardiol. 2015;115:1056–1062. [DOI] [PubMed] [Google Scholar]
- 59. Kang SJ, Mintz GS, Witzenbichler B, Metzger DC, Rinaldi MJ, Duffy PL, Weisz G, Stuckey TD, Brodie BR, Shimizu T, Litherland C, Kirtane AJ, Stone GW, Maehara A. Age‐related effects of smoking on culprit lesion plaque vulnerability as assessed by grayscale and virtual histology‐intravascular ultrasound. Coron Artery Dis. 2015;26:476–483. [DOI] [PubMed] [Google Scholar]
- 60. Wendorff C, Wendorff H, Kuehnl A, Tsantilas P, Kallmayer M, Eckstein HH, Pelisek J. Impact of sex and age on carotid plaque instability in asymptomatic patients—results from the Munich Vascular Biobank. Vasa. 2016;45:411–416. [DOI] [PubMed] [Google Scholar]
- 61. Dikalova AE, Bikineyeva AT, Budzyn K, Nazarewicz RR, McCann L, Lewis W, Harrison DG, Dikalov SI. Therapeutic targeting of mitochondrial superoxide in hypertension. Circ Res. 2010;107:106–116. [DOI] [PMC free article] [PubMed] [Google Scholar]
- 62. Dikalova AE, Itani HA, Nazarewicz RR, McMaster WG, Flynn CR, Uzhachenko RV, Fessel JP, Gamboa JL, Harrison DG, Dikalov SI. Sirt3 impairment and SOD2 hyperacetylation in vascular oxidative stress and hypertension. Circ Res. 2017;121:564–574. [DOI] [PMC free article] [PubMed] [Google Scholar]
Associated Data
This section collects any data citations, data availability statements, or supplementary materials included in this article.
Supplementary Materials
Figure S1. Plasma lipid levels in young and aged Apoe−/− compared with Apoe−/−/Sod2+/− mice. A and B, Plasma levels of total cholesterol (A) and triglycerides (B). Data are mean±SEM, n=12. SEM indicates standard error of the mean.
Figure S2. Transfection of VSMC from middle‐age wild‐type mice with Capn2 siRNA:p5RHH nanocomplexes effectively reduces calpain‐2 but not calpain‐1 expression levels. Western blot analysis of calpain‐2 and calpain‐1 expression in VSMC transfected with scrambled siRNA or Capn2 siRNA:p5RHH nanocomplexes. VSMC indicates vascular smooth muscle cells.
Figure S3. Plaque VSMC transdifferentiation to macrophage‐like cells in Apoe −/− and Apoe −/−/Sod2 +/− mice. A, Representative fluorescent microscopy images of fresh‐frozen transverse aortic sections stained for immunoreactive CD68 (red), smooth muscle SM‐MHC (green), and DAPI (blue) and quantification of proportion of CD68+ SM‐MHC+ cells relative to total core CD68+ cells (mean±SEM, n=6). B, Representative fluorescent microscopy images of fresh‐frozen transverse aortic sections stained for immunoreactive Mac3 (green), smooth muscle α‐actin (red), and DAPI (blue) and quantification of proportion of Mac3+ α‐actin+ cells relative to total plaque Mac3+ cells (mean±SEM, n=6). Scale is 100 μm. SEM indicates standard error of the mean; VSMC, vascular smooth muscle cells..
Figure S4. Systemic effects of MitoTEMPO treatment in middle‐aged Apoe −/− and Apoe −/−/Sod2 +/− mice. A through E, Plasma levels of total cholesterol (A), triglycerides (B), blood urea nitrogen (BUN) (C), creatinine (D), and alanine aminotransferase (E). Data are mean±SEM, n=8. F and G, Representative images of mouse kidney (F) and liver (G) sections stained with H&E. N=4. Scale is 100 μm. H&E indicates hematoxylin and eosin; SEM, standard error of the mean.
Figure S5. Frozen transverse aortic sections stained for immunoreacative MMP2 (green), CD68 (red) and DAPI (blue) and quantification of MMP2 expression in CD68+ cells represented as fluorescence integrated density (IntDen) per number of cells (mean±SEM, n=6). Scale is 100 μm. *P<0.05; **P<0.01. MMP indicates matrix metalloproteinase; SEM, standard error of the mean.