

Abstract
Background
Among women aged 50 to 59 years at baseline in the Women's Health Initiative (WHI) Estrogen‐Alone (E‐Alone) trial, randomization to conjugated equine estrogen‐alone versus placebo was associated with lower risk of myocardial infarction and mortality, and, in an ancillary study, the WHI‐CACS (WHI Coronary Artery Calcification Study) with lower CAC, measured by cardiac computed tomography ≈8.7 years after baseline randomization. We hypothesized that higher CAC would be related to post‐trial coronary heart disease (CHD), cardiovascular disease (CVD), and total mortality, independent of baseline randomization or risk factors.
Methods and Results
WHI‐CACS participants (n=1020) were followed ≈8 years from computed tomography scan in 2005 (mean age=64.4) through 2013 for incident CHD (myocardial infarction and fatal CHD, n=17), CVD (n=69), and total mortality (n=55). Incident CHD and CVD analyses excluded women with CVD before scan (n=89). Women with CAC=0 (n=54%) had very low age‐adjusted rates/1000 person‐years of CHD (0.91), CVD (5.56), and mortality (3.45). In comparison, rates were ≈2‐fold higher for women with any CAC (>0). Associations were not modified by baseline randomization to conjugated equine estrogen–alone versus placebo. Adjusted for baseline randomization and risk factors, the hazard ratio (95% confidence interval) for CAC >100 (19%) was 4.06 (2.11, 7.80) for CVD and 2.70 (1.26, 5.79) for mortality.
Conclusions
Among a subset of postmenopausal women aged 50 to 59 years at baseline in the WHI E‐Alone Trial, CAC at mean age of 64 years was strongly related to incident CHD, CVD, and to total mortality over ≈8 years, independent of baseline randomization to conjugated equine estrogen–alone versus placebo or CVD risk factors.
Clinical Trial Registration
URL: https://www.clinicaltrials.gov. Unique identifier: NCT00000611.
Keywords: cardiovascular disease, coronary artery calcification, hormonal therapy, mortality, women
Subject Categories: Cardiovascular Disease, Women, Mortality/Survival, Computerized Tomography (CT), Risk Factors
Clinical Perspective
What Is New?
Among hysterectomized postmenopausal women aged 50 to 59 years at baseline in the E‐Alone Trial (Women's Health Initiative Estrogen‐Alone Trial), higher coronary artery calcification (CAC) ≈8 years after baseline was strongly related to subsequent coronary heart disease, cardiovascular disease (CVD), and total mortality over ≈8 years.
Although baseline CVD risk factors and randomized estrogen treatment were previously shown to be related to CAC measured ≈8 years later, associations of CAC with incident outcomes were largely unaffected by prior levels of CVD risk factors or randomized estrogen treatment.
What Are the Clinical Implications?
Among postmenopausal women with a mean age of 64 years, coronary heart disease, CVD, and mortality rates are very low among those with CAC=0, are higher with any CAC (>0), and very high among those with CAC=400.
Because prior risk factor exposures are the primary determinants of CAC, prevention of CVD risk factors early in pre‐ or perimenopause could substantially reduce coronary heart disease, CVD, and mortality among postmenopausal women.
In the Women's Health Initiative (WHI) randomized clinical trial of Estrogen‐Alone (E‐Alone), conducted among hysterectomized postmenopausal women aged 50 to 79 years at baseline, randomization to oral conjugated equine estrogen alone (CEE‐alone) was not associated with reduced risk of coronary heart disease (CHD).1 However, an a priori subgroup analysis showed that among younger women (ages 50–59 years at study entry), randomization to CEE‐alone was associated with a lower risk of the composite CHD end point (myocardial infarction [MI] +CHD death+coronary revascularization, hazard ratio [HR]: 0.66, 95% confidence interval [CI], 0.44–0.97) at the end of the intervention period.2 Similarly, in extended follow‐up (≈13 years postrandomization) among women aged 50 to 59 years at baseline, randomization to CEE‐Alone versus placebo was associated with lower risk of incident MI (HR [95% CI]=0.60 [0.39, 0.91]), CHD (HR [95% CI]=0.65 [0.44, 0.96]), and total mortality (HR [95% CI]= 0.78 [0.59, 1.03]).3 The benefit of CEE‐alone (versus placebo) persisted in this 13‐year post‐trial follow‐up, because of benefit during the intervention period, without additional reduction in risk during the postintervention period3, 4
An ancillary study, the WHI CACS (Coronary Artery Calcification Study) was conducted to test the hypothesis that randomization to CEE‐alone reduced CHD in women aged 50 to 59 years at randomization by reducing development and progression of atherosclerosis, as measured by CAC. CAC was measured ≈1.3 years after the end of the trial, ≈8.7 years after randomization (Figure 1) among a subset of WHI E‐Alone Trial participants aged 50 to 59 years at baseline. The WHI‐CACS reported that women randomized to CEE‐Alone had lower risk of CAC >100 (multivariable‐adjusted odds ratio [OR]=0.69 [95% CI, 0.48, 0.98]) compared with women randomized to placebo. This association was adjusted for cardiovascular disease (CVD) risk factors associated with CAC, including current smoking (OR for CAC >100=4.18, P=0.001), hypertension (OR=1.67, P=0.01), high cholesterol (OR=1.89, P=0.03), diabetes mellitus (OR=3.08, P=0.0003), family history of MI at a premature age (OR=1.60, P=0.04), and body mass index (BMI) >35 kg/m2 (OR=2.04, P=0.03).5
Figure 1.
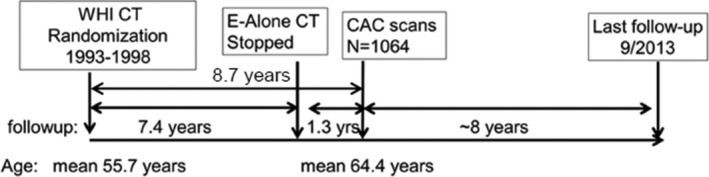
WHI‐CACS study timeline. CAC indicates coronary artery calcium; CACS, Coronary Artery Calcification study; CT, clinical trial; E‐Alone, estrogen‐alone; WHI, Women's Health Initiative.
Therefore, we hypothesized that in WHI‐CACS, CAC would be strongly associated with incident CHD, CVD, and total mortality during extended follow‐up from CAC scan (2005) through 2013, independent of prior randomization and CVD risk factors. We further hypothesized that CAC associations with outcomes would be independent of predictors of CAC, including baseline randomization to CEE‐Alone versus placebo and CVD risk factors. Finally, we hypothesized that CAC would substantially explain associations of baseline randomization and risk factors with post‐trial events and mortality. Specifically, our aims were (1) to compare CAC with baseline randomization and CVD risk factors, as predictors of incident CHD and CVD and total mortality; and (2) to compare CAC associations with outcomes for CEE‐Alone versus placebo. Long‐term follow‐up of the WHI‐CACS provides a unique opportunity to evaluate whether prior randomized estrogen‐alone hormone therapy modifies the relationship between CAC and subsequent CVD or all‐cause mortality.
Methods
This study evaluates incident CHD and CVD events and total mortality among women who participated in the WHI‐CACS, an ancillary study of WHI E‐Alone trial participants who were aged 50 to 59 years at randomization. For both the WHI E‐Alone trial and the WHI‐CACS, institutional review board approval was obtained at each clinical center and all participants provided written informed consent.
E‐Alone Trial
The design and methods of the WHI E‐Alone trial and baseline participant characteristics have been published.1 Briefly, the participants were postmenopausal women with prior hysterectomy and aged 50 to 79 years at randomization. Women were randomized to oral CEE (0.625 mg per day, Premarin, Wyeth Pharmaceuticals) or placebo. The WHI E‐Alone trial was originally scheduled to continue through closeout visits between October 2004 and March 2005. However, the trial was stopped ≈1 year early, because of an increased risk of stroke and no decreased risk of CHD. On March 1, 2004, study participants were informed of this decision, their group assignment, and instructed to discontinue the study medication.1
At baseline (1995–1998), data were collected on demographics, medical history, medications, measured height, weight, and blood pressure.1, 6 Lipids and glucose were not routinely measured in WHI participants. Therefore, as in previous reports, high cholesterol was defined as physician's diagnosis and/or treatment for high cholesterol. Diabetes mellitus was defined as a physician's diagnosis that required oral medication or insulin.1 Hypertension (systemic) was defined as systolic blood pressure ≥140 mm Hg or diastolic blood pressure ≥90 mm Hg or use of antihypertensive therapy. Recreational physical activity was calculated from self‐report based on a structured questionnaire, defined as expenditure of energy from recreational physical activity (includes walking, mild, moderate, and strenuous physical activity) and expenditure of energy was estimated by total metabolic equivalents per week (kcal/wk per kg), as previously described in detail.1 Cigarette smoking was categorized as current, past, or never. In sensitivity analyses, current smokers were categorized as 1 to 14 cigarettes/d or >15 cigarettes/d, and systolic blood pressure was categorized as <118, 118 to 130, and >130 mm Hg.
Design of the WHI‐CACS Ancillary Study
The WHI E‐Alone Trial had 40 clinical sites that randomized women to CEE‐alone or placebo. Of these women, 3310 were aged 50 to 59 years at baseline, of whom 1637 were randomized to CEE‐alone and 1673 to placebo. The WHI‐CACS was able to include 2271 of these women from 28 of the WHI clinical sites.5 Exclusion criteria were (1) a request by the participant for no further clinic visits; (2) weight of ≥300 lb (136 kg) precluding CACS assessment because of technical restrictions; or (3) loss to follow‐up or death since randomization. Following exclusion for 1 or more of these reasons (n=529, 23.3%), 1742 women were eligible and were sent invitational letters. A total of 1079 women (61.9% of the 1742 eligible participants at the 28 clinical centers) provided written informed consent and underwent cardiac computed tomography (CT) examinations between May 2005 and September 2005. The mean time from randomization to CAC scan was 8.7 years, including mean=7.4 years of the trial and mean=1.3 years after the intervention stopped (Figure 1).
CAC Measurement
Noninvasive imaging for coronary artery calcification was performed with the use of electron‐beam or multidetector‐row CT at the 28 participating centers, as previously described.5 A standardized protocol was used to obtain phantom and test images.7, 8, 9 At a central reading center at Wake Forest University, the Agatston scores were calculated at a computer workstation by experienced image analysts using established criteria, and without knowledge of randomization status.5, 8 Of the 1079 participants with CT scans, 3 women had incomplete scans, and 12 women were excluded because of history of coronary revascularization or presence of stents, leaving 1064 participants in the WHI‐CACS.5
Follow‐Up for Events
WHI‐CACS participants were followed for events according to WHI E‐Alone trial methods.1, 10 Cardiovascular outcomes and deaths were identified by semiannual or annual follow‐up with participants, or family, friends, medical care providers, obituaries, and the National Death Index. Primary analyses evaluated events that occurred after the CT scans (2005) through September 2013, with mean follow‐up of 8 years (Figure 1). CHD was defined as first occurrence of clinical MI, definite silent MI, or death as a result of definite or possible CHD. Both incident and prevalent CVD were defined as CHD, stroke, angina, coronary revascularization, carotid surgery, peripheral vascular disease, and CVD death. Events were also classified by whether they were first CVD event or all CVD events (ie, first and subsequent events).
After the cardiac CT scan, 44 women had no follow‐up for events other than death (from the National Death Index), and so were excluded from all analyses of CHD and CVD events, and from primary mortality analyses. CHD and CVD analyses also excluded 89 women with CVD before CAC measurement. Of these, 40 had prevalent CVD at entry to the WHI E‐Alone Trial and 49 had CVD events that occurred between randomization and the CT scan. Therefore, primary mortality analyses included 1020 women (N=1064 minus 44) and primary CHD and CVD analyses included 931 women (N=1020 minus 89). Sensitivity analyses evaluated potential effects of these exclusions on results.
Statistical Analysis
Between‐group differences were assessed using t tests, Wilcoxon, and χ2 tests, as appropriate. CAC scores were skewed, with >50% of participants having CAC=0. Therefore, CAC scores were categorized as 0, 1 to 100, and >100, or 0, 1 to 10, 11 to 100, 101 to 400, and >400 Agatston units. Age‐adjusted event rates and 95% CIs per 1000 person‐years (PY) were calculated for categories of CAC, CEE‐Alone versus placebo, and risk factors using the direct method with the entire WHI E‐Alone Trial as the standard population. Associations of CAC categories and risk factors measured at baseline with events were tested using Cox proportional hazards regression. Models were adjusted for age, and then sequentially for randomization status and CVD risk factors. Specifically, we tested whether higher CAC is independently associated with incident events and whether associations are modified by prior randomization to E‐Alone or to placebo. Effect modification, or interaction, was evaluated on the additive scale by comparing age‐adjusted rates for women previously randomized to E‐alone versus placebo (homogeneity of effects). Effect modification or interaction was also evaluated on the relative scale by including a multiplicative interaction term (E‐Alone versus placebo*CAC category) in Cox regression models, with P<0.05 indicating significant interaction on the multiplicative scale. The proportional hazards assumption for CAC categories was tested by including interaction terms for time × CAC categories, and was met in all models.
Results
Participant Characteristics
For the 1020 women with follow‐up data, at the baseline WHI visit mean age was 55.1 years (range 50–59), mean BMI was 30.6 kg/m2, 11.54% were current smokers, 31.37% had hypertension, 9.55% had high cholesterol, and 47.94% had a family history of MI in first‐degree relative (Table S1). At the time of CT scan, ≈8.7 years after WHI baseline, the mean age was 64.4 years, and 8.7% had prior CVD. More than half of the women (n=550, 54%) had CAC=0, 27% (n=273) had CAC=1 to 100, and 19% (n=197) had CAC >100 (Table S1). Stratified by prior randomization to CEE‐alone (n=517) versus placebo (n=503), risk factors among the 1020 women with follow‐up data were similar, but CAC was lower among women previously randomized to CEE‐alone (Table S1) as previously reported for the entire WHI‐CACS.5 Sensitivity analyses showed similar results when restricted to the 931 women without CVD before scan (not shown). Furthermore, the distribution of CAC scores in the 44 women without follow‐up visits was similar to the overall population (not shown).
Age‐Adjusted Event Rates by CAC Categories
Among the 931 women with no CVD before the scan, 69 first CVD events, including 2 CVD deaths, occurred during the ≈8‐year follow‐up after scan. Age‐adjusted incidence rates of CVD and coronary revascularization were higher with higher CAC categories (Figure 2). CHD, angina, and stroke (to a lesser extent) showed a similar pattern of higher rates with higher CAC categories, although confidence intervals were wide because of the small number of events (Figure 2). Results were similar for first events and for all (including subsequent) events (not shown). Similarly, among the 1020 women with follow‐up, total mortality, CVD mortality, and non‐CVD mortality were all higher for CAC ≥100 than CAC=0, despite the small number of events for CVD mortality (Figure 3). In sensitivity analyses, results for mortality were similar if women with prior CVD were excluded, or those without follow‐up data other than National Death Index (n=44) were included (not shown).
Figure 2.
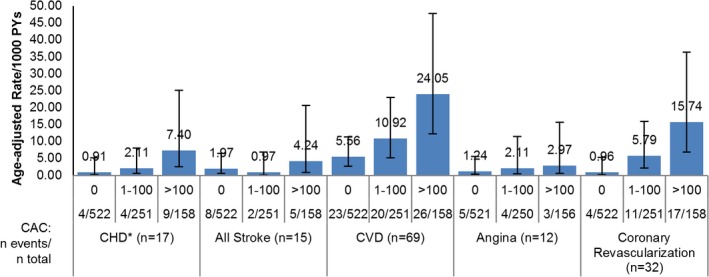
Age‐adjusted CVD rates per 1000 PYs, by CAC categories. Results are among women without CVD before scan, n=931. Results for CVD and angina are for first events only. Results for CHD, stroke, and coronary revascularization include first and subsequent events. CAC categories defined as 0, 1 to 100, >100. Error bars show 95% confidence intervals for rates. CAC indicates coronary artery calcium; CHD, coronary heart disease; CVD, cardiovascular disease; PYs, person‐years.
Figure 3.
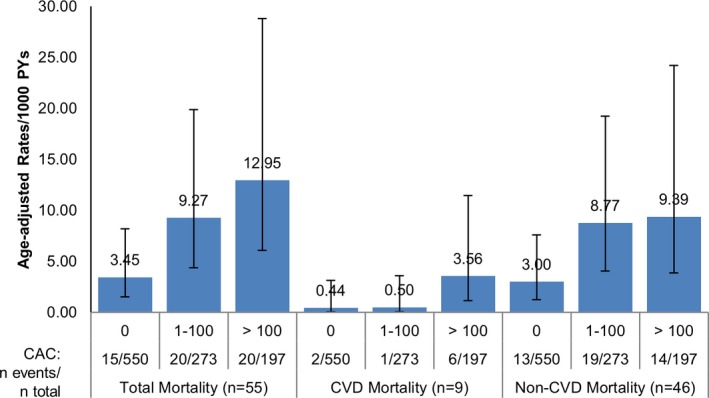
Age‐adjusted mortality rates per 1000 PYs, by CAC categories. Results are among 1020 women. CAC categories defined as 0, 1 to 100, >100. Error bars show 95% confidence intervals for rates. CAC indicates coronary artery calcium; CVD, cardiovascular disease; PYs, person‐years.
Stratified by baseline randomization to CEE‐Alone versus placebo (Table 1), CHD, CVD, and total mortality age‐adjusted rates/1000 PYs were all higher with higher CAC categories, but were similar for women previously randomized to CEE‐Alone compared with placebo, both within CAC categories and for the entire group (Table 1). Thus, for all 3 outcomes, there was no evidence that randomization status modified CAC associations with absolute risk (age‐adjusted rates). Similarly, there was no evidence of interaction assessed via a multiplicative interaction term (CEE‐alone versus placebo*CAC categories) in age‐adjusted Cox models (not shown).
Table 1.
Outcome by HT Arm and CAC Category
| Event | CAC | Placebo | CEE‐Alone | ||||
|---|---|---|---|---|---|---|---|
| n | No. of Events | Age‐Adjusted Rate/1000 PY (95% CI) | n | No. of Events | Age‐Adjusted Rate/1000 PYs (95% CI) | ||
| CHDa (all events) | All | 454 | 7 | 1.99 (0.68, 7.34) | 477 | 10 | 2.72 (0.98, 7.83) |
| 0 | 241 | 1 | 0.60 (0.08, 4.24) | 281 | 3 | 1.30 (0.27, 6.73) | |
| 1 to 100 | 124 | 2 | 2.17 (0.54, 8.68) | 127 | 2 | 1.98 (0.28, 14.07) | |
| >100 | 89 | 4 | 5.62 (1.39, 26.76) | 69 | 5 | 9.69 (2.31, 48.02) | |
| CVDa (first CVD event) | All | 454 | 28 | 8.08 (4.37, 15.21) | 477 | 41 | 11.08 (6.53, 18.85) |
| 0 | 241 | 9 | 4.90 (1.63, 15.19) | 281 | 14 | 6.11 (2.49, 15.28) | |
| 1 to 100 | 124 | 8 | 9.12 (3.03, 29.61) | 127 | 12 | 13.07 (5.19, 34.39) | |
| >100 | 89 | 11 | 15.78 (5.90, 50.20) | 69 | 15 | 34.18 (14.38, 82.39) | |
| Deathb | All | 503 | 33 | 8.38 (4.76, 15.03) | 517 | 22 | 5.43 (2.71, 11.06) |
| 0 | 256 | 9 | 4.70 (1.64, 14.30) | 294 | 6 | 2.53 (0.82, 7.86) | |
| 1 to 100 | 135 | 11 | 9.91 (3.57, 28.57) | 138 | 9 | 8.74 (3.06, 26.56) | |
| >100 | 112 | 13 | 14.16 (5.67, 40.21) | 85 | 7 | 11.07 (3.05, 40.77) | |
CAC indicates coronary artery calcium; CEE, conjugated equine estrogen; CHD, coronary heart disease; CVD, cardiovascular disease; HF, heart failure; HT, hormone therapy; PY, person‐years.
n=931, excluding surgical stent (n=10), no follow‐up (n=44), and prior CVD (n=89).
n=1020, excluding surgical stent (n=10), no follow‐up (n=44).
Age‐Adjusted CHD Rates by CAC and Baseline Risk Factor Categories
Given the low number of CHD events (n=17) among women without CVD before scan, we did not calculate HR (95% CI). However, for comparison with CVD events, we calculated age‐adjusted CHD rates for CAC categories (0, 1–10, 11–100, 100–400, and >400), and for risk factors from ≈8.7 years before cardiac CT scan (Table 2). Of the 535 women with CAC=0, only 4 (0.77%) had incident CHD events, with a very low age‐adjusted CHD rate of 0.91 (0.17, 5.26) per 1000 PYs. Compared with CAC=0, CHD rates were higher for any CAC (>0). Among women with CAC 1 to 10, 2/75 (2.67%) had CHD events (age‐adjusted rate of 5.03 [1.26, 20.10]/1000 PYs), and of the women with CAC 11 to 100, 2/176 (1.14%) had CHD events (age‐adjusted rate of 1.33 [0.19, 9.47]/1000 PYs). Combining these 2 categories into CAC 1 to 100, 4/251 (1.59%) had CHD events, with an age‐adjusted rate (95% CI) of 2.11 (0.61, 8.12) per 1000 PYs. For CAC >100, 9/158 (5.7%) had incident CHD, with an age‐adjusted rate (95% CI) of 7.40 (2.56, 25.09, not shown). However, among CAC>400, 6/50 (12%) had CHD events, with an age‐adjusted rate (95% CI) of 18.22 (4.79, 74.80) per 1000 PYs. Furthermore, although these 50 women with CAC>400 were only 5.4% of the entire cohort, they accounted for 35% (6/17) of the total number of CHD events. The prevalence of CAC>400 was related to older age, smoking, hypertension, and high cholesterol, and increased with number of risk factors, from 3.9% of women with 0 CVD risk factors to 16% of those with 3+ risk factors (not shown). In comparison, age‐adjusted CHD rates were modestly higher for current versus never smokers (5.58 [2.09, 14.87] versus 2.25 [0.78, 7.46] per 1000 PYs) and for presence versus absence of family history of MI in first‐degree relative (3.16 [1.26, 9.30] versus 1.58 [0.40, 6.32] per 1000 PYs), but were relatively similar by other risk factors, such as hypertension yes versus no (2.82 [0.94, 8.84] versus 2.17 [0.99, 4.93] per 1000 PY, Table 2).
Table 2.
Age‐Adjusted CHD Rates/1000 PY by CAC and Baseline Characteristics, n=931a
| Characteristic | N | No. CHD | Age‐Adjusted CHD Rate/1000 PY (95% CI) |
|---|---|---|---|
| CAC | |||
| 0 | 522 | 4 | 0.91 (0.17, 5.26) |
| 1 to 10 | 75 | 2 | 5.03 (1.26, 20.10) |
| 11 to 100 | 176 | 2 | 1.33 (0.19, 9.47) |
| 101 to 400 | 108 | 3 | 2.77 (0.89, 8.59) |
| >400 | 50 | 6 | 18.22 (4.79, 74.80) |
| Age group, yb | |||
| 50 to 54 | 375 | 4 | 0.86 (0.32, 2.29) |
| 55 to 59 | 556 | 13 | 2.89 (1.39, 6.33) |
| Smoking | |||
| Never | 455 | 8 | 2.25 (0.78, 7.46) |
| Past | 364 | 5 | 1.70 (0.39, 7.92) |
| Current | 106 | 4 | 5.58 (2.09, 14.87) |
| Hypertension | |||
| No | 661 | 11 | 2.17 (0.99, 4.93) |
| Yes | 267 | 6 | 2.82 (0.94, 8.84) |
| High cholesterol | |||
| No | 728 | 12 | 2.15 (0.87, 5.64) |
| Yes | 70 | 2 | 3.25 (0.81, 13.00) |
| Diabetes mellitus | |||
| No | 884 | 16 | 2.34 (1.06, 5.38) |
| Yes | 46 | 1 | 3.00 (0.42, 21.32) |
| MI in first‐degree relative | |||
| No | 478 | 6 | 1.58 (0.40, 6.32) |
| Yes | 406 | 10 | 3.16 (1.26, 9.30) |
| Body mass index, kg/m2 | |||
| <25 | 170 | 4 | 3.47 (0.98, 13.86) |
| 25.1 to 29.9 | 315 | 4 | 1.61 (0.31, 8.99) |
| 30 to 34.9 | 238 | 6 | 3.23 (0.98, 13.06) |
| ≥35 | 203 | 3 | 1.87 (0.39, 9.76) |
| Waist circumference, cm | |||
| ≤88 | 407 | 8 | 2.71 (1.09, 7.15) |
| >88 | 522 | 9 | 2.24 (0.79, 6.92) |
CAC indicates coronary artery calcium; CHD, coronary heart disease; MI, myocardial infarction; PY, person‐years.
Excluding no follow‐up (n=44) or CVD before scan (n=89).
All results except age are age‐adjusted.
Age‐Adjusted CVD Risk by CAC and Baseline Risk Factor Categories
Age‐adjusted CVD rates (Table 3) were also low (5.56/1000 PY) for CAC=0, but were more than doubled with presence of CAC starting at 11 to 100 (11.38/1000 PYs), and increased to 47.21/1000 PY for women with CAC=400, with a corresponding HR (95% CI)=7.97 (4.07, 15.59). Age‐adjusted CVD rates were lower for CAC=0 than with absence of any individual risk factor except BMI<25 (only 18.3% of the study cohort). For most risk factors, age‐adjusted CVD rates were much higher with CAC>400 than with presence of any individual risk factor, including diabetes mellitus. In separate age‐adjusted Cox models, baseline hypertension, high cholesterol, premature MI in first‐degree relatives, and BMI (30–34.9 or >35 versus BMI <25) were also each significantly associated with CVD, with HR >1.8 (Table 3).
Table 3.
| Characteristic | N | No. CVD | Age‐Adjusted CVD Rate/1000 PY | Age‐Adjusted HR (95% CI)c | |
|---|---|---|---|---|---|
| CAC | 0 | 522 | 23 | 5.56 (2.74, 11.31) | 1.00 |
| 1 to 10 | 75 | 5 | 9.63 (2.28, 42.26) | 1.53 (0.58, 4.03) | |
| 11 to 100 | 176 | 15 | 11.38 (4.90, 27.39) | 2.02 (1.05, 3.88)d | |
| 101 to 400 | 108 | 12 | 14.93 (5.55, 42.36) | 2.69 (1.32, 5.45)d | |
| >400 | 50 | 14 | 47.21 (19.20, 118.28) | 7.97 (4.07, 15.59)d | |
| Age group, ye | 50 to 54 | 375 | 23 | 8.12 (4.23, 16.27) | 1.00 |
| 55 to 59 | 556 | 46 | 10.92 (7.25, 16.49) | 1.56 (0.58, 4.21) | |
| Current smoking | Never | 455 | 35 | 9.93 (5.65, 17.54) | 1.00 |
| Past | 364 | 24 | 8.50 (4.25, 17.01) | 0.86 (0.51, 1.45) | |
| Current | 106 | 10 | 13.74 (5.29, 40.17) | 1.34 (0.66, 2.71) | |
| Hypertension | No | 661 | 40 | 7.86 (4.67, 13.34) | 1.00 |
| Yes | 267 | 29 | 14.55 (7.74, 27.32) | 1.87 (1.16, 3.01)d | |
| High cholesterol | No | 728 | 46 | 8.19 (5.01, 13.47) | 1.00 |
| Yes | 70 | 9 | 17.79 (5.88, 57.35) | 2.05 (1.00, 4.21)d | |
| Diabetes mellitus | No | 884 | 63 | 9.29 (6.08, 14.21) | 1.00 |
| Yes | 46 | 6 | 18.19 (4.94, 72.31) | 1.88 (0.82, 4.35) | |
| MI in first‐degree relative | No | 478 | 25 | 6.80 (3.47, 13.36) | 1.00 |
| Yes | 406 | 40 | 12.82 (7.53, 21.92) | 1.90 (1.15, 3.13)d | |
| Body mass index, kg/m2 | <25 | 170 | 6 | 4.89 (1.35, 19.02) | 1.00 |
| 25 to 29.9 | 315 | 22 | 9.02 (4.37, 18.68) | 1.96 (0.79, 4.83) | |
| 30 to 34.9 | 238 | 23 | 12.74 (6.47, 25.58) | 2.72 (1.11, 6.69)d | |
| ≥35 | 203 | 18 | 11.63 (5.22, 25.99) | 2.60 (1.03, 6.56)d | |
| Waist circumference, cm | ≤88 | 407 | 23 | 7.50 (3.77, 15.06) | 1.00 |
| >88 | 522 | 46 | 11.51 (6.99, 18.96) | 1.57 (0.95, 2.59) |
CAC indicates coronary artery calcium; CI, confidence interval; CVD, cardiovascular disease; HF, heart failure; HR, hazard ratio; MI, myocardial infarction; PY, person‐years.
n=69 first events.
Excluding no follow‐up (n=44) or prior CVD (n=89).
HR (95% CI) from separate Cox Proportional Hazards Regression models, adjusted for age.
Statistically significant results.
Not adjusted for age.
Given the high rate of revascularizations, we also conducted sensitivity analyses to evaluate whether associations of CAC with CVD might be because of increased testing and subsequent revascularizations because of knowledge of high CAC scores. Of the 23 revascularizations that were first events, only 8 occurred within the first 2 years after the scan. Of these, 2 had CAC=0, 2 had scores 101 to 400, and 4 had CAC>400. With these women excluded, results were essentially unchanged, although age‐adjusted CVD rate/1000 PYs was slightly lower for CAC>400: 34.21 (11.58, 101.51, not shown).
Age‐Adjusted Mortality Risk by CAC and Baseline Risk Factor Categories
Age‐adjusted mortality rates (Table 4) were lowest for women with CAC=0 (3.45/1000 PYs), were higher for CAC=1 to 10, 11 to 100, and 101 to 400 compared with CAC=0, and were highest for women with CAC>400 (19.11/1000 PYs), baseline high cholesterol (19.81/1000 PYs), or CVD before cardiac scan (17.37/1000 PYs). Age‐adjusted mortality rates were also higher for hypertension versus no hypertension (10.44 versus 5.04/1000 PYs) and waist circumference >88 versus ≤88 cm (8.47 versus 4.71/1000 PYs, Table 4). Similarly, in separate age‐adjusted Cox models, the largest HR (95% CI): 5.67 (2.59, 12.40) was for CAC>400 (versus 0) but prior CVD, hypertension, high cholesterol, and waist circumference were also significantly associated with total mortality.
Table 4.
Age‐Adjusted Total Mortality Rates/1000 PY by CAC and Baseline Characteristics, n=1020a
| Characteristic | N | No. Deaths | Age‐Adjusted Death Rate/1000 PY (95% CI) | Age‐Adjusted HR (95% CI)b |
|---|---|---|---|---|
| CAC | ||||
| 0 | 550 | 15 | 3.45 (1.53, 8.22) | 1.00 |
| 1 to 10 | 80 | 7 | 12.57 (4.04, 43.00) | 3.24 (1.32, 7.94)c |
| 11 to 100 | 193 | 13 | 8.16 (3.22, 21.70) | 2.44 (1.16, 5.14)c |
| 101 to 400 | 125 | 9 | 10.31 (4.03, 26.42) | 2.57 (1.12, 5.91)c |
| >400 | 72 | 11 | 19.11 (8.23, 44.99) | 5.67 (2.59, 12.40)c |
| Prior CVD | ||||
| No | 931 | 43 | 5.85 (3.54, 9.74) | 1.00 |
| Yes | 89 | 12 | 17.37 (6.60, 51.46) | 3.02 (1.59, 5.77)c |
| Age group, yd | ||||
| 50 to 54 | 401 | 17 | 5.62 (2.65, 12.50) | 1.00 |
| 55 to 59 | 619 | 38 | 7.53 (4.86, 11.87) | 0.54 (0.17, 1.70) |
| Smoking | ||||
| Never | 496 | 25 | 6.26 (3.21, 12.30) | 1.00 |
| Past | 401 | 20 | 6.37 (3.15, 13.46) | 1.01 (0.56, 1.82) |
| Current | 117 | 10 | 11.42 (4.21, 33.63) | 1.83 (0.88, 3.82) |
| Hypertension | ||||
| No | 698 | 28 | 5.04 (2.76, 9.47) | 1.00 |
| Yes | 319 | 26 | 10.44 (5.48, 20.25) | 2.08 (1.22, 3.56)c |
| High cholesterol | ||||
| No | 786 | 35 | 5.71 (3.32, 10.02) | 1.00 |
| Yes | 83 | 13 | 19.81 (7.78, 53.94) | 3.37 (1.77, 6.39)c |
| Diabetes mellitus | ||||
| No | 957 | 52 | 6.90 (4.38, 10.96) | 1.00 |
| Yes | 62 | 3 | 6.01 (1.26, 30.99) | 0.89 (0.28, 2.84) |
| MI in first‐degree relative | ||||
| No | 505 | 24 | 6.22 (3.37, 12.17) | 1.00 |
| Yes | 465 | 27 | 7.22 (3.79, 13.91) | 1.17 (0.67, 2.03) |
| Body mass index, kg/m2 | ||||
| <25 | 179 | 8 | 5.57 (1.68, 18.70) | 1.00 |
| 25.1 to 29.9 | 344 | 16 | 5.74 (2.77, 13.57) | 0.99 (0.42, 2.46) |
| 30 to 34.9 | 269 | 13 | 5.98 (2.42, 15.37) | 1.02 (0.42, 2.46) |
| ≥35 | 223 | 18 | 10.64 (4.99, 23.33) | 1.87 (0.81, 4.30) |
| Waist circumference, cm | ||||
| ≤88 | 436 | 16 | 4.71 (2.08, 10.90) | 1.00 |
| >88 | 581 | 39 | 8.47 (5.00, 14.51) | 1.80 (1.01, 3.22)c |
CAC indicates coronary artery calcium; CI, confidence interval; CVD, cardiovascular disease; HR, hazard ratio; MI, myocardial infarction; PY, person‐years.
Excluding stents (n=10) or no follow‐up (n=44).
HR (95% CI) from separate Cox Proportional Hazards Regression models, adjusted for age.
Statistically significant results.
Not adjusted for age.
No specific cause of death uniquely contributed to the higher incidence of total mortality among women with higher CAC scores (not shown). Higher lung cancer deaths (n=10) were the leading cause of death, but were distributed across CAC scores. However, excluding women who reported current smoking at baseline, the number of deaths was reduced from 55 to 45, but the association of CAC with total‐ and non‐CVD mortality persisted (not shown). For example, non‐CVD deaths were almost 5‐fold higher for CAC >400 (13.3/1000 PYs, 6 deaths) compared with CAC=0 (2.8/1000 PYs, 11 deaths, not shown).
Multivariable‐Adjusted Risks of CHD, CVD, and Mortality
The low number of CHD cases (n=17) limited power for multivariable‐adjusted Cox regression models. However, in supplemental analyses, higher CAC category (CAC >100 versus CAC=0) was significantly associated with CHD (HR=7.94, 95% CI, 2.40–26.34) adjusted for age and CEE‐Alone versus placebo, which was only minimally attenuated when additionally adjusted for diabetes mellitus, smoking, hypertension, and high cholesterol (Table S2). Results were similar if women with CVD before scan were included, adjusted for prior CVD, which was also not significantly associated with CHD risk (not shown).
For incident CVD (Table 5), HR (95% CI) for CAC>100 and CAC 1 to 100 versus CAC=0 were 4.41 (2.49–7.82) and 1.91 (1.05, 3.47), respectively, when adjusted for age and prior randomization to CEE‐Alone versus placebo, which were not statistically significant (Model 1). In models that also included diabetes mellitus, smoking, hypertension, and high cholesterol (Model 2) or additionally, BMI categories (Model 3), HRs were attenuated for these risk factors but remained significant for CAC>100 (ref=0) in both models. Results were similar if women with CVD before scan were included (adjusted for prior CVD, which was not statistically significant, not shown).
Table 5.
Multivariable‐Adjusted HR (95% CI) for CVD and Total Mortality Risk by CAC Categories
| Predictors | CVD HR (95% CI) n=931a | Total Mortality HR (95% CI) n=1020b |
|---|---|---|
| Model 1c | ||
| CAC=0 | 1.0 (ref) | 1.0 (ref) |
| CAC 1 to 100 | 1.91 (1.05, 3.47)d | 2.56 (1.31, 5.00)d |
| CAC >100 | 4.41 (2.49, 7.82)d | 3.06 (1.53, 6.12)d |
| Age, y | 1.01 (0.93, 1.10) | 1.08 (0.97, 1.19) |
| Prior CVD (yes vs no) | n/a | 2.43 (1.26, 4.70)d |
| Model 2c | ||
| CAC=0 | 1.0 (ref) | 1.0 (ref) |
| CAC 1 to 100 (ref=0) | 1.65 (0.83, 3.28) | 1.97 (0.93, 4.18) |
| CAC >100 (ref=0) | 4.06 (2.11, 7.80)d | 2.70 (1.26, 5.79)d |
| Age, y | 1.02 (0.92, 1.12) | 1.11 (0.99, 1.25) |
| Diabetes mellitus (yes vs no) | 1.72 (0.72, 4.12) | 0.65 (0.20, 2.15) |
| Current smoking (yes vs no) | 1.09 (0.51, 2.34) | 1.81 (0.89, 3.69) |
| Hypertension | 1.22 (0.70, 2.15) | 1.70 (0.92, 3.15) |
| High cholesterol (yes vs no) | 1.63 (0.79, 3.36) | 2.61 (1.34, 5.06)d |
| Prior CVD (yes vs no) | n/a | 1.54 (0.69, 3.41) |
| Model 3c | ||
| CAC=0 | 1.0 (ref) | 1.0 (ref) |
| CAC 1 to 100 (ref=0) | 1.56 (0.78, 3.12) | 1.90 (0.90, 4.07) |
| CAC >100 (ref=0) | 3.98 (2.07, 7.67)d | 2.66 (1.24, 5.74)d |
| Age, y | 1.02 (0.92, 1.12) | 1.12 (1.00, 1.26) |
| Diabetes mellitus (yes vs no) | 1.55 (0.64, 3.75) | 0.64 (0.19, 2.13) |
| Current smoking (yes vs no) | 1.13 (0.53, 2.42) | 1.90 (0.92, 3.93) |
| Hypertension | 1.16 (0.65, 2.06) | 1.55 (0.82, 2.96) |
| High cholesterol (yes vs no) | 1.68 (0.81, 3.47) | 2.62 (1.35, 5.09)d |
| BMI <25 | 1.0 (ref) | 1.0 (ref) |
| BMI 25 to 29.9 | 1.47 (0.57, 3.75) | 0.81 (0.33, 1.95) |
| BMI 30 to 34.9 | 2.01 (0.79, 5.13) | 0.62 (0.23, 1.63) |
| BMI ≥35 | 1.48 (0.55, 4.00) | 1.32 (0.53, 3.26) |
| Prior CVD (yes vs no) | n/a | 1.67 (0.75, 3.72) |
BMI indicates body mass index; CAC, coronary artery calcium; CEE, conjugated equine estrogen; CI, confidence interval; CVD, cardiovascular disease; HR, hazard ratio; n/a, not applicable.
Excludes women with CVD at baseline or before CAC scan, or no follow‐up, n=931.
Excludes with no follow‐up, n=1020.
Each model is adjusted for CEE vs placebo (not shown) as well as the predictors reported for that model.
Statistically significant results.
Finally, for total mortality (Table 5), HR (95% CI) were 3.06 (1.53, 6.12) for CAC>100 and 2.56 (1.35, 5.16) for CAC 1 to 100 (ref=CAC=0), adjusted for prior CVD (HR: 2.43, 95% CI, 1.26, 4.70), age and randomization to CEE‐Alone versus placebo (Model 1). CAC>100 (versus 0) remained significantly associated with total mortality when further adjusted for diabetes mellitus, smoking, hypertension, high cholesterol, and prior CVD (Model 2), or additionally for BMI categories (Model 3). However, in Models 2 and 3, high cholesterol was the only covariate that remained significantly associated with total mortality. If restricted to women without CVD before the scan, results were similar except for a stronger association of smoking (HR: 2.24, 95% CI, 1.05, 4.79) with total mortality (not shown).
Sensitivity Analyses
We evaluated effects of recategorizing current smoking (yes/no) to examine high levels of current smoking exposure (ie, 1 to 14 cigarettes/d [n=58] and >15 cigarettes/d [n=48]). Age‐adjusted CVD rates for current smoking: no (never and former smokers, 9.28/1000 PYs) and for yes (1–14 cigarettes/d, 7.23/1000 PY) were similar to those in Table 3 for never smokers (9.93/1000 PYs) and were also approximately twice as high as for CAC=0 (5.56/1000 PYs). However, for current smokers with 15 or more cigarettes/d, the age‐adjusted CVD rate was 23.78/1000 PY, which was higher than CAC categories except for CAC>400 (47.21/1000 PYs), and had an age‐adjusted HR (95% CI)=2.35 (1.07, 5.15). We also reran multivariable models using this smoking categorization, and also replacing hypertension (yes/no) with systolic blood pressure categories (<118, 118–130, and >130 mm Hg, Table S3). The multivariable‐adjusted HRs for CAC>100 in Models 2 and 3 are almost identical to those in our primary multivariable models (Table 5). However, for current smokers of 15+ cigarettes per day, adjusting for CAC and other risk factors has little effect on HRs (2.35 to 2.27 or 2.32), although they miss statistical significance.
Finally, we also performed sensitivity analyses including the entire WHI‐CACS with no exclusions, and including as incident event those that occurred between WHI baseline and CT scan, as well as from scan to end of follow‐up. The results were very similar to our primary results (Table S4). For example, for both MI and for CVD, rates were higher with higher CAC category but similar for women previously randomized to CEE‐alone compared with placebo. As in the primary results, age‐adjusted stroke rates were only minimally higher for CAC>100 versus 0 (2.85 versus 1.43 per 1000 PYs), although similar for CEE‐alone versus placebo (Table S4).
Discussion
This long‐term follow‐up of the WHI‐CACS is the only study relating CAC to subsequent risk of CHD, CVD, and death among a subset of prior participants in a randomized clinical trial of estrogen alone versus placebo. The WHI‐CACS has previously reported that among these women aged 50 to 59 years at baseline, randomization to CEE‐alone versus placebo was associated with lower CAC scores measured ≈8.7 years later, at mean age 64.4 years, independent of baseline CVD risk factors.5 The current report shows that among these relatively young postmenopausal women, age‐adjusted rates of CHD, CVD, and mortality were very low among the 54% with CAC=0, and >2‐fold higher for those with any CAC. CAC>100 (versus 0) was associated with CHD (HR=7.88), CVD (HR=4.06), and total mortality (HR=2.70), adjusted for prior randomization to CEE‐alone versus placebo and baseline CVD risk factors. Furthermore, associations of CAC with post‐trial CVD outcomes and mortality were not modified by prior randomization to CEE‐alone versus placebo, and associations of baseline CVD risk factors with incident CVD and total mortality were attenuated when adjusted for CAC.
Our study results must be interpreted within the context of this unique study. Previous reports showed that among women aged 50 to 59 years at baseline in the overall WHI E‐Alone trial, randomization to E‐Alone versus placebo was associated with lower risk of MI, CHD, and mortality during the trial and in long‐term follow‐up.3 Among women aged 50 to 59 years at baseline in the WHI E‐Alone Trial, the WHI‐CACS showed that randomization to E‐Alone versus placebo resulted in lower odds of CAC measured ≈8.7 years after baseline, independent of CVD risk factors also associated with subsequent CAC.5 The long incubation period for CAC has been demonstrated by longitudinal studies, showing stronger associations with risk factors measured 11 to 20 years before CAC scan than to concurrently measured risk factors.11, 12, 13 As hypothesized, the association of higher CAC with subsequent CVD events and mortality was not modified by prior randomization to E‐Alone versus placebo and not attenuated by randomized treatment or baseline CVD risk factors. Furthermore, associations of baseline CVD risk factors with post‐trial events and mortality were attenuated in multivariable‐adjusted models including CAC.
In this study of postmenopausal women, CVD risk was especially high for the 5% of women with CAC >400; these women accounted for 35% of CHD events and 61% of CVD events, and they had age‐adjusted rates/1000 PY of 16.74 (CHD), 47.21 (CVD), and 19.11 (total mortality). However, women with CAC=0 (more than half the cohort) had very low age‐adjusted rates of CHD, CVD, and mortality over ≈8 years of follow‐up, lower than for absence of most other baseline risk factors. This agrees with a prior report of low mortality rates for older adults with CAC=0, even for those aged ≥75 years.14 Compared with the >50% of women with CAC=0, rates were doubled for women with any CAC, starting at CAC 11 to 100 for CVD and CAC 1 to 10 for mortality. In absolute risk, the age‐adjusted CVD rate/1000 PYs for CAC 11 to 100 (11.38) is similar to family history of MI in first‐degree relatives (12.82) and is intermediate between former smokers (8.50) and current smokers (13.74). Our results agree with prior reports showing that presence of any CAC (>0) is associated with increased CVD and mortality among women with a broader age range,14, 15 as well younger adults over 10 to 15 years of follow‐up.16 Among younger adults in the CARDIA (Coronary Artery Risk Development in Young Adults) study, CVD risk was higher with any CAC starting as low as CAC=1 to 19.16
Interestingly, total mortality was positively related to the extent of CAC, and to high cholesterol, despite the very few deaths caused by CVD. High cholesterol was associated with total mortality before and after adjustment for CAC, even when women with CVD before scan were excluded. However, since high cholesterol was defined based on self‐report of prior diagnosis or treatment, it may be a marker for poorer health (ie, women who are in the healthcare system for other reasons). Measured lipid levels, if available, might have had stronger or weaker associations with outcomes. The association of CAC with total mortality persisted even if excluding CVD before the scans or current smokers at baseline. The MESA (Multi‐Ethnic Study of Atherosclerosis) study has also reported an association of higher CAC with higher noncardiovascular morbidity and mortality.17 The association of CAC with higher non‐CVD mortality suggests that CAC represents not only the cumulative exposure to CVD risk factors but also other aspects of the aging process that may contribute both to high CAC scores and morbidity and mortality from other causes.18, 19 Furthermore, a high CAC score indicates a systemic burden of subclinical cardiovascular disease that may increase the likelihood of death following diagnosis or treatment for noncardiovascular diseases. Additional studies are needed to identify potential nonatherosclerotic factors that contribute to differences in CAC between populations, and to the association between CAC and non‐CVD morbidity and mortality.
The results of this study must be carefully interpreted in light of study strengths and limitations. As noted, this is the only follow‐up of CAC for events nested within a randomized trial of CEE‐Alone versus placebo. However, the WHI E‐Alone Trial included only hysterectomized women, and the WHI‐CACS included only a subset of former WHI E‐Alone trial participants. This study assesses only postscan events, occurring ≈1.3 to 9 years after intervention had stopped. Furthermore, for CHD and CVD analyses, the current report excludes women with CVD before scan, which excludes those with events between baseline and scan (ie, during the intervention). The power to evaluate associations with incident events, especially when stratified by prior randomization to CEE‐Alone versus placebo, is limited by the low rates of CHD, CVD, and CVD mortality. These low event rates are related to the very low prevalence of CAC (ie, 54% of the women had CAC=0 and 62% had CAC <10), consistent with other studies showing much lower prevalence of coronary calcification in women than men, and very low incidence of CHD and CVD in both men and women with low CAC scores.7, 20 Finally, while presence and severity of CAC is strongly associated with the overall atherosclerotic plaque burden, it does not quantify noncalcified plaque, and may also represent inflammation or other determinants of tissue calcification.21, 22, 23 In spite of this, our results agree with other studies that have shown that for both men and women, CAC=0 is associated with extremely low risk of CHD over the next 10 to 15 years, and there is a consistent linear relationship between the amount of CAC and the risk of CHD and CVD.16 Additional studies of lower risk populations are needed to validate our findings that CHD and CVD risk are higher with any versus no CAC, even among those with low CAC scores.
In this study, as in the total WHI follow‐up study1, 3 the most common CVD event was coronary revascularization, which may have introduced bias if high CAC scores prompted revascularization among some asymptomatic women. However, the majority of first event revascularizations occurred more than 2 years after cardiac CT scan, and associations with CAC were similar when revascularizations within 2 years of scan were excluded. Also, since WHI did not include nonhospitalized angina pectoris as a primary end point, some women with revascularization as their first event likely had angina symptoms before revascularization. Finally, associations of CAC with CVD were very similar to associations with CHD (MI and CHD death), supporting the conclusion that the association of CAC with CVD in this study is not biased by the possibility of revascularizations prompted by knowledge of high CAC scores.
In conclusion, among postmenopausal women, those with any CAC (>0) have a higher risk of CVD and mortality compared with women with no CAC. Associations were minimally attenuated when adjusted for baseline CVD risk factors previously shown to predict CAC in this study cohort. Although prior randomized treatment was significantly associated with CAC levels measured ≈8.7 years after baseline, prior randomization did not modify associations of CAC with outcomes. This agrees with the proposition that CAC is the result of cumulative prior exposures including measured and unmeasured risk factors, host susceptibility, and duration of exposures, and therefore outperforms single risk factor measurements. Only 19.3% of women had high CAC (>100), but they were at significantly higher risk for CVD outcomes and mortality. At the other extreme, the 50% of women with zero CAC have very low risk of CVD. However, over time, some of the postmenopausal women with CAC=0 will develop calcification, as previously shown among healthy postmenopausal women.24 These results suggest that prevention of CAC among young and midlife women may delay morbidity and mortality among postmenopausal women. Whether CAC screening should be recommended for postmenopausal women to identify both very high risk and very low risk women remains an important unanswered question of considerable public health relevance in an aging population.
Appendix
The Women's Health Initiative Coronary‐Artery Calcium Study Investigators are as follows: Program Office, National Heart, Lung, and Blood Institute, Bethesda, MD: J.E. Rossouw, S. Ludlam; Clinical Coordinating Center, Fred Hutchinson Cancer Research Center, Seattle: B.B. Cochrane, J.R. Hunt, B. Lund, R. Prentice; Computed Tomography Reading Center, Wake Forest University, Winston‐Salem, NC: J.J. Carr, C. O'Rourke, L. Du, S. Pillsbury, C. Hightower, R. Ellison, J. Tan; Clinical Centers: Albert Einstein College of Medicine, Bronx, NY—S. Wassertheil‐Smoller, M. Magnani, D.H. Noble, T. Dellicarpini; Brigham and Women's Hospital, Harvard Medical School, Boston—J.E. Manson, M. Bueche, A.D. McGinnis, F.J. Rybicki; Brown University, Providence, RI—A.R. Assaf, G. Sloane; Emory University, Atlanta—L.S. Phillips, V. Butler, M. Huber, J. Vitali; George Washington University Medical Center, Washington, DC—J. Hsia, C. LeBrun, R. Palm, D. Embersit; Kaiser Permanente Center for Health Research, Portland, OR—E. Whitlock, K. Arnold; Kaiser Permanente Division of Research, Oakland, CA—S. Sidney, V. Cantrell; Medical College of Wisconsin, Milwaukee—J.M. Kotchen, C. Feltz; MedStar Research Institute–Howard University, Washington, DC—B.V. Howard, A. Thomas‐Geevarghese, G. Boggs, J.S. Jelinick; Northwestern University, Chicago and Evanston, IL—P. Greenland, A. Neuman, G. Carlson‐Lund, S.M. Giovanazzi; Stanford Prevention Research Center, Stanford, CA—M.L. Stefanick, S. Swope; Ohio State University, Columbus—R. Jackson, K. Toussant; University of Alabama at Birmingham, Birmingham—C.E. Lewis, P. Pierce, C. Stallings; University at Buffalo, Buffalo, NY—J. Wactawski‐Wende, S. Goel, R. Laughlin; University of California at Davis, Sacramento—J. Robbins, S. Zaragoza, D. Macias, D. Belisle; University of California at Los Angeles, Los Angeles—L. Nathan, B. Voigt, J. Goldin, M. Woo; University of California at San Diego, LaJolla and Chula Vista—R.D. Langer, M.A. Allison, X. Lien, C.M. Wright; University of Cincinnati, Cincinnati—M. Gass, S. Sheridan; University of Iowa, Iowa City and Davenport—J.G. Robinson, D. Feddersen, K. Kelly‐Brake, J. Carroll; University of Massachusetts–Fallon Clinic, Worcester—J. Ockene, L. Churchill; University of Medicine and Dentistry of New Jersey, Newark—N.L. Lasser, B. Miller, P.D. Maldjian, J. Pierre‐Louis; University of Miami, Miami—J. Fishman, M.J. O'Sullivan, D. Fernandez; University of Minnesota, Minneapolis—K.L. Margolis, C.L. Bjerk, C. Truwit, J.A. Hearity; University of North Carolina, Chapel Hill—W.B. Hyslop, K. Darroch, C. Murphy, G. Heiss; University of Pittsburgh, Pittsburgh—L.H. Kuller, D. Edmundowicz, D. Ives; University of Tennessee, Memphis—K.C. Johnson, S. Satterfield, S.A. Connelly, E.L. Jones; University of Texas Health Science Center, San Antonio—R. Brzyski, M.A. Nashawati, S. Torchia, A. Rodriguez, R. Garza, P. Nentwich; University of Wisconsin, Madison—G.E. Sarto, L. Broderick, N.K. Sweitzer.
Short list of WHI Investigators: Program Office: (National Heart, Lung, and Blood Institute, Bethesda, MD) Jacques Rossouw, Shari Ludlam, Joan McGowan, Leslie Ford, and Nancy Geller, Clinical Coordinating Center: (Fred Hutchinson Cancer Research Center, Seattle, WA) Garnet Anderson, Ross Prentice, Andrea LaCroix, and Charles Kooperberg Investigators and Academic Centers: (Brigham and Women's Hospital, Harvard Medical School, Boston, MA) JoAnn E. Manson; (MedStar Health Research Institute/Howard University, Washington, DC) Barbara V. Howard; (Stanford Prevention Research Center, Stanford, CA) Marcia L. Stefanick; (The Ohio State University, Columbus, OH) Rebecca Jackson; (University of Arizona, Tucson/Phoenix, AZ) Cynthia A. Thomson; (University at Buffalo, Buffalo, NY) Jean Wactawski‐Wende; (University of Florida, Gainesville/Jacksonville, FL) Marian Limacher; (University of Iowa, Iowa City/Davenport, IA) Jennifer Robinson; (University of Pittsburgh, Pittsburgh, PA) Lewis Kuller; (Wake Forest University School of Medicine, Winston‐Salem, NC) Sally Shumaker; (University of Nevada, Reno, NV) Robert Brunner; (University of Minnesota, Minneapolis, MN) Karen L. Margolis Women's Health Initiative Memory Study: (Wake Forest University School of Medicine, Winston‐Salem, NC) Mark Espeland. For a list of all the investigators who have contributed to WHI science, please visit: https://www.whi.org/researchers/Documents%20%20Write%20a%20Paper/WHI%20Investigator%20Long%20List.pdf
Sources of Funding
The WHI programs are funded by the National Heart, Lung, and Blood Institute, National Institutes of Health, US Department of Health and Human Services through contracts HHSN268201600018C, HHSN268201600001C, HHSN268201600002C, HHSN268201600003C, and HHSN268201600004C.
Disclosures
None.
Supporting information
Table S1. Participant Characteristics, Overall,* and for CEE‐Alone Vs Placebo
Table S2. Multivariable‐Adjusted HR (95% CI) for CHD by CAC Categories
Table S3. Multivariable‐Adjusted HR (95% CI) for CVD* With Recategorized Current Smoking and Systolic Blood Pressure
Table S4. All Incident CVD Outcomes from WHI Baseline by CAC Categories for E‐Alone, Placebo, and Total (Combined), n=1074*
(J Am Heart Assoc. 2017;6:e006887 DOI: 10.1161/JAHA.117.006887.)29079563
Contributor Information
Lewis H. Kuller, Email: kullerl@edc.pitt.edu.
the WHI and WHI‐CAC Study Investigators:
J.E. Rossouw, S. Ludlam, B.B. Cochrane, J.R. Hunt, B. Lund, R. Prentice, C. O'Rourke, L. Du, S. Pillsbury, C. Hightower, R. Ellison, J. Tan, S. Wassertheil‐Smoller, M. Magnani, D.H. Noble, T. Dellicarpini, M. Bueche, A.D. McGinnis, F.J. Rybicki, A.R. Assaf, G. Sloane, L.S. Phillips, V. Butler, M. Huber, J. Vitali, J. Hsia, C. LeBrun, R. Palm, D. Embersit, E. Whitlock, K. Arnold, S. Sidney, V. Cantrell, J.M. Kotchen, C. Feltz, B.V. Howard, A. Thomas‐Geevarghese, G. Boggs, J.S. Jelinick, P. Greenland, A. Neuman, G. Carlson‐Lund, S.M. Giovanazzi, M.L. Stefanick, S. Swope, R. Jackson, K. Toussant, C.E. Lewis, P. Pierce, C. Stallings, J. Wactawski‐Wende, S. Goel, R. Laughlin, J. Robbins, S. Zaragoza, D. Macias, D. Belisle, L. Nathan, B. Voigt, J. Goldin, M. Woo, R.D. Langer, X. Lien, C.M. Wright, M. Gass, S. Sheridan, J.G. Robinson, D. Feddersen, K. Kelly‐Brake, J. Carroll, J. Ockene, L. Churchill, N.L. Lasser, B. Miller, P.D. Maldjian, J. Pierre‐Louis, J. Fishman, M.J. O'Sullivan, D. Fernandez, K.L. Margolis, C.L. Bjerk, C. Truwit, J.A. Hearity, W.B. Hyslop, K. Darroch, C. Murphy, G. Heiss, D. Edmundowicz, D. Ives, K.C. Johnson, S. Satterfield, S.A. Connelly, E.L. Jones, R. Brzyski, M.A. Nashawati, S. Torchia, A. Rodriguez, R. Garza, P. Nentwich, G.E. Sarto, L. Broderick, N.K. Sweitzer, Jacques Rossouw, Shari Ludlam, Joan McGowan, Leslie Ford, Nancy Geller, Garnet Anderson, Ross Prentice, Andrea LaCroix, JoAnn E. Manson, Barbara V. Howard, Rebecca Jackson, Cynthia A. Thomson, Jean Wactawski‐Wende, Marian Limacher, Jennifer Robinson, Lewis Kuller, Sally Shumaker, and Robert Brunner
References
- 1. Anderson GL, Limacher M, Assaf AR, Bassford T, Beresford SA, Black H, Bonds D, Brunner R, Brzyski R, Caan B, Chlebowski R, Curb D, Gass M, Hays J, Heiss G, Hendrix S, Howard BV, Hsia J, Hubbell A, Jackson R, Johnson KC, Judd H, Kotchen JM, Kuller L, LaCroix AZ, Lane D, Langer RD, Lasser N, Lewis CE, Manson J, Margolis K, Ockene J, O'Sullivan MJ, Phillips L, Prentice RL, Ritenbaugh C, Robbins J, Rossouw JE, Sarto G, Stefanick ML, Van Horn L, Wactawski‐Wende J, Wallace R, Wassertheil‐Smoller S; Women's Health Initiative Steering C . Effects of conjugated equine estrogen in postmenopausal women with hysterectomy: the women's health initiative randomized controlled trial. JAMA. 2004;291:1701–1712. [DOI] [PubMed] [Google Scholar]
- 2. Hsia J, Langer RD, Manson JE, Kuller L, Johnson KC, Hendrix SL, Pettinger M, Heckbert SR, Greep N, Crawford S, Eaton CB, Kostis JB, Caralis P, Prentice R; Women's Health Initiative I . Conjugated equine estrogens and coronary heart disease: the women's health initiative. Arch Intern Med. 2006;166:357–365. [DOI] [PubMed] [Google Scholar]
- 3. Manson JE, Chlebowski RT, Stefanick ML, Aragaki AK, Rossouw JE, Prentice RL, Anderson G, Howard BV, Thomson CA, LaCroix AZ, Wactawski‐Wende J, Jackson RD, Limacher M, Margolis KL, Wassertheil‐Smoller S, Beresford SA, Cauley JA, Eaton CB, Gass M, Hsia J, Johnson KC, Kooperberg C, Kuller LH, Lewis CE, Liu S, Martin LW, Ockene JK, O'Sullivan MJ, Powell LH, Simon MS, Van Horn L, Vitolins MZ, Wallace RB. Menopausal hormone therapy and health outcomes during the intervention and extended poststopping phases of the women's health initiative randomized trials. JAMA. 2013;310:1353–1368. [DOI] [PMC free article] [PubMed] [Google Scholar]
- 4. LaCroix AZ, Chlebowski RT, Manson JE, Aragaki AK, Johnson KC, Martin L, Margolis KL, Stefanick ML, Brzyski R, Curb JD, Howard BV, Lewis CE, Wactawski‐Wende J; Investigators WHI . Health outcomes after stopping conjugated equine estrogens among postmenopausal women with prior hysterectomy: a randomized controlled trial. JAMA. 2011;305:1305–1314. [DOI] [PMC free article] [PubMed] [Google Scholar]
- 5. Manson JE, Allison MA, Rossouw JE, Carr JJ, Langer RD, Hsia J, Kuller LH, Cochrane BB, Hunt JR, Ludlam SE, Pettinger MB, Gass M, Margolis KL, Nathan L, Ockene JK, Prentice RL, Robbins J, Stefanick ML; WHI, Investigators W‐C . Estrogen therapy and coronary‐artery calcification. N Engl J Med. 2007;356:2591–2602. [DOI] [PubMed] [Google Scholar]
- 6. Anderson GL, Manson J, Wallace R, Lund B, Hall D, Davis S, Shumaker S, Wang CY, Stein E, Prentice RL. Implementation of the women's health initiative study design. Ann Epidemiol. 2003;13:S5–17. [DOI] [PubMed] [Google Scholar]
- 7. Kuller LH, Edmundowicz D. Imaging of coronary arteries aid in prevention of atherosclerosis and clinical coronary heart disease. Open Epidemiol J. 2011;4:152–164. [Google Scholar]
- 8. Carr JJ, Nelson JC, Wong ND, McNitt‐Gray M, Arad Y, Jacobs DR Jr, Sidney S, Bild DE, Williams OD, Detrano RC. Calcified coronary artery plaque measurement with cardiac CT in population‐based studies: standardized protocol of Multi‐Ethnic Study of atherosclerosis (MESA) and Coronary Artery Risk Development in Young Adults (CARDIA) study. Radiology. 2005;234:35–43. [DOI] [PubMed] [Google Scholar]
- 9. Detrano RC, Anderson M, Nelson J, Wong ND, Carr JJ, McNitt‐Gray M, Bild DE. Coronary calcium measurements: effect of CT scanner type and calcium measure on rescan reproducibility—MESA study. Radiology. 2005;236:477–484. [DOI] [PubMed] [Google Scholar]
- 10. Curb JD, McTiernan A, Heckbert SR, Kooperberg C, Stanford J, Nevitt M, Johnson KC, Proulx‐Burns L, Pastore L, Criqui M, Daugherty S, Morbidity WHI, Mortality C. Outcomes ascertainment and adjudication methods in the women's health initiative. Ann Epidemiol. 2003;13:S122–128. [DOI] [PubMed] [Google Scholar]
- 11. Kuller LH, Matthews KA, Sutton‐Tyrrell K, Edmundowicz D, Bunker CH. Coronary and aortic calcification among women 8 years after menopause and their premenopausal risk factors: the healthy women study. Arterioscler Thromb Vasc Biol. 1999;19:2189–2198. [DOI] [PubMed] [Google Scholar]
- 12. Matthews KA, Kuller LH, Chang Y, Edmundowicz D. Premenopausal risk factors for coronary and aortic calcification: a 20‐year follow‐up in the healthy women study. Prev Med. 2007;45:302–308. [DOI] [PMC free article] [PubMed] [Google Scholar]
- 13. Loria CM, Liu K, Lewis CE, Hulley SB, Sidney S, Schreiner PJ, Williams OD, Bild DE, Detrano R. Early adult risk factor levels and subsequent coronary artery calcification: the CARDIA Study. J Am Coll Cardiol. 2007;49:2013–2020. [DOI] [PubMed] [Google Scholar]
- 14. Kavousi M, Desai CS, Ayers C, Blumenthal RS, Budoff MJ, Mahabadi AA, Ikram MA, van der Lugt A, Hofman A, Erbel R, Khera A, Geisel MH, Jockel KH, Lehmann N, Hoffmann U, O'Donnell CJ, Massaro JM, Liu K, Mohlenkamp S, Ning H, Franco OH, Greenland P. Prevalence and prognostic implications of coronary artery calcification in low‐risk women: a meta‐analysis. JAMA. 2016;316:2126–2134. [DOI] [PubMed] [Google Scholar]
- 15. Lakoski SG, Greenland P, Wong ND, Schreiner PJ, Herrington DM, Kronmal RA, Liu K, Blumenthal RS. Coronary artery calcium scores and risk for cardiovascular events in women classified as “low risk” based on framingham risk score: the multi‐ethnic study of atherosclerosis (MESA). Arch Intern Med. 2007;167:2437–2442. [DOI] [PubMed] [Google Scholar]
- 16. Carr JJ, Jacobs DR Jr, Terry JG, Shay CM, Sidney S, Liu K, Schreiner PJ, Lewis CE, Shikany JM, Reis JP, Goff DC Jr. Association of coronary artery calcium in adults aged 32 to 46 years with incident coronary heart disease and death. JAMA Cardiol. 2017;2:391–399. [DOI] [PMC free article] [PubMed] [Google Scholar]
- 17. Handy CE, Desai CS, Dardari ZA, Al‐Mallah MH, Miedema MD, Ouyang P, Budoff MJ, Blumenthal RS, Nasir K, Blaha MJ. The association of coronary artery calcium with noncardiovascular disease: the multi‐ethnic study of atherosclerosis. JACC Cardiovasc Imaging. 2016;9:568–576. [DOI] [PMC free article] [PubMed] [Google Scholar]
- 18. Mieres JH, Gulati M, Bairey Merz N, Berman DS, Gerber TC, Hayes SN, Kramer CM, Min JK, Newby LK, Nixon JV, Srichai MB, Pellikka PA, Redberg RF, Wenger NK, Shaw LJ; American Heart Association Cardiac Imaging Committee of the Council on Clinical C, Cardiovascular I, Intervention Committee of the Council on Cardiovascular R, Intervention . Role of noninvasive testing in the clinical evaluation of women with suspected ischemic heart disease: a consensus statement from the American Heart Association. Circulation. 2014;130:350–379. [DOI] [PubMed] [Google Scholar]
- 19. Grines CL, Skelding KA. Women and calcium: a love‐hate relationship at the center of the heart. JACC Cardiovasc Interv. 2016;9:1902–1904. [DOI] [PubMed] [Google Scholar]
- 20. Woodard GA, Narla VV, Ye R, Cauley JA, Thompson T, Matthews KA, Sutton‐Tyrrell K. Racial differences in the association between carotid plaque and aortic and coronary artery calcification among women transitioning through menopause. Menopause. 2012;19:157–163. [DOI] [PMC free article] [PubMed] [Google Scholar]
- 21. Poornima IG, Mackey RH, Buhari AM, Cauley JA, Matthews KA, Kuller LH. Relationship between circulating serum osteoprotegerin and total receptor activator of nuclear kappa‐B ligand levels, triglycerides, and coronary calcification in postmenopausal women. Menopause. 2014;21:702–710. [DOI] [PubMed] [Google Scholar]
- 22. Farhat GN, Cauley JA, Matthews KA, Newman AB, Johnston J, Mackey R, Edmundowicz D, Sutton‐Tyrrell K. Volumetric BMD and vascular calcification in middle‐aged women: the Study of Women's Health Across the Nation. J Bone Miner Res. 2006;21:1839–1846. [DOI] [PubMed] [Google Scholar]
- 23. Nakahara T, Dweck MR, Narula N, Pisapia D, Narula J, Strauss HW. Coronary artery calcification: from mechanism to molecular imaging. JACC Cardiovasc Imaging. 2017;10:582–593. [DOI] [PubMed] [Google Scholar]
- 24. Kuller LH, Matthews KA, Edmundowicz D, Chang Y. Incident coronary artery calcium among postmenopausal women. Atherosclerosis. 2008;200:278–285. [DOI] [PMC free article] [PubMed] [Google Scholar]
Associated Data
This section collects any data citations, data availability statements, or supplementary materials included in this article.
Supplementary Materials
Table S1. Participant Characteristics, Overall,* and for CEE‐Alone Vs Placebo
Table S2. Multivariable‐Adjusted HR (95% CI) for CHD by CAC Categories
Table S3. Multivariable‐Adjusted HR (95% CI) for CVD* With Recategorized Current Smoking and Systolic Blood Pressure
Table S4. All Incident CVD Outcomes from WHI Baseline by CAC Categories for E‐Alone, Placebo, and Total (Combined), n=1074*