

Abstract
Background
Accumulating evidence indicates that reducing systolic blood pressure (BP) to <140 mm Hg improves health outcomes; however, an optimal level has not yet been determined. Many population studies or post hoc analyses suggest a target systolic BP between 120 and 140 mm Hg with increased risk above and below that range. We tested the hypothesis that consistent control of systolic BP between 120 and 140 mm Hg—time in therapeutic range—is a strong determinant of all‐cause mortality among US veterans.
Methods and Results
A total of 689 051 individuals from 15 Veterans Administration Medical Centers were followed over a 10‐year period. Participants were classified as hypertensive, intermediate hypertensive, and normotensive according to the number of elevated BP recordings (>3, 1 or 2, and none, respectively). Time within, above, or below therapeutic range (120–140 mm Hg) was considered in quartiles and related to all‐cause mortality. The study population consisted of 54% hypertensive, 19.9% intermediate, and 26.1% normotensive participants; the corresponding mortality rates for the 3 groups were 11.5%, 8%, and 1.9%, respectively (P<0.0001 for all comparisons). Mortality rates for hypertensive participants with BP consistently within, above, or below the therapeutic range were 6.5%, 21.9%, and 33.1%, respectively (P<0.0001 for all comparisons). Mortality rates in hypertensive participants increased from 6.5% in the most consistently controlled quartile (>75%) to 8.9%, 15.6%, and 23.5% towards the less consistently controlled quartiles (50–75%, 25–50%, and <25%, respectively; P<0.0001 for all comparisons).
Conclusions
An inverse and gradual association between time in therapeutic range and all‐cause mortality was observed in this large veteran cohort. Consistency of BP control over time is a strong determinant of all‐cause mortality, and consistency of BP control should be monitored in everyday clinical practice.
Keywords: hypertension, mortality, variation
Subject Categories: Hypertension, High Blood Pressure
Clinical Perspective
What Is New?
We propose time in therapeutic range as a novel measure of arterial hypertension management and provide verification of its significance in a large cohort of US veterans.
Patients with systolic blood pressure levels within the therapeutic range (120–140 mm Hg) had significantly lower mortality rates than patients with blood pressure levels above or below this range, while the time in therapeutic range was a strong survival predictor: patients with consistent (>50%) compared with patients with inconsistent (<50%) blood pressure values within this range had 2‐ to 3‐fold lower mortality rates.
What Are the Clinical Implications?
The substantial survival benefits of consistent blood pressure control over time draw attention to the long‐term follow‐up of patients with arterial hypertension: physicians managing patients with arterial hypertension (cardiologists, nephrologists, internists, primary care) should aim not only to lower blood pressure levels but also to make every possible effort to maintain blood pressure within the therapeutic range of 120 and 140 mm Hg most of the time during the lifelong follow‐up of the patients, since blood pressure levels above or below this range or inconsistent blood pressure control are associated with significantly increased mortality rates.
Introduction
Elevated blood pressure (BP) is a strong predictor of cardiovascular risk and all‐cause mortality. Since the early landmark Veterans Administration (VA) studies demonstrated impressive benefits from BP treatment and control,1, 2 numerous randomized, prospectively controlled or comparative trials, which included hundreds of thousands of patients, demonstrated the benefits of treating hypertension.3, 4, 5 The original VA studies targeted control of diastolic BP and actually demonstrated benefit down to 100 mm Hg, or a systolic BP between 140 and 150 mm Hg. Many other studies confirmed these results, but later trials in isolated systolic hypertension patients (Systolic Hypertension in the Elderly Program) suggested that systolic BP is probably a better target for treatment, particularly among middle aged or older individuals.6 A limited number of studies addressed different levels of diastolic BP to assess effects on outcomes (Hypertension Optimal Treatment study), but results were inconclusive because of small deltas in achieved BPs.7 Recent meta‐analyses suggested that there may be benefit from reducing systolic BP between 130 and 140 mm Hg,8 but others maintain that data are scarce in patients over the age of 60 years,9 and guidelines even recently allow systolic BPs up to 150 mm Hg in patients over the age of 60 years.9, 10 Yet the recently published Systolic Pressure Intervention Trial demonstrated beyond convincingly that reducing systolic BP to the low 120s is much better than keeping it to the mid‐130s.11 The study has been criticized, however, that it used very stringent BP measurement methods, which are not applicable to clinical practice.12, 13 The fact is that existing data suggest that the optimal BP reduction is somewhere between 120 and 140 mm Hg systolic and the method of measurement may have an influence on that optimal level.
It is clear that BP is not a stable measure, but rather it is dynamic and can vary from minute to minute, day to day, and from visit to visit even without drug regimen modification. Blood pressure variability has been suggested as an independent predictor of cardiovascular risk. So it seems more practical and clinically relevant to define a therapeutic range instead of a certain threshold as a target of therapy.
We therefore hypothesized that a therapeutic range between 120 and 140 mm Hg for SBP defines the optimal therapeutic range for treatment and control of hypertension.
We introduced the term “time in therapeutic range” that incorporates both the average BP value prevailing during long‐term follow‐up and the degree of BP variability.
We hypothesized that patients with persistent BP within the therapeutic range over time (75–100% of available BP measurements) will have better outcomes than patients with transient BP control or just the last BP within the therapeutic range.
Patients and Methods
For the purpose of this study, we used longitudinal data obtained from the US Veterans Affairs electronic medical records. Acquisition, storage, and analysis of the data have been previously described.14 In brief, the Department of Veterans Affairs first deployed electronic data in 1982 as the Decentralized Hospital Computer Program. The Computerized Patient Record System was implemented systemwide in 1997. The system stores data longitudinally, it is searchable, and allows individual medical centers to control the care of the entire patient population. A vital‐sign package that included BP, pulse rate, respirations, weight, and height was incorporated in the system in 1998 and data could be entered directly into the database at the time of each visit. The ability to assess BP control was enhanced in 2000 by combining the databases housed at individual Veterans Administration Medical Centers into a systemwide database, the Health Data Repository. In recent years the VA Informatics and Computing Infrastructure has been developed to host all data available through the corporate data warehouse. Data from all VA medical centers are available through a single server and are accessible remotely. The system has been developed to improve researchers' access to VA data. The study was approved by the institutional review board of the VA Medical Center, Washington, DC. Since this was a retrospective analysis, no informed consent was necessary.
Subjects
All patients receiving health care in 15 VA medical centers in 15 cities (Anchorage, AK; Baltimore, MD; Boston, MA; Chicago, IL; Washington, DC; Fargo, ND; Honolulu, HI; Houston, TX; Los Angeles, CA; Miami, FL; Minneapolis, MN; New York, NY; Philadelphia, PA; Portland, OR; and San Juan, PR), with BP readings in Computerized Patient Record System were included. Blood pressure readings before September 2000 were only used to identify patients with hypertension, whereas readings after September 2000 were used to assess BP level and hypertension control rates. Individual patient data files were de‐identified and downloaded for analysis on a PC running SAS (version 9.2, Cary, NC).
Blood Pressure Measurements
Blood pressure measurements were taken by trained healthcare professionals, who were instructed to follow standard procedures for BP measurement: Patients were seated in a comfortable position with the back supported, legs uncrossed, and BP taken after 3 to 5 minutes of rest. BP was taken at least twice and entered into the vital‐sign package. In some centers it was mandated that BP be rechecked by the attending physician if found elevated by the clinic nurse. Standard cuffs were used in most patients, but large cuffs were available for patients with large arm circumference. All BP readings, age, race, sex, height, and weight were recorded. Records were reviewed anonymously. An elevated BP reading was defined as a systolic BP >140 or diastolic >90. Patients were identified as hypertensive after 3 elevated BP readings were documented at 3 separate visits. Normotensive patients were defined as those patients with at least 3 days of BP readings, but no days with BP elevated. Patients with 3 or more readings, but only 1 or 2 days with elevated BPs were classified as intermediate (intermediate hypertension) and patients with fewer than 3 readings were excluded from this analysis. For patients with hypertension, the follow‐up period started after the third elevated BP was recorded. Age at entry into the data set was used (ie, on the first day with BP [for normotensives], or on the date of the third elevated reading [for patients with hypertension]).
Data Analysis
BP readings were dropped if any of the following was true: missing systolic or diastolic, systolic < diastolic, systolic >300, systolic <60, diastolic <30, or diastolic >180. For each visit, patients were considered to be normotensive if systolic <140 and diastolic <90. For patients with multiple visits in the same month, the last reading of the month was used to represent that calendar month. Months with no readings for a given patient were not imputed for that patient. The percentage of patients who were normotensive for each month was calculated, based on all patients with readings for that month. The yearly percentage of patients with normalized BP was calculated based on the last BP of each calendar year. Yearly change in percentage normotensive was calculated for the period from September 2000 to August 2012. Monthly and yearly change in average BP values for the population were also calculated based on the average BP value for each month and the last available value for each calendar year. Age was defined at the time of the first BP reading for those with normal BP and at the time of the first BP after being identified as hypertensive (ie, the first reading after the third elevated reading for patients with hypertension).
Classification Based on BP Values
Participants were classified as never‐hypertensive (normotensives) if none of the recorded BP values was >140/90 mm Hg. Participants were classified as having “intermediate hypertension” if only 1 or 2 elevated BPs were recorded. Participants were classified as hypertensive if 3 or more elevated BPs were recorded.
Blood Pressure Control and All‐Cause Mortality
All‐cause mortality was assessed for each 10‐mm Hg decrements for the 12 years of follow‐up from 2000 to 2012. The last recorded BP was considered or the last before death.
Time in Therapeutic Range
Based on early observations, we introduced the term “time in therapeutic range” (TTR), which expresses the percentage of BP measurements recorded within a certain window (TTR for BP window 120–140 mm Hg). TTR represents the average of all BP measurements recorded during the follow‐up period for each patient that fall within the window and the percentage in TTR represents the degree of BP variability for that patient. Thus, TTR reflects the prevailing BP during the follow‐up period and the magnitude of BP variability.
Statistical Analysis
Categorical data were expressed as counts and percentages and continuous data were expressed as either means and SDs or medians and interquartile ranges. Means were compared using Student t test, counts and proportions were compared using the χ2 test or the Fisher exact test, and medians were compared using the Wilcoxon rank‐sum test. Hazard ratios were calculated using Cox regression models adjusted for city location, age, sex, and race. The proportional‐hazards assumption was assessed by testing for the interaction of time with treatment group.
Multivariable modeling techniques were used in order to examine whether patient age, sex, race, city, and time in treatment had independent effects on mortality. Multiple regression (using a general linear model as implemented in the GLM procedure in SAS) was used to examine prediction models for percent of months controlled during the last calendar year available for each subject. Predictors included age group (<55, 55–75, and >75 years), sex, race, city, and number of months in the data set after being identified as hypertensive. Adjusted final percent elevated, the percent of months elevated in the final year, adjusted for the other covariates, was obtained using the ls means option in the SAS GLM procedure. In large data sets, changes over time can occur because of different patients being in the cohort at different time points. In order to determine the significance of within‐subject changes over time, fixed‐effects mixed models were used, with the SAS GLM procedures, using the “absorb” option. This type of model only examines subjects who vary on the outcome over time, using each subject as their own control. P values <0.05 were considered significant. Data analysis was performed by 1 of the authors (R.A.) using SAS (version 9.2, Cary, NC).
Results
Baseline Characteristics
The current study included 689 051 patients from 15 Veterans Affairs Medical Centers in a wide range of geographic distributions. Of those, 371 996 (54%) met the criteria of established hypertension (at least 3 elevated BPs during the follow‐up period), 137 370 (19.9%) were normotensives (had no elevated BPs, never‐hypertensive), while 179 685 (26.1%) met the criteria for intermediate hypertension (MID‐hypertension, had 1 or 2 elevated BPs). The main baseline characteristics of study participants are shown in Table 1. The age of patients with established hypertension at the time of diagnosis (third elevated BP measurement) was 62.4±13.3 years and the vast majority (95.9%) of them were male. Of the total hypertensive population, 157 522 (41.4%) patients declared ethnicity, whereas 214 474 patients (58.6%) did not. Of those who declared ethnicity, 26% were black, 22% were Hispanic, 50.3% were whites, and 1.7% Asian‐other. Similar patterns of distribution of ethnicity and nondeclared ethnicity were noted also in the other 2 groups, MID‐hypertensives and never‐hypertensives (Table 1). Patients with hypertension were older compared with participants in the intermediate and the normotensive groups. The number of BP readings was 4 times higher in patients with hypertension as compared with participants in the other 2 groups.
Table 1.
Baseline Characteristics of Study Participants
| Variable | Patient Type | Total | ||
|---|---|---|---|---|
| HTN (n=371 996) | MID (n=179 685) | NORM (n=137 370) | ||
| Race | ||||
| Black | 40 997 (26%) | 8216 (19.4%) | 4920 (19.9%) | 54 133 |
| Hispanic | 34 660 (22%) | 8556 (20.25%) | 5817 (23.5%) | 49 033 |
| White | 79 184 (50.3%) | 24 713 (58.4%) | 13 596 (54.9%) | 117 493 |
| Asian, other | 2681 (1.7%) | 813 (1.9%) | 418 (1.6%) | 3912 |
| Ethnicity not declared | 214 474 (58.6%) | 137 387 (76.5%) | 112 619 (82.2%) | 464 480 |
| Sex | ||||
| Female | 14 961 (38.3%) | 10 042 (25.7%) | 14 059 (36.0%) | 39 062 |
| Male | 357 020 (54.9%) | 169 631 (26.1%) | 123 300 (19.0%) | 649 913 |
| Age, y | 62.4±13.3 | 57.8±16.2 | 51.8±17.7 | |
| Number of BP readings | 31.9±25.9 | 8.1±6.1 | 6.6±4.8 | |
| Number of elevated BP readings | 11.1±14.2 | 1.4±0.5 | 0±0 | |
BP indicates blood pressure; HTN, hypertension; MID, intermediate; NORM, normal.
Mortality by Last Recorded BP
All‐cause mortality according to the last systolic BP reading was significantly higher in patients with established hypertension compared with patients in the intermediate and the normotensive groups. This was evident for each 10‐mm Hg increment of systolic BP between 100 and 120 mm Hg, 120 to 140 mm Hg, and >140 mm Hg (Figure 1A through 1C). The lowest mortality rate in patients with established hypertension (Figure 1A) was seen in the group of patients who achieved systolic BP between 130 and 140 mm Hg (11%), and in patients with MID‐hypertension (Figure 1B) in patients with achieved BP between 120 and 130 mm Hg systolic (7.5%). Among normotensive patients (Figure 1C), the lowest mortality rate was also seen in individuals with systolic BP between 120 and 130 mm Hg (1.5%), but differences were small above and below that range. Overall, the lowest mortality rate was noted between 130 and 140 mm Hg among patients with hypertension and between 120 and 130 mm Hg among patients with MID–hypertension or normotensive individuals (Figure S1A). When considering 20‐mm Hg increments, mortality rates based on achieved systolic BP between 120 and 140 mm Hg were 11.5%, 8%, and 1.9% among patients with hypertension, MID‐hypertensive, and normotensive, respectively (Figure S1B). Total mortality rates unveiled a U‐shaped pattern when the last systolic BP reading was taken into account. Given the uncertainty about the optimal range of achieved or last systolic BPs (130–140 mm Hg in hypertensives, but 120–130 mm Hg in MID–hypertensives), we considered a broader range of prevailing BPs (120–140 mm Hg) as a therapeutic target to test our hypothesis that TTR is a strong determinant of all‐cause mortality.
Figure 1.
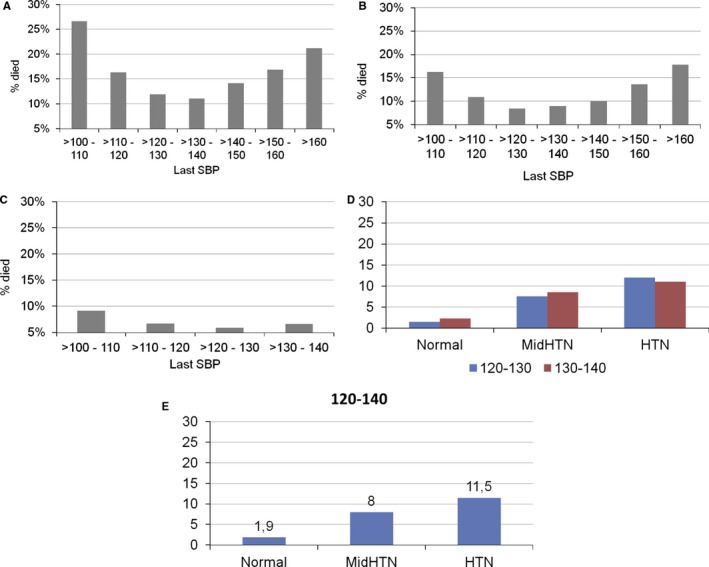
A, Death rates by last systolic BP in patients with established hypertension (>3 elevated BPs). B, Death rates by last systolic BP in patients with only 2 elevated systolic BPs (MID‐hypertensive group). C, Death rates by last systolic BP in nonhypertensives. D, Mortality rates by last systolic BP between 120 and 140 mmHg for Normal, Mid HTN, Hypertension, by 10 mmHg increments. E, Mortality rates by last systolic BP between 120 and 140 mmHg for Normal, Mid HTN, Hypertension, by 20mmHg increments. BP indicates blood pressure; HTN, hypertension; SBP, systolic blood pressure.
Mortality Rates by Time in Therapeutic Range
In order to test our second hypothesis, we compared all‐cause mortality rates according to the consistency of BP values within the therapeutic range over time in 4 groups: BP control most of the time (>75%), more than half of the time (50–75%), less than half of the time (25–50%), and only occasionally (<25%). In patients with established hypertension, the average number of BP measurements during the 10 years of follow‐up was 31.9/patient. A gradual, inverse, and strong association between mortality rates and consistency of systolic BP control was observed (Figure 2A). All‐cause mortality rates were increased gradually from 6.54% in the most consistently controlled group (>75% of BP readings over‐the‐time within the optimal therapeutic range), to 8.87%, 15.62%, and 23.52% moving towards the less consistently controlled groups (50–75%, 25–50%, and <25%, respectively, P<0.0001).
Figure 2.
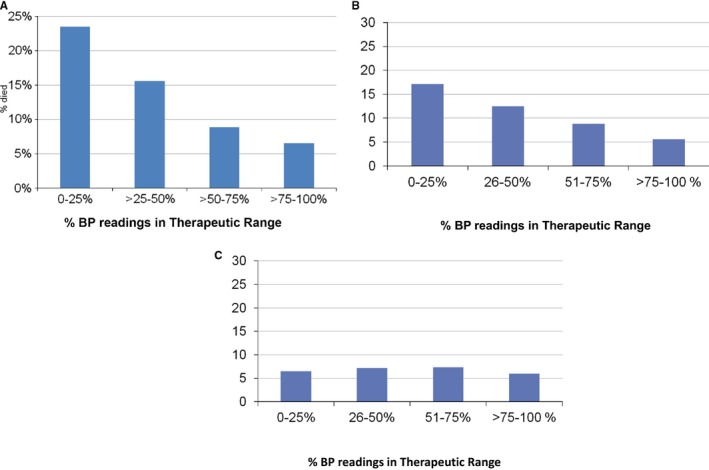
A, Mortality rates among patients with established hypertension based on percent of readings in therapeutic range. B, Mortality rates among patients with MID‐hypertension based on percent of readings in therapeutic range. C, Mortality rates among never‐hypertensive patients based on percent of readings in therapeutic range. BP indicates blood pressure.
Similar patterns were noted in participants with MID hypertension (Figure 2B), but not among normotensive participants (Figure 2C). We also compared mortality rates of patients with BPs most of the time (>75%) within the therapeutic range to those with BPs most of the time above or below the therapeutic range (Figure S2). Mortality rates were much lower for patients with BPs mostly within therapeutic range (6.5%) as compared with those above (21.9%) or below the therapeutic range (33.1%) (P<0.0001; Figure S2). The survival benefits of patients with systolic BP levels within the optimal therapeutic range most of the time compared with patients with systolic BP levels over and under this therapeutic range were independent of age and evident for all age groups (<55, 55–75, and >75 years) (Figure S3). All‐cause mortality rates in younger hypertensive patients (<55 years of age) were 2.9%, 11.2%, and 20.1% in patients with systolic BP levels most of the time within, over, and under the therapeutic range, respectively. All‐cause mortality rates in older patients (55–75 years) were 6.7%, 19.3%, and 32.5% in the 3 groups, respectively, while in the very old hypertensive participants (>75 years) the respective all‐cause mortality rates were 20.8%, 33.6%, and 57.7%.
Multivariate logistic regression analysis (adjusted for age, sex, race, and ethnicity) revealed that compared with the most consistently controlled group (systolic BP values within the therapeutic range >75% of the time) as the reference group, the odds ratios for all‐cause mortality in hypertensive patients (Table 2) were 1.14% (95% confidence interval, 1.07–1.21) for the second group (50–75% of the time), 1.92% (95% confidence interval, 1.81–2.04) for the third group (25–50% of the time), and 2.97 (95% confidence interval, 2.80–3.16) for the less consistently controlled group (<25% of the time). Similar trends were noted for MID‐hypertensive patients but not in normotensive participants. In addition, the respective mortality rates and odds ratios for systolic BP values above and below the therapeutic range according to consistency over‐the‐time in hypertensive patients are provided in Table S1.
Table 2.
Logistic Regression Odds Ratios, Number of Deaths, and % Mortality by TTR for Patients With Established Hypertension and MID‐HTN
| Level | N | Died | %Dead | OR (95% CI) | P Value | |
|---|---|---|---|---|---|---|
| Established HTN | ||||||
| TTR | 0% to 25% | 74 781 | 17 585 | 22.9 | 2.97 (2.80–3.16) | <0.0001 |
| >25% to 50% | 147 747 | 23 081 | 15.6 | 1.92 (1.81–2.04) | <0.0001 | |
| >50% to 75% | 129 226 | 11 463 | 8.8 | 1.14 (1.07–1.21) | <0.0001 | |
| >75% to 100% | 20 242 | 1323 | 6.5 | Reference group | ||
| MID‐HTN | ||||||
| TTR | 0% to 25% | 15 918 | 2717 | 17.1 | 2.67 (2.49–2.86) | <0.0001 |
| >25% to 50% | 56 200 | 7038 | 12.5 | 1.91 (1.80–2.03) | <0.0001 | |
| >50% to 75% | 77 600 | 6839 | 8.8 | 1.39 (1.31–1.47) | <0.0001 | |
| >75% to 100% | 29 962 | 1671 | 5.6 | Reference group | ||
Multivariate regression analysis, controlling for city, age, sex, and race. CI indicates confidence interval; HTN, hypertension; MID, intermediate; OR, odds ratio; TTR, time in therapeutic range.
Cox regression estimates for survival based on the time in therapeutic range in the 4 categories are depicted in Table 3 and Figure 3. Table 3 demonstrates increased mortality risk with less consistency in BP control, but the difference between 50% to 75% and 75% to 100% TTR was small, so in essence TTR >50% provides close to optimal results. Figure 3 shows that the separation of lines between more and less consistently controlled patients occurs early during the first year of the follow‐up period and increases over time during follow‐up. Again, the survival benefit of the 2 groups with the most consistent BP control over‐the‐time is quite similar, suggesting that systolic BP needs to be within the optimal therapeutic range at least half of the time in order to attain the best long‐term survival benefits.
Table 3.
Cox Regression Models Examined Associations Between Mortality and the Proportion of TTR, Using 3 Categorical Variables Where 76% to 100% was the Referent Group
| Parameter | Parameter Estimate (SE) | χ2 | P Value | HR (95% CI) |
|---|---|---|---|---|
| TTR | ||||
| 0% to 25% | 0.78 (0.03) | 657.22 | <0.0001 | 2.18 (2.06–2.32) |
| 26% to 50% | 0.37 (0.03) | 148.05 | <0.0001 | 1.45 (1.36–1.53) |
| 51% to 75% | −0.07 (0.03) | 5.23 | 0.022 | 0.93 (0.88–0.99) |
| 76% to 100% | Reference grp. | |||
Cox models adjusted for city location, age, race, and sex. CI indicates confidence interval; HR, hazard ratio; TTR, time in therapeutic range.
Figure 3.

Cox regression models: mortality rates for patients with systolic BP measurements in therapeutic range 0% to 25%, 25% to 50%, 50% to 75%, or >75% of BP measurements. Follow‐up to 120 mo. Corrected for location, age, sex, and race. BP indicates blood pressure; SBP, systolic blood pressure.
Discussion
This large, longitudinal study of US veterans has 2 main findings. First, systolic BP levels within the proposed optimal therapeutic range (120–140 mm Hg) are associated with significantly lower all‐cause mortality rates compared with BP levels over or under this therapeutic range in patients with hypertension. Second, all‐cause mortality strongly depends on the consistency of BP control over time. Total mortality rates were significantly lower among hypertensive patients, with most BP measurements remaining within the therapeutic (>75%) compared with occasional BP control (<25% of the time). Therefore, the study findings support our hypothesis that in patients with established hypertension, best outcomes are obtainable with stricter hypertension control and more time in a defined therapeutic range. Survival is significantly lower when systolic BP levels are maintained between 120 and 140 mm Hg most of the time in this hypertensive population. In fact, in patients with systolic BP measurements in therapeutic range (120–140 mm Hg) >75% of the time, mortality was about half of what was seen in the same population achieving last BP in the same range (6.5% versus 11.5%).
These findings are of major clinical importance for the optimal management of patients with arterial hypertension in real‐life clinical practice. Similar findings were found for the group of patients in the MID‐hypertension group. These patients were identified as such if they only had 1 or 2 elevated BPs recorded over the follow‐up period. It is likely that most of these patients were indeed hypertensive, but were either well treated and controlled or their third elevated BP was not recorded because of infrequent visits (on average they only had 8.1 BP measurements, of which only 1.4 were elevated). Mortality rates in this intermediate group of patients assessed by last BP in the range of 120 and 140 mm Hg was about 8% as compared with 11.5% for patients with established hypertension (Figure 1A and 1B). Of interest is that this group of patients also followed the same pattern of J‐shape curve. Patients with no elevated BPs during the follow‐up period (Never–Hypertensive) had much lower mortality rates. This group of patients was truncated since BPs >140 mm Hg were excluded by definition and patients with systolic BPs <100 mm Hg were excluded because of comorbidities. Nevertheless, the optimal systolic BP (last) was between 120 and 140 mm Hg.
The concept of the optimal therapeutic range between 120 and 140 mm Hg for systolic BP in hypertensive patients was based on a wealth of data. Accumulating evidence from large, randomized, controlled studies demonstrated without any doubt the benefits of treating elevated BP below 140 mm Hg, and this recommendation has been adopted by all current guidelines for the management of arterial hypertension.10, 15, 16 Observational studies have established the dogma “the lower, the better” in the hypertension field, since cardiovascular events (myocardial infarction and stroke) were significantly fewer with lower BP values down to 110 mm Hg.17 However, a J‐curve association between BP values and outcomes has been observed in some prospective studies, and in most retrospective analyses, especially in patients with coronary artery disease,18, 19, 20, 21 raising doubts about aggressive BP reduction. Although the J‐curve concept fell out of favor for more than a decade, mainly because of the findings of the Hypertension Optimal Treatment study,7 a post hoc analysis of the INVEST (International Verapamil SR/Trandolapril) study (later reinforced by several other studies) rekindled the concerns about lowering BP very aggressively.22 The turning point of cardiovascular benefits to risks with systolic BP reduction was at 119 mm Hg in the INVEST study. These data generated the hypothesis of the optimal therapeutic range between 120 and 140 mm Hg for systolic BP in hypertensive patients. A therapeutic range rather than a fixed target is preferable and more suitable for clinical practice, since BP level varies from day to day and from visit to visit even without interventions.
We opted to focus on systolic BP alone, instead of diastolic BP or both for several reasons. Although the original VA studies and the first versions of Joint National Committee guidelines have focused on diastolic BP alone, it was later realized that systolic BP is a stronger determinant of cardiovascular outcomes in hypertensive patients, especially in older age.23, 24, 25 Indeed, the management of study participants in the recent Systolic Pressure Intervention Trial was based on systolic BP levels alone, almost ignoring diastolic BP levels.11
The TTR is an innovative concept in the field of hypertension. Guidelines for the management of main cardiovascular risk factors (arterial hypertension, diabetes mellitus, and dyslipidemia) have adopted a cut‐off level approach, defining a threshold level to be achieved, which in the case of arterial hypertension is a BP level <140/90 mm Hg. However, no recommendation or guidance is given to practicing physicians on what to do once BP levels are below that threshold. Is any level of BP below the therapeutic threshold acceptable? Is 138 similarly acceptable to 132, 124, and 115 mm Hg? What are we supposed to do with the risk of too low level of BP? In other fields of cardiovascular medicine, such as in anticoagulant therapy with vitamin‐K antagonists, a therapeutic range (window) instead of a certain threshold has been established. The adoption of a range is mainly based on the detrimental effects of hypo‐ and hypertherapy outside the therapeutic range. In the case of anticoagulation, a major increase in risk of complications has been established above and below the therapeutic range (international normalized ratio 2.0–3.0). Real‐life practice indicates that BP varies significantly over time, just like international normalized ratio levels with vitamin‐K antagonists, so it seems more practical and clinically meaningful to define a therapeutic range instead of a certain threshold for BP control, and take into account the TTR. TTR of BP control, as in the case of vitamin‐K antagonists,26 is strongly related to outcomes. Consistency of BP control over time is of sentinel importance in the management of arterial hypertension, since BP levels vary significantly during the lifelong antihypertensive therapy in the majority of patients. Consistency of BP control defines the real BP load over time, and is expected to provide a more accurate estimate of future cardiovascular events than a BP value at any specific time‐point. Consistency of BP control over time might be expressed as the percentage of BP control measurements over time.
The J‐curve controversy is based on the achieved BP levels (ie, the last BP reading of participants in randomized trials). Although the last or achieved BP provides very important information and consistently reflects the J‐shape curve phenomenon (observed in our study as well, Figure 1), it has limitations; it is affected by reverse causality and it is contaminated by confounders (ie, last BP may reflect heart failure that developed in the past few months, cancer or weight loss, etc that happened in the last few months of follow‐up or before death). It does not necessarily reflect the hypertensive load over time or over a lifetime. On the other hand, TTR reflects both the variability and hypertension burden over time. Blood pressure variability during lifelong antihypertensive therapy needs to be taken into account. Long‐term BP variability has been associated with cardiovascular outcomes in post hoc analyses of several large trials.27, 28 Although long‐term BP variability may contribute to cardiovascular risk, it has not by itself become a therapeutic target yet. We believe the average prevailing BP over time and the degree of variability (intrinsic or because of non–drug compliance or medication change) are major determinants of cardiovascular outcomes. The lower the average over time BP (within the therapeutic window) and the higher percentage TTR, the lower the risk for premature death. Thus, TTR for BP control may be a useful measure for everyday clinical practice. This is the first time we (or anyone) used the concept of TTR as a determinant of mortality in patients with hypertension. In our study population, systolic BP values within the therapeutic range most of the time (>75%) were associated with the lowest all‐cause mortality when compared with transient (25–50%) or occasional (<25%) BP values within the optimal therapeutic range. The survival benefits were evident even in the group of patients with systolic BP values within the therapeutic range more than half of the time (50–75%), rendering our study findings more applicable in real‐life clinical practice. It can be rationally assumed that BP values between 120 and 140 mm Hg can be achieved more easily in 60% instead of 90% of the measurements during lifelong antihypertensive therapy.
Of note, the mortality rates were significantly higher in hypertensive patients who had BP values over or under the optimal therapeutic range most of the time rather than occasionally (>75% versus <25%, respectively) (9.63% versus 21.87%; P<0.0001 for values over the therapeutic range; and 13.93% versus 33.08%; P<0.0001 for values under the therapeutic range), indicating that BP values outside the therapeutic range are more detrimental when they are consistently outside the therapeutic range. Thus, being hypertensive or hypotensive most of the time is more deleterious than having occasional measures outside the range.
Two more findings in our study are noteworthy and merit discussion: the mortality rate of individuals in the intermediate BP group and the mortality rates in normotensive individuals.
The mortality rates of individuals classified in the intermediate BP group (1 or 2 elevated BP readings during the study period) was lower than the ones of hypertensive patients (as expected) but significantly higher than the mortality rates of normotensive individuals. This can be translated as an exaggerated mortality risk in individuals with only 1 or 2 cases of documented BP elevations over time compared with individuals who were normotensives all the time. To our knowledge, this is a unique finding, and this group of individuals has never been tested before. Although these individuals cannot be characterized as hypertensives by currently used diagnostic criteria, they are at significantly increased risk of dying compared with “all‐time” normotensive subjects. This group of individuals is currently included in normotension and has to be better characterized and assessed in future studies.
In normotensive individuals, the mortality rates with BP values within the therapeutic range most of the time were not significantly different than the ones of normotensives with BP values <120 mm Hg most of the time. Of note, BP values <120 mm Hg in reality mean 100 to 120 mm Hg since patients with any measure of BP <100 mm Hg were excluded from the study. This observation can be interpreted in different ways. On the one hand, BP values consistently below 120 mm Hg are not detrimental in normotensive individuals, unlike hypertensive patients. This is in line with observational data from other studies reporting better outcomes with lower BP values in normotensive individuals. On the other hand, BP values consistently within the prehypertension range are not associated with increased total mortality when compared with BP values consistently below 120 mm Hg. This finding is in line with 3 large meta‐analyses that did not find any association between prehypertension and all‐cause mortality.29, 30, 31 Since prehypertension in our study was based on multiple BP readings over‐the‐time (≈7 in average), this finding is further credited and adds more fuel on questioning the necessity and utility of the term prehypertension, a classification currently used for patients with BP values between 120 and 140 mm Hg.
Our study has several strengths and limitations. Its major strength is to propose the TTR as an alternative approach for the follow‐up of hypertensive patients and assess this concept in a very large database of almost 700 000 individuals from 15 different US states, with almost 15 million BP readings during a multiyear study period. The study is mainly limited by the lack of specific information of some baseline characteristics (body mass index, concomitant disease, medications, and glycemic, lipid, and renal status). Missing information would be important for adjustments and subgroup analyses; however, it is not likely to significantly alter our study findings. The study is also limited by the very small number of female participants, narrowing the generalization of study findings to male individuals alone. Finally, information about cardiovascular morbidity and mortality is not available; however, all‐cause mortality is the hardest end point, and the only one that cannot be debated at all.
Conclusions
From analysis of these data we can therefore conclude the following:
In patients with established hypertension or milder‐intermediate hypertension (1, 2 BP elevations during follow‐up), consistent control of systolic BP in the range of 120 to 140 mm Hg provides the lowest risk for all‐cause mortality.
In these 2 groups of patients, persistent systolic BP >140 mm Hg or between 100 and 120 mm Hg is associated with higher mortality risk.
In never‐hypertensive patients, risk of death from all causes was similar, with systolic BPs 100 to 120 or 120 to 140 mm Hg.
TTR is a useful index of risk over time in patients with hypertension and may have an impact on long‐term follow‐up.
Disclosures
None.
Supporting information
Table S1. Logistic Regression Odds Ratios, Number of Deaths, and Percentage Mortality by Time in Therapeutic Range (TTR) Patients With Established Hypertension (3 or More Elevated BPs, N=371 996)
Figure S1. A, Mortality rates by last systolic BP between 120 and 140 mm Hg for Normal, Mid‐HTN, hypertension. B, Mortality rates by last systolic BP between 120 and 140 mm Hg for Normal, Mid‐HTN, hypertension. BP indicates blood pressure.
Figure S2. Mortality rates in patients with established hypertension being >75% of time (percent readings) within, over, or under the therapeutic range (120–140 mm Hg). TR indicates therapeutic range.
Figure S3. Mortality rates in patients being >75% of time (percent readings) within, over, or under the therapeutic range (120–140 mm Hg) by age group. BP indicates blood pressure.
(J Am Heart Assoc. 2017;6:e007131 DOI: 10.1161/JAHA.117.007131.)29101118
References
- 1. Veterans Administration Cooperative Study Group on Antihypertensive Agents . Effects of treatment on morbidity in hypertension. Results in patients with diastolic blood pressure averaging 115 through 129 mm Hg. JAMA. 1967;202:1028–1034. [PubMed] [Google Scholar]
- 2. Veterans Administration Cooperative Study Group on Antihypertensive Agents . Effects of treatment on morbidity in hypertension. II. Results in patients with diastolic blood pressure averaging 90 through 114 mm Hg. JAMA. 1970;213:1143–1152. [PubMed] [Google Scholar]
- 3. Hypertension Detection and Follow‐Up Program Cooperative Group . Five‐year findings of the hypertension detection and follow‐up program: I. Reduction in mortality of persons with high blood pressure, including mild hypertension. JAMA. 1979;242:2562–2571. [PubMed] [Google Scholar]
- 4. Management Committee of the Australian National Blood Pressure Study . The Australian therapeutic trial in mild hypertension. Lancet. 1980;1:1261–1267. [PubMed] [Google Scholar]
- 5. Medical Research Council Working Party . MRC trial of treatment of mild hypertension: principal results. BMJ. 1985;291:97–104. [DOI] [PMC free article] [PubMed] [Google Scholar]
- 6. SHEP Cooperative Research Group . Prevention of stroke by antihypertensive treatment in older persons with isolated systolic hypertension: final results of the Systolic Hypertension in the Elderly Program (SHEP). JAMA. 1991;265:3255–3264. [PubMed] [Google Scholar]
- 7. Hansson L, Zanchetti A, Carruthers SG, Dahlof B, Elmfeldt D, Julius S, Menard J, Rahn KH, Wedel H, Westerling S. Effects of intensive blood‐pressure lowering and low‐dose aspirin in patients with hypertension: principal results of the Hypertension Optimal Treatment (HOT) randomised trial. HOT Study Group. Lancet. 1998;351:1755–1762. [DOI] [PubMed] [Google Scholar]
- 8. Emdin CA, Rahimi K, Neal B, Callender T, Perkovic V, Patel A. Blood pressure lowering in type 2 diabetes: a systematic review and meta‐analysis. JAMA. 2015;313:603–615. [DOI] [PubMed] [Google Scholar]
- 9. Qaseem A, Wilt TJ, Rich R, Humphrey LL, Frost J, Forciea MA; Clinical Guidelines Committee of the American College of Physicians and the Commission on Health of the Public and Science of the American Academy of Family Physicians . Pharmacologic treatment of hypertension in adults aged 60 years or older to higher versus lower blood pressure targets: a clinical practice guideline from the American College of Physicians and the American Academy of Family Physicians. Ann Intern Med. 2017;166:430–437. [DOI] [PubMed] [Google Scholar]
- 10. James PA, Oparil S, Carter BL, Cushman WC, Dennison‐Himmelfarb C, Handler J, Lackland DT, LeFevre ML, MacKenzie TD, Ogedegbe O, Smith SC Jr, Svetkey LP, Taler SJ, Townsend RR, Wright JT Jr, Narva AS, Ortiz E. 2014 evidence‐based guideline for the management of high blood pressure in adults: report from the panel members appointed to the Eighth Joint National Committee (JNC 8). JAMA. 2014;311:507–520. [DOI] [PubMed] [Google Scholar]
- 11. The SPRINT Research Group . A randomized trial of intensive versus standard blood pressure control. N Engl J Med. 2015;373:2103–2116. [DOI] [PMC free article] [PubMed] [Google Scholar]
- 12. Mancia G, Kjeldsen SE. Adopting Systolic Pressure Intervention Trial (SPRINT)‐like office blood pressure measurements in clinical practice. J Hypertens. 2017;35:471–472. [DOI] [PubMed] [Google Scholar]
- 13. Kjeldsen SE, Mancia G. Unobserved automated office blood pressure measurement in the Systolic Blood Pressure Intervention Trial (SPRINT): systolic blood pressure treatment target remains below 140 mmHg. Eur Heart J Cardiovasc Pharmacother. 2016;2:79–80. [DOI] [PubMed] [Google Scholar]
- 14. Fletcher RD, Amdur RL, Kolodner R, McManus C, Jones R, Faselis C, Kokkinos P, Singh S, Papademetriou V. Blood pressure control among US veterans: a large multi‐year analysis of blood pressure data from the VA Health Data Repository. Circulation. 2012;125:2462–4268. [DOI] [PubMed] [Google Scholar]
- 15. Mancia G, Fagard R, Narkiewicz K, Redón J, Zanchetti A, Böhm M, Christiaens T, Cifkova R, De Backer G, Dominiczak A, Galderisi M, Grobbee DE, Jaarsma T, Kirchhof P, Kjeldsen SE, Laurent S, Manolis AJ, Nilsson PM, Ruilope LM, Schmieder RE, Simes PA, Sleight P, Viigimaa M, Waeber B, Zannad F; Task Force Members . 2013 ESH/ESC guidelines for the management of arterial hypertension: the Task Force for the management of arterial hypertension of the European Society of Hypertension (ESH) and of the European Society of Cardiology (ESC). J Hypertens. 2013;31:1281–1357. [DOI] [PubMed] [Google Scholar]
- 16. Leung AA, Nerenberg K, Daskalopoulou SS, McBrien K, Zarnke KB, Dasgupta K, Cloutier L, Gelfer M, Lamarre‐Cliche M, Milot A, Bolli P, Tremblay G, McLean D, Tobe SW, Ruzicka M, Burns KD, Vallée M, Prasad GV, Lebel M, Feldman RD, Selby P, Pipe A, Schiffrin EL, McFarlane PA, Oh P, Hegele RA, Khara M, Wilson TW, Penner SB, Burgess E, Herman RJ, Bacon SL, Rabkin SW, Gilbert RE, Campbell TS, Grover S, Honos G, Lindsay P, Hill MD, Coutts SB, Gubitz G, Campbell NR, Moe GW, Howlett JG, Boulanger JM, Prebtani A, Larochelle P, Leiter LA, Jones C, Ogilvie RI, Woo V, Kaczorowski J, Trudeau L, Petrella RJ, Hiremath S, Drouin D, Lavoie KL, Hamet P, Fodor G, Grégoire JC, Lewanczuk R, Dresser GK, Sharma M, Reid D, Lear SA, Moullec G, Gupta M, Magee LA, Logan AG, Harris KC, Dionne J, Fournier A, Benoit G, Feber J, Poirier L, Padwal RS, Rabi DM; CHEP Guidelines Task Force . Hypertension Canada's 2016 Canadian Hypertension Education Program guidelines for blood pressure measurement, diagnosis, assessment of risk, prevention, and treatment of hypertension. Can J Cardiol. 2016;32:569–588. [DOI] [PubMed] [Google Scholar]
- 17. Lewington S, Clarke R, Qizilbash N, Peto R, Collins R; Prospective Studies Collaboration . Age‐specific relevance of usual blood pressure to vascular mortality: a meta‐analysis of individual data for one million adults in 61 prospective studies. Lancet. 2002;360:1903–1913. [DOI] [PubMed] [Google Scholar]
- 18. Stewart IMG. Relation of reduction in pressure to first myocardial infarction in patients receiving treatment for severe hypertension. Lancet. 1979;313:861–865. [DOI] [PubMed] [Google Scholar]
- 19. D'Agostino RB, Belanger AJ, Kannel WB, Cruickshank JM. Relation of low diastolic blood pressure to coronary heart disease death in presence of myocardial infarction: the Framingham Study. BMJ. 1991;303:385–389. [DOI] [PMC free article] [PubMed] [Google Scholar]
- 20. Cruickshank JM. Coronary flow reserve and the J curve relation between diastolic blood pressure and myocardial infarction. BMJ. 1988;297:1227–1230. [DOI] [PMC free article] [PubMed] [Google Scholar]
- 21. Fagard RH, Staessen JA, Thijs L, Celis H, Bulpitt CJ, deLeeuw PW , Leonetti G, Tuomilehto J, Yodfat Y. On‐treatment diastolic blood pressure and prognosis in systolic hypertension. Arch Intern Med. 2007;167:1884–1891. [DOI] [PubMed] [Google Scholar]
- 22. Messerli FH, Mancia G, Conti CR, Hewkin AC, Kupfer S, Champion A, Kolloch R, Benetos A, Pepine CJ. Dogma disputed: can aggressively lowering blood pressure in hypertensive patients with coronary artery disease be dangerous? Ann Intern Med. 2006;144:884–893. [DOI] [PubMed] [Google Scholar]
- 23. Stamler J, Stamler R, Neaton JD. Blood pressure, systolic and diastolic, and cardiovascular risks. US population data. Arch Intern Med. 1993;153:598–615. [DOI] [PubMed] [Google Scholar]
- 24. Franklin SS, Jacobs MJ, Wong ND, L'Italien GJ, Lapeurta P. Predominance of isolated systolic hypertension among middle aged and elderly US hypertensives: analysis based on National Health and Nutrition Examination Survey (NHANES III). Hypertension. 2001;37:869–874. [DOI] [PubMed] [Google Scholar]
- 25. Williams B, Lindholm LH, Sever P. Systolic pressure is all that matters. Lancet. 2008;371:2219–2221. [DOI] [PubMed] [Google Scholar]
- 26. Senoo K, Lip GY. Female sex, time in therapeutic range, and clinical outcomes in atrial fibrillation patients taking warfarin. Stroke. 2016;47:1665–1668. [DOI] [PubMed] [Google Scholar]
- 27. Rothwell PM, Howard SC, Dolan E, O'Brien E, Dobson JE, Dahlöf B, Sever PS, Poulter NR. Prognostic significance of visit‐to‐visit variability, maximum systolic blood pressure, and episodic hypertension. Lancet. 2010;375:895–905. [DOI] [PubMed] [Google Scholar]
- 28. Muntner P, Whittle J, Lynch AI, Colantonio LD, Simpson LM, Einhorn PT, Levitan EB, Whelton PK, Cushman WC, Louis GT, Davis BR, Oparil S. Visit‐to‐visit variability of blood pressure and coronary heart disease, stroke, heart failure, and mortality: a cohort study. Ann Intern Med. 2015;163:329–338. [DOI] [PMC free article] [PubMed] [Google Scholar]
- 29. Guo X, Zhang X, Zheng L, Guo L, Li Z, Yu S, Yang H, Zhou X, Zou L, Zhang X, Sun Z, Li J, Sun Y. Prehypertension is not associated with all‐cause mortality: a systematic review and meta‐analysis of prospective studies. PLoS One. 2013;8:e61796. [DOI] [PMC free article] [PubMed] [Google Scholar]
- 30. Wang S, Wu H, Zhang Q, Xu J, Fan Y. Impact of baseline prehypertension on cardiovascular events and all‐cause mortality in the general population: a meta‐analysis of prospective cohort studies. Int J Cardiol. 2013;168:4857–4860. [DOI] [PubMed] [Google Scholar]
- 31. Huang Y, Su L, Cai X, Mai W, Wang S, Hu Y, Wu Y, Tang H, Xu D. Association of all‐cause and cardiovascular mortality with prehypertension: a meta‐analysis. Am Heart J. 2014;167:160–168. [DOI] [PubMed] [Google Scholar]
Associated Data
This section collects any data citations, data availability statements, or supplementary materials included in this article.
Supplementary Materials
Table S1. Logistic Regression Odds Ratios, Number of Deaths, and Percentage Mortality by Time in Therapeutic Range (TTR) Patients With Established Hypertension (3 or More Elevated BPs, N=371 996)
Figure S1. A, Mortality rates by last systolic BP between 120 and 140 mm Hg for Normal, Mid‐HTN, hypertension. B, Mortality rates by last systolic BP between 120 and 140 mm Hg for Normal, Mid‐HTN, hypertension. BP indicates blood pressure.
Figure S2. Mortality rates in patients with established hypertension being >75% of time (percent readings) within, over, or under the therapeutic range (120–140 mm Hg). TR indicates therapeutic range.
Figure S3. Mortality rates in patients being >75% of time (percent readings) within, over, or under the therapeutic range (120–140 mm Hg) by age group. BP indicates blood pressure.