

Abstract
Background
Studies have shown that long‐term exposure to air pollution such as fine particulate matter (≤2.5 μm in aerodynamic diameter [PM 2.5]) increases the risk of all‐cause and cardiovascular mortality. To date, however, there are limited data on the impact of air pollution on specific cardiovascular diseases. This study aimed to evaluate cardiovascular effects of long‐term exposure to air pollution among residents of Seoul, Korea.
Methods and Results
Healthy participants with no previous history of cardiovascular disease were evaluated between 2007 and 2013. Exposure to air pollutants was estimated by linking the location of outdoor monitors to the ZIP code of each participant's residence. Crude and adjusted analyses were performed using Cox regression models to evaluate the risk for composite cardiovascular events including cardiovascular mortality, acute myocardial infarction, congestive heart failure, and stroke. A total of 136 094 participants were followed for a median of 7.0 years (900 845 person‐years). The risk of major cardiovascular events increased with higher mean concentrations of PM 2.5 in a linear relationship, with a hazard ratio of 1.36 (95% confidence interval, 1.29–1.43) per 1 μg/m3 PM 2.5. Other pollutants including PM 2.5–10 of CO, SO 2, and NO 2, but not O3, were significantly associated with increased risk of cardiovascular events. The burden from air pollution was comparable to that from hypertension and diabetes mellitus.
Conclusions
This large‐scale population‐based study demonstrated that long‐term exposure to air pollution including PM 2.5 increases the risk of major cardiovascular disease and mortality. Air pollution should be considered an important modifiable environmental cardiovascular risk factor.
Keywords: air pollution, cardiovascular disease risk factors, epidemiology, particulate matter
Subject Categories: Cardiovascular Disease, Epidemiology, Risk Factors
Clinical Perspective
What Is New?
This study showed that every 1‐μg/m3 increase of long‐term exposure to fine particulate matter ≤2.5 μm in aerodynamic diameter was associated with a 36% increased risk of cardiovascular events among healthy participants with no history cardiovascular diseases who resided in Seoul, Korea.
The effects were consistent for all cardiovascular events including cardiovascular mortality, acute myocardial infarction, congestive heart failure, and stroke.
What Are the Clinical Implications?
Long‐term exposure to ambient air pollutants is a major risk factor for cardiovascular diseases.
Ambient air pollution needs to be considered as a public health issue, and measures to control the level of air pollution are required to reduce the burden of cardiovascular disease.
Air pollution affects human health. The World Health Organization estimates that 7 million deaths were attributable to air pollution exposure worldwide in 2012.1 The Global Burden of Disease Study 2015 ranked ambient exposure to fine particulate matter with an aerodynamic diameter of <2.5 μm (PM2.5) as the fifth most important risk factor for mortality worldwide.2, 3
The cardiovascular health consequences of air pollution exceed all its other health effects such as pulmonary diseases.4, 5 Deaths from cardiovascular causes account for more than two thirds of the premature deaths attributable to ambient PM2.5 air pollution.2 Increasing amounts of data suggest exposure to PM2.5 increases the risk of cardiovascular deaths and diseases in the short and long terms.6, 7, 8, 9, 10 It also has been suggested that the long‐term effects of PM2.5 have a greater impact on cardiovascular mortality than the short‐term effects.4, 5
Nevertheless, there are still limited data on the long‐term effects of air pollution on specific cardiovascular diseases.11, 12 In addition, most previous studies were conducted in the United States or Europe. This population‐based study was performed to estimate the cardiovascular effects of long‐term exposure to air pollution among residents of Seoul, Korea. The risks of all‐cause and cardiovascular mortality and the incidence of cardiovascular diseases including acute myocardial infarction (AMI), congestive heart failure (CHF), and stroke were evaluated while controlling for potential confounders.
Methods
Study Design and Participants
Administrative information on individuals who resided in Seoul was linked with health insurance claims data, which allowed for long‐term follow‐up without loss. The study participants were extracted from the National Health Insurance Service–National Sample Cohort (NHIS‐NSC). The design and profile of the cohort have been described previously.13 The NHIS is the single insurance provider in Korea that covers all citizens. The NHIS‐NSC is a population‐based cohort including 1 025 340 individuals who were randomly sampled from the population database—equivalent to ≈2% of the Korean population. Participants' personal information, demographic characteristics, and medical treatment data are included in the data set.
In this study, participants aged ≥18 years who resided in Seoul between 2007 and 2013 were selected from the NHIS‐NSC. Those with a previous history of cardiovascular disease such as AMI, CHF, and stroke were excluded. Variables such as anthropometric measurements, physical examination, laboratory tests, and self‐reporting questionnaires were available from the general health examination database. The insurance eligibility database was linked to extract information on each participant's identity and socioeconomic variables such as age, sex, residential area, and income level. The survival time was censored when a participant moved out of the study city (Seoul). Otherwise, all participants were observed until December 31, 2013, or their death. This study was exempt from review by the Seoul National University Bundang Hospital institutional review board (I‐2016‐4043).
Air Pollution Exposure Estimates
We obtained information on daily air pollution levels provided by the Korean Ministry of Environment website (http://www.airkorea.or.kr). Air pollutants including PM2.5, particles with a diameter <10 μm (PM10), carbon monoxide (CO), sulfur dioxide (SO2), nitrogen dioxide (NO2), and ozone (O3) were collected from 27 monitoring stations in Seoul. We measured PM2.5 by mass concentration, PM10 by the β‐ray absorption method, CO by the nondispersive infrared method, SO2 by pulse ultraviolet fluorescence, NO2 by chemiluminescence, and O3 by ultraviolet photometry.
Each individual's exposure to air pollutants was determined by linking the location of the monitoring stations to the ZIP code of his or her residence. The long‐term average concentrations of the air pollutants were estimated by daily averages from the date of study enrollment to the occurrence of study end points. Data points that were highly discrepant with other observations were excluded from the analysis.
Cardiovascular Outcomes
Vital status, date of death, and cause of death were identified using the death certificate records from the National Death Index. Cardiovascular mortality was defined according to the International Classification of Diseases, 10th Revision (ICD‐10) codes (I00–I99). AMI was defined as a hospitalization with ICD‐10 codes I21 to 23 as the primary or secondary diagnosis. CHF was defined based on discharge diagnosis (ICD‐10 codes I11.0, I13.0, I13.2, I25.5, I42, I50, O90.3) after a hospitalization. Stroke was defined by discharge diagnosis (ICD‐10 codes: I60–64) among patients who had been hospitalized and undergone brain imaging studies such as computed tomography and magnetic resonance imaging.14 Ischemic and hemorrhagic strokes were defined by ICD‐10 codes I63 to 64 and I60 to 62, respectively. Composite cardiovascular events were defined as a composite of cardiovascular death, AMI, CHF, and stroke.
Statistical Analyses
Baseline characteristics were shown as mean±SD or proportions. Cox proportional hazards models were used to assess the association between air pollution exposure and study outcomes. Hazard ratios (HRs) and 95% confidence intervals were calculated for the risk of time‐dependent variables. Multiple statistical models were constructed to adjust for potential confounding factors. We evaluated unadjusted models, age and sex‐adjusted models, and multivariable models. Multivariable‐adjusted model 1 was controlled for age, sex, socioeconomic status, hypertension, diabetes mellitus, dyslipidemia, chronic renal failure, end‐stage renal diseases, ischemic heart disease, peripheral arterial disease, chronic obstructive pulmonary disease, and malignancy. Multivariable‐adjusted model 2 was controlled for the variables listed above as well as body mass index (in kg/m2; <18.5, 18.5–24.9, 25–29.9, and ≥30), fasting blood glucose (<100, 100–125, 126–199, and ≥200 mg/dL), total cholesterol (<200, 200–239, and ≥240 mg/dL), and hemoglobin (<13 and ≥13 g/dL in men, <12 and ≥12 g/dL in women).
Penalized splines were constructed to evaluate the nonlinear relationship between air pollution and cardiovascular outcomes. Population‐attributable risks and their 95% confidence intervals were calculated by a method using logistic regression models.15 Exposure to PM2.5 was coded binomially (≥25 or <25 μg/m3). All statistical analyses used R version 3.3.3 (R Foundation for Statistical Computing; http://www.R-project.org). Two‐sided P values <0.05 were considered statistically significant.
Results
Study Participants and Exposure to Air Pollution
A total of 136 094 residents of Seoul were included in this study. As shown in Table 1, the study participants were representative of the general population. The mean age was 42 years, and 49.1% were men. The proportions of hypertension, diabetes mellitus, dyslipidemia, and active smoking were 9.8%, 3.1%, 7.5%, and 24.2%, respectively. The mean body mass index was 23.5 kg/m2, and blood pressure was 122/76 mm Hg.
Table 1.
Baseline Profiles of Study Population
| Characteristics | Values |
|---|---|
| Total number of participants | 136 094 |
| Age, y | 42.05±14.83 (136 094)* |
| <45 y | 58.2 (79 245/136 094) |
| 45–54 y | 21.3 (29 006/136 094) |
| 55–64 y | 11.8 (16 174/136 094) |
| ≥65 y | 8.6 (11 669/136 094) |
| Male sex | 49.1 (66 851/136 094) |
| Income quintiles | |
| Upper | 32.4 (44 127/136 094) |
| Upper middle | 21.1 (28 712/136 094) |
| Middle | 17.7 (24 100/136 094) |
| Lower middle | 15.4 (20 957/136 094) |
| Lower | 11.3 (15 407/136 094) |
| Covered by medical aid | 2.1 (2791/136 094) |
| Hypertension | 9.8 (13 303/136 094) |
| Diabetes mellitus | 3.1 (4154/136 094) |
| Dyslipidemia | 7.5 (10 189/136 094) |
| Chronic renal failure | 0.3 (361/136 094) |
| End‐stage renal disease | 0.1 (88/136 094) |
| Ischemic heart disease | 1.4 (1881/136 094) |
| Peripheral arterial disease | 1.3 (1803/136 094) |
| Chronic obstructive pulmonary disease | 0.4 (554/136 094) |
| Malignancy | 1.0 (1367/136 094) |
| Body mass index, kg/m2 | 23.49±3.31 (95 591) |
| Underweight (<18.5) | 4.8 (4628/95 591) |
| Normal (18.5–24.9) | 65.2 (62 290/95 591) |
| Overweight (25–29.9) | 26.6 (25 395/95 591) |
| Obese (≥30) | 3.4 (3278/95 591) |
| Smoking status | |
| Never smoker | 67.3 (60 081/89 322) |
| Ex‐smoker | 8.6 (7641/89 322) |
| Current smoker | 24.2 (21 600/89 322) |
| Systolic blood pressure, mm Hg | 121.60±15.96 (95 583) |
| Diastolic blood pressure, mm Hg | 75.91±10.79 (95 581) |
| Fasting blood glucose, mg/dL | 95.51±23.31 (95 578) |
| Hemoglobin, g/dL | 13.91±1.61 (95 561) |
| Total cholesterol, mg/dL | 193.90±36.61 (95 564) |
Data are presented as mean±SD (n) or % (n/N).
Figure 1 shows the average concentrations of PM2.5 within Seoul, which significantly decreased during the study period. The yearly trends for the average concentrations of air pollutants are shown in Figure S1. All measured pollutants except O3 demonstrated consistent decreases. Daily concentrations of air pollutants during the study period and their correlation matrix are summarized in Tables S1 and S2. The daily mean concentration of PM2.5 was 25.0 μg/m3. The individual exposure to air pollutants varied: The mean PM2.5 was 25.6 μg/m3 (minimum, 23.8 μg/m3; maximum, 27.8 μg/m3).
Figure 1.
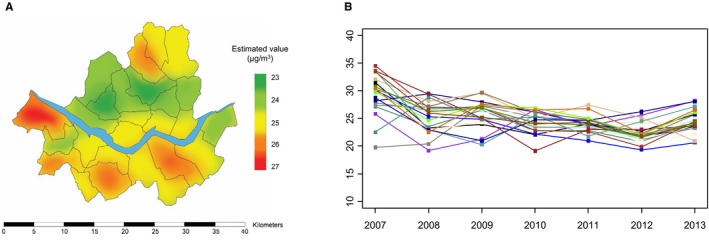
The concentrations of PM 2.5 in Seoul, 2007–2013. (A) Maps of average PM 2.5 concentrations, and (B) yearly concentrations of PM 2.5 at each monitor. PM2.5 indicates fine particulate matter ≤2.5 μm in aerodynamic diameter.
Risks of Cardiovascular Events
During a median follow‐up of 7.0 years (900 845 person‐years), 1658 all‐cause deaths (0.21 per 100 person‐years) and 1856 composite cardiovascular events (0.18 per 100 person‐years) occurred (Table S3). Ischemic stroke was the most frequently observed cardiovascular event, followed by CHF, AMI, hemorrhagic stroke, and cardiovascular mortality.
A concentration‐response curve with the penalized spline Cox regression model suggested that long‐term exposure to PM2.5, PM2.5–10, CO, SO2, and NO2 was associated with an increased occurrence of composite cardiovascular events (cardiovascular mortality, AMI, CHF, and stroke; Figure 2). The risk of composite cardiovascular events was elevated by 36% for a 1‐μg/m3 increase of PM2.5 (Table 2, Figure 3). All study outcomes including mortality, CHF, AMI, and stroke were significantly associated with long‐term exposure to PM2.5. In numerical terms, the increase in risk was highest for CHF and lowest for hemorrhagic stroke for each increment in PM2.5 exposure. A variety of adjustment models controlling for potential confounding factors such as age, sex, and other baseline cardiovascular risk factors showed consistent results.
Figure 2.
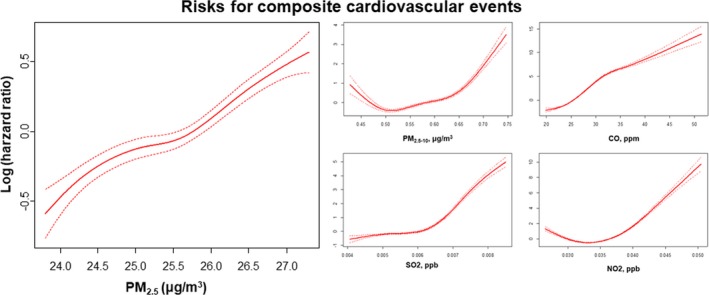
Relationship between long exposure to PM 2.5, PM 2.5–10, CO, SO 2, and NO 2 and composite cardiovascular events. Cox regression model for cardiovascular risk in response to PM 2.5 exposure was smoothed using penalized spline methods with 3 df. The y‐axis represents the log hazard ratio (solid line). CO indicates carbon monoxide; NO2, nitrogen dioxide: O3, ozone; PM2.5, fine particulate matter ≤2.5 μm in aerodynamic diameter; PM2.5–10 indicates fine particulate matter ≤2.5 to 10 μm in aerodynamic diameter; SO2, sulfur dioxide.
Table 2.
Estimated HRs and 95% CIs for Cardiovascular Events According to Increased Exposure to Air Pollutants
| Unadjusted | Age, Sex‐Adjusted | Multivariable‐Adjusted (1)a | Multivariable‐Adjusted (2)b | |||||
|---|---|---|---|---|---|---|---|---|
| HR (95% CI) | P Value | HR (95% CI) | P Value | HR (95% CI) | P Value | HR (95% CI) | P Value | |
| PM2.5, per 1 μg/m3 | ||||||||
| Composite cardiovascular events | 1.36 (1.29–1.43) | <0.001 | 1.37 (1.30–1.44) | <0.001 | 1.42 (1.33–1.51) | <0.001 | 1.41 (1.32–1.50) | <0.001 |
| All‐cause death | 1.36 (1.29–1.43) | <0.001 | 1.38 (1.31–1.45) | <0.001 | 1.34 (1.23–1.44) | <0.001 | 1.32 (1.22–1.43) | <0.001 |
| Cardiovascular death | 1.24 (1.09–1.42) | 0.0011 | 1.26 (1.11–1.44) | <0.001 | 1.38 (1.13–1.68) | 0.002 | 1.36 (1.11–1.66) | 0.003 |
| Acute myocardial infarction | 1.30 (1.16–1.46) | <0.001 | 1.33 (1.19–1.49) | <0.001 | 1.36 (1.19–1.56) | <0.001 | 1.36 (1.19–1.56) | <0.001 |
| Congestive heart failure | 1.39 (1.28–1.52) | <0.001 | 1.42 (1.31–1.55) | <0.001 | 1.46 (1.31–1.62) | <0.001 | 1.44 (1.29–1.61) | <0.001 |
| Stroke | 1.34 (1.25–1.43) | <0.001 | 1.35 (1.26–1.45) | <0.001 | 1.40 (1.28–1.52) | <0.001 | 1.39 (1.27–1.52) | <0.001 |
| Ischemic stroke | 1.37 (1.27–1.49) | <0.001 | 1.39 (1.28–1.51) | <0.001 | 1.46 (1.31–1.62) | <0.001 | 1.45 (1.31–1.61) | <0.001 |
| Hemorrhagic stroke | 1.18 (1.04–1.33) | 0.011 | 1.19 (1.05–1.35) | 0.005 | 1.23 (1.06–1.43) | 0.008 | 1.22 (1.05–1.42) | 0.009 |
| PM2.5–10, per 1 μg/m3 | ||||||||
| Composite cardiovascular events | 2.01 (1.97–2.04) | <0.001 | 1.76 (1.74–1.79) | <0.001 | 1.90 (1.85–1.95) | <0.001 | 1.91 (1.86–1.96) | <0.001 |
| All‐cause death | 1.99 (1.96–2.03) | <0.001 | 1.67 (1.65–1.70) | <0.001 | 1.69 (1.65–1.74) | <0.001 | 1.68 (1.64–1.73) | <0.001 |
| Cardiovascular death | 1.98 (1.89–2.08) | <0.001 | 1.62 (1.56–1.69) | <0.001 | 1.64 (1.54–1.76) | <0.001 | 1.63 (1.53–1.75) | <0.001 |
| Acute myocardial infarction | 2.44 (2.33–2.55) | <0.001 | 2.16 (2.07–2.25) | <0.001 | 2.13 (2.01–2.25) | <0.001 | 2.14 (2.02–2.27) | <0.001 |
| Congestive heart failure | 1.39 (1.28–1.52) | <0.001 | 1.42 (1.31–1.55) | <0.001 | 1.46 (1.31–1.62) | <0.001 | 1.44 (1.29–1.61) | <0.001 |
| Stroke | 2.11 (2.07–2.16) | <0.001 | 1.85 (1.81–1.88) | <0.001 | 2.00 (1.94–2.06) | <0.001 | 2.02 (1.96–2.09) | <0.001 |
| Ischemic stroke | 2.12 (2.07–2.17) | <0.001 | 1.82 (1.78–1.86) | <0.001 | 1.98 (1.92–2.06) | <0.001 | 2.01 (1.94–2.08) | <0.001 |
| Hemorrhagic stroke | 2.57 (2.43–2.72) | <0.001 | 2.39 (2.26–2.52) | <0.001 | 2.42 (2.26–2.59) | <0.001 | 2.46 (2.28–2.64) | <0.001 |
| CO, per IQR (0.25 ppm) | ||||||||
| Composite cardiovascular events | 1.92 (1.77–2.09) | <0.001 | 1.83 (1.69–1.98) | <0.001 | 1.79 (1.62–1.98) | <0.001 | 1.79 (1.61–1.99) | <0.001 |
| All‐cause death | 1.95 (1.79–2.12) | <0.001 | 1.83 (1.68–1.99) | <0.001 | 1.75 (1.54–1.97) | <0.001 | 1.72 (1.52–1.94) | <0.001 |
| Cardiovascular death | 2.51 (2.02–3.13) | <0.001 | 2.28 (1.84–2.81) | <0.001 | 3.07 (2.20–4.29) | <0.001 | 2.96 (2.12–4.14) | <0.001 |
| Acute myocardial infarction | 2.47 (2.06–2.97) | <0.001 | 2.32 (1.95–2.76) | <0.001 | 2.13 (1.73–2.61) | <0.001 | 2.12 (1.72–2.61) | <0.001 |
| Congestive heart failure | 1.88 (1.64–2.16) | <0.001 | 1.81 (1.58–2.08) | <0.001 | 1.84 (1.55–2.19) | <0.001 | 1.86 (1.56–2.21) | <0.001 |
| Stroke | 2.08 (1.86–2.33) | <0.001 | 1.99 (1.78–2.23) | <0.001 | 1.98 (1.72–2.28) | <0.001 | 2.00 (1.73–2.30) | <0.001 |
| Ischemic stroke | 2.06 (1.81–2.36) | <0.001 | 1.97 (1.73–2.24) | <0.001 | 1.88 (1.60–2.22) | <0.001 | 1.91 (1.62–2.25) | <0.001 |
| Hemorrhagic stroke | 2.04 (1.66–2.50) | <0.001 | 1.99 (1.62–2.43) | <0.001 | 2.22 (1.73–2.86) | <0.001 | 2.22 (1.73–2.87) | <0.001 |
| SO2, per IQR (2.54 ppb) | ||||||||
| Composite cardiovascular events | 2.06 (1.93–2.20) | <0.001 | 1.97 (1.84–2.10) | <0.001 | 1.99 (1.83–2.17) | <0.001 | 1.94 (1.78–2.11) | <0.001 |
| All‐cause death | 1.97 (1.83–2.11) | <0.001 | 1.84 (1.72–1.97) | <0.001 | 1.73 (1.56–1.93) | <0.001 | 1.73 (1.55–1.92) | <0.001 |
| Cardiovascular death | 2.02 (1.69–2.41) | <0.001 | 1.83 (1.55–2.17) | <0.001 | 1.48 (1.13–1.93) | 0.004 | 1.50 (1.14–1.96) | 0.00316 |
| Acute myocardial infarction | 1.81 (1.55–2.11) | <0.001 | 1.75 (1.51–2.04) | <0.001 | 1.83 (1.52–2.20) | <0.001 | 1.82 (1.52–2.19) | <0.001 |
| Congestive heart failure | 2.02 (1.80–2.26) | <0.001 | 1.95 (1.74–2.18) | <0.001 | 2.00 (1.73–2.31) | <0.001 | 2.00 (1.73–2.32) | <0.001 |
| Stroke | 2.25 (2.05–2.48) | <0.001 | 2.17 (1.97–2.38) | <0.001 | 2.25 (2.00–2.53) | <0.001 | 2.25 (2.00–2.54) | <0.001 |
| Ischemic stroke | 2.31 (2.07–2.58) | <0.001 | 2.20 (1.98–2.45) | <0.001 | 2.32 (2.02–2.66) | <0.001 | 2.33 (2.02–2.68) | <0.001 |
| Hemorrhagic stroke | 2.24 (1.89–2.66) | <0.001 | 2.19 (1.86–2.60) | <0.001 | 2.13 (1.73–2.62) | <0.001 | 2.13 (1.73–2.62) | <0.001 |
| NO2, per IQR (18.4 ppb) | ||||||||
| Composite cardiovascular events | 2.17 (2.01–2.34) | <0.001 | 2.06 (1.91–2.22) | <0.001 | 2.30 (2.08–2.55) | <0.001 | 2.30 (2.08–2.55) | <0.001 |
| All‐cause death | 2.05 (1.89–2.22) | <0.001 | 1.91 (1.76–2.07) | <0.001 | 1.80 (1.60–2.04) | <0.001 | 1.79 (1.59–2.03) | <0.001 |
| Cardiovascular death | 2.79 (2.26–3.45) | <0.001 | 2.47 (2.01–3.03) | <0.001 | 2.70 (1.96–3.72) | <0.001 | 2.67 (1.94–3.69) | <0.001 |
| Acute myocardial infarction | 1.73 (1.45–2.06) | <0.001 | 1.68 (1.41–2.00) | <0.001 | 1.81 (1.46–2.25) | <0.001 | 1.81 (1.46–2.25) | <0.001 |
| Congestive heart failure | 2.12 (1.86–2.43) | <0.001 | 2.05 (1.79–2.33) | <0.001 | 2.40 (2.02–2.86) | <0.001 | 2.40 (2.02–2.85) | <0.001 |
| Stroke | 2.32 (2.07–2.59) | <0.001 | 2.24 (2.01–2.50) | <0.001 | 2.64 (2.29–3.05) | <0.001 | 2.65 (2.29–3.06) | <0.001 |
| Ischemic stroke | 2.48 (2.17–2.82) | <0.001 | 2.37 (2.09–2.70) | <0.001 | 2.73 (2.30–3.24) | <0.001 | 2.74 (2.31–3.24) | <0.001 |
| Hemorrhagic stroke | 2.02 (1.66–2.46) | <0.001 | 2.00 (1.64–2.43) | <0.001 | 2.43 (1.90–3.11) | <0.001 | 2.43 (1.90–3.12) | <0.001 |
| O3, per IQR (15.9 ppb) | ||||||||
| Composite cardiovascular events | 0.65 (0.62–0.68) | <0.001 | 0.67 (0.64–0.70) | <0.001 | 0.63 (0.59–0.67) | <0.001 | 0.63 (0.63–0.73) | <0.001 |
| All‐cause death | 0.66 (0.63–0.69) | <0.001 | 0.69 (0.65–0.72) | <0.001 | 0.68 (0.63–0.73) | <0.001 | 0.68 (0.63–0.73) | <0.001 |
| Cardiovascular death | 0.58 (0.52–0.66) | <0.001 | 0.62 (0.55–0.70) | <0.001 | 0.59 (0.49–0.71) | <0.001 | 0.59 (0.49–0.71) | <0.001 |
| Acute myocardial infarction | 0.73 (0.65–0.81) | <0.001 | 0.74 (0.67–0.83) | <0.001 | 0.72 (0.63–0.82) | <0.001 | 0.71 (0.63–0.82) | <0.001 |
| Congestive heart failure | 0.69 (0.63–0.74) | <0.001 | 0.70 (0.65–0.76) | <0.001 | 0.64 (0.58–0.71) | <0.001 | 0.64 (0.58–0.71) | <0.001 |
| Stroke | 0.63 (0.59–0.67) | <0.001 | 0.64 (0.60–0.69) | <0.001 | 0.60 (0.55–0.65) | <0.001 | 0.60 (0.55–0.65) | <0.001 |
| Ischemic stroke | 0.62 (0.57–0.66) | <0.001 | 0.63 (0.59–0.68) | <0.001 | 0.60 (0.54–0.66) | <0.001 | 0.60 (0.54–0.66) | <0.001 |
| Hemorrhagic stroke | 0.69 (0.62–0.78) | <0.001 | 0.70 (0.62–0.79) | <0.001 | 0.62 (0.53–0.71) | <0.001 | 0.62 (0.53–0.71) | <0.001 |
CI indicates confidence interval; CO, carbon monoxide; HR, hazard ratio; IQR, interquartile range; NO2, nitrogen dioxide: O3, ozone; PM2.5, fine particulate matter ≤2.5 μm in aerodynamic diameter; PM2.5–10 indicates fine particulate matter ≤2.5 to 10 μm in aerodynamic diameter; ppm, parts per million, 10−6; ppb, parts per billion, 10−9; SO2, sulfur dioxide.
Multivariable‐adjusted model 1 was adjusted for age, sex, socioeconomic status, hypertension, diabetes mellitus, dyslipidemia, chronic renal failure, end‐stage renal diseases, ischemic heart disease, peripheral arterial disease, chronic obstructive pulmonary disease, and malignancy.
Multivariable‐adjusted model 2 was adjusted for the variables listed above as well as body mass index, fasting blood glucose, total cholesterol, and hemoglobin. Composite cardiovascular events were a composite of cardiovascular death, acute myocardial infarction, congestive heart failure, and stroke.
Figure 3.
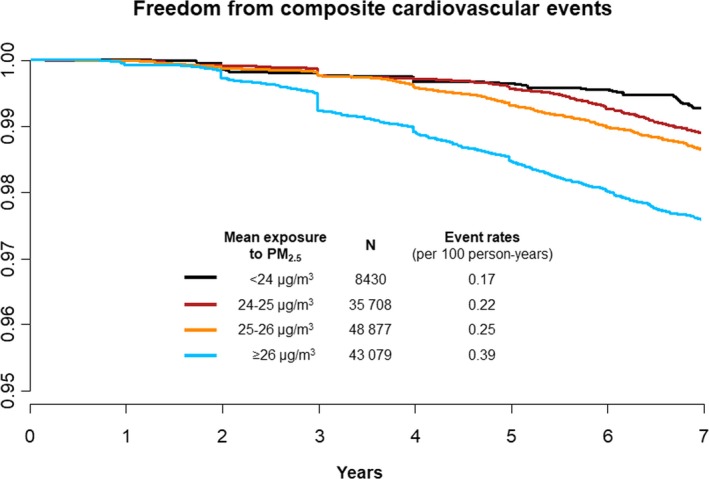
Kaplan–Meier survival curves for composite cardiovascular events in response to long‐term exposure to ambient PM 2.5. PM2.5 indicates fine particulate matter ≤2.5 μm in aerodynamic diameter.
The risks of cardiovascular mortality and stroke were sensitive to increasing ambient NO2 exposure, whereas those of cardiovascular mortality and AMI were sensitive to CO. In contrast, O3 was inversely correlated with the risks of cardiovascular events.
Multipollutant Models, Subgroup Analyses, and Population‐Attributable Risks
Two‐pollutant and multipollutant models were constructed to estimate the independent roles of various air pollutants (Figure S2). The effects of PM2.5 on cardiovascular composite outcomes were largely unchanged after adjustment for PM2.5–10, CO, SO2, NO2, or O3. In addition, the effects of other air pollutants with multipollutant models were also similar with those of single‐pollutant models.
The cardiovascular risks associated with PM2.5 exposure did not differ significantly across various subgroups (Figure 4). No significant interactions were observed with regard to sex, age, presence of cardiovascular risk factors, anemia, and malignancy.
Figure 4.
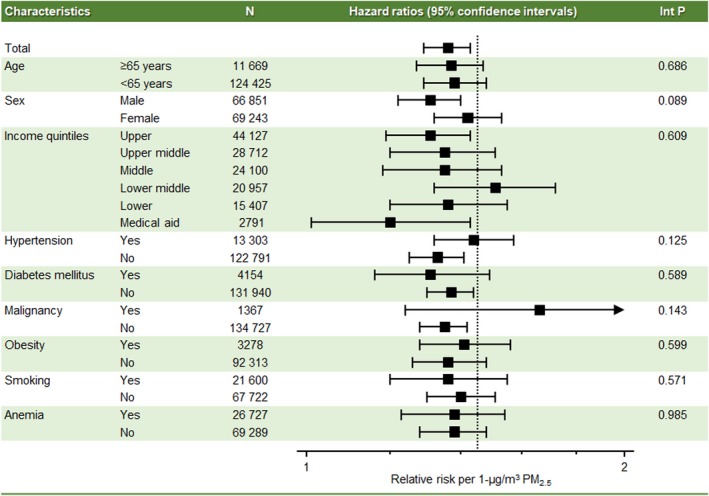
Subgroup analysis for cardiovascular risk of long‐term exposure to PM 2.5. The x‐axis represents hazard ratios with 95% confidence intervals. Int P denotes interaction P value; PM2.5 indicates fine particulate matter ≤2.5 μm in aerodynamic diameter.
Long‐term exposure to a PM2.5 concentration >25 μg/m3—the mean daily concentration in Seoul during the study period—was responsible for 30.8% of the population‐attributable risks for composite cardiovascular events (Table 3). Population‐attributable risks were 23.7% for men and 39.0% for women. The burden attributable to air pollution was comparable to or greater than those from conventional major cardiovascular risk factors such as hypertension, diabetes mellitus, dyslipidemia, and obesity.
Table 3.
Population Attributable Risk Percentages and 95% CIs Associated With Selected Cardiovascular Risk Factors for Composite Cardiovascular Outcomes
| Total | Sex | Age | |||
|---|---|---|---|---|---|
| Men | Women | <65 y | ≥65 y | ||
| PM2.5 (>25.0 μg/m3) | 30.8 (24.1–37.5) | 23.7 (16.9–30.6) | 39.0 (30.9–47.2) | 31.4 (23.5–40.3) | 30.2 (23.5–37.1) |
| Hypertension | 27.2 (24.1–30.4) | 22.3 (18.6–26.1) | 33.2 (30.1–36.3) | 16.4 (13.9–18.8) | 9.4 (2.5–16.4) |
| Diabetes mellitus | 12.1 (10.2–14.1) | 11.4 (9.2–13.7) | 13.0 (10.3–15.7) | 9.4 (7.4–11.4) | 6.9 (3.9–9.9) |
| Dyslipidemia | 10.9 (9.3–12.5) | 9.1 (5.9–12.4) | 13.0 (9.9–16.1) | 9.2 (6.9–11.6) | −1.1 (−4.7 to 2.5) |
| Obesity | 11.0 (5.9–16.0) | −0.7 (−7.0 to 5.7) | 20.1 (14.7–25.4) | 16.8 (11.7–21.9) | −4.8 (−10.9 to 1.4) |
CI indicates confidence interval; PM2.5, fine particulate matter ≤2.5 μm in aerodynamic diameter.
Discussion
We performed a large‐scale population‐based study evaluating the cardiovascular impact of long‐term exposure to air pollution. In this study, we found that long‐term exposure to high levels of air pollution was associated with increased risk of major adverse cardiovascular events as well as all‐cause deaths. Every 1‐μg/m3 increase of long‐term exposure to PM2.5 was associated with a 36% increase in cardiovascular risks including mortality, AMI, CHF, and stroke. Other pollutants such as PM2.5–10, CO, SO2, and NO2 also had an adverse impact on cardiovascular events. This study also demonstrated that the burden from air pollution was as large as that of conventional cardiovascular risk factors such as hypertension and diabetes mellitus in this study population.
Particulate matter is a mixture of solid particles and liquid droplets suspended in the air. The size of particles is directly linked to their impact on human health.16 PM2.5, also known as fine particles, has a small diameter that enables particles to reach deep into the lungs and penetrate the alveolar–capillary epithelium.17 Evidence suggests the effects are stronger for cardiovascular mortality than for other causes of mortality.17, 18, 19 Although most previous studies on the long‐term effects evaluated mortality risks, the major novel finding of this study is the association of air pollution with specific major cardiovascular diseases.
The potential biological mechanisms explaining the association between air pollution and cardiovascular diseases include systemic inflammation caused by oxidative stress, autonomic imbalance, and the possible direct actions of pollutants reaching the systemic circulation.4, 5 Acceleration of atherosclerosis and vascular inflammation in response to long‐term air pollution exposure was suggested in an animal model.20 Recently, studies from the MESA Air (Multi‐Ethnic Study of Atherosclerosis and Air Pollution) cohort have demonstrated that long‐term PM2.5 concentrations are associated with the progression of intima–media thickness on ultrasound examination and coronary calcification measured by cardiac computed tomography.21, 22 In addition, greater reductions in PM2.5 were related to slower progression of intima–medial thickness progression. In the present study, we found that the impact of air pollution is not confined to atherosclerotic cardiovascular diseases such AMI and ischemic stroke but also affects CHF and hemorrhagic stroke.
The estimated risk of air pollution shown in the present study was larger than the risk reported in previous studies from the United States and Europe.23, 24, 25, 26 There may be several explanations for this difference. First, the level of air pollution in Seoul is higher than that in Western countries. The individual weighted mean concentration of PM2.5 was 25.0 μg/m3 among the present study participants, who resided in Seoul between 2007 and 2013, whereas it is typically <15 μg/m³ in Western countries.6, 27 The impact of ambient PM2.5 may differ with varying degrees of baseline PM2.5 levels. Second, the composition and sources of the particles differ between East Asia and Western countries. Recent studies suggest that specific PM constituents play a more important role than the total mass concentration.28 This geographic region is under rapid industrialization, and a large proportion of air pollution is suggested to be associated with fossil fuel combustion.29 Third, individual PM2.5 concentrations fell within a narrow range with an interquartile range of 1.5 μg/m3. Although Seoul has a large area of 605.21 km2, it is also one of the most densely populated cities worldwide.30 Fourth, there may be ethnic differences between study populations. Finally, although we performed rigorous adjustment for baseline cardiovascular risk factors, there could be unaccounted‐for potential confounders.
This study is the first investigation performed in the Asia–Pacific region regarding the long‐term effects of air pollution. According to the Global Burden of Disease Study 2015, the mean PM2.5 is 58.4 and 28.7 μg/m³ in China and South Korea, respectively.2 A report from the Environmental Performance Index estimated that >50% of the populations of these countries are exposed to unsafe levels of fine particulate matter.31 A recent study found that ≈17% of all deaths in China are attributable to air pollution.32 This study adds to the current evidence that the cardiovascular burden of air pollution should be considered as important as conventional cardiovascular risk factors.
This study has several limitations. First, we estimated individual exposure to air pollution using the ambient concentrations measured by outdoor monitors. People who live in industrialized countries spend ≈90% of their time indoors.33 A growing body of evidence indicates that exposure to air pollution indoors also has health impacts. Second, we linked the ZIP code of each study participant's residence to the location of the monitoring stations; however, many people may spend much of their time at their workplace, which may be far from their home. Conversely, using administrative data ensures reliable information on the individual residence with freedom from recall or nonresponse bias. Third, although PM2.5 is a heterogeneous mixture of solid and liquid particles emitted from a variety of sources, we could not estimate the specific constituents and sources of the particles. Fourth, we used claims data to define covariates and outcomes. Misclassification is a potential cause of bias in population‐based studies using claims records.34
In conclusion, this study revealed that long‐term exposure to air pollution increases the risk of major cardiovascular diseases such AMI, CHF, stroke, and mortality. Air pollutants including PM2.5, PM2.5–10, CO, SO2, and NO2, but not O3, demonstrated positive relationships with cardiovascular risks, and the effects were consistent after adjusting for baseline risk factors and other pollutants. The attributable risk from air pollution was as large as that of conventional cardiovascular risk factors such as hypertension and diabetes mellitus.
Disclosures
None.
Supporting information
Table S1. Summary Statistics for Air Pollutions in Seoul, 2007–2013
Table S2. Correlation Matrix Among Air Pollutants in Seoul, 2007–2013
Table S3. Incidence of Cardiovascular Events Per 100 Person‐Years in Seoul, 2007–2013
Figure S1. The yearly trends of the average concentrations of air pollutants, 2007–2013.
Figure S2. Single‐, 2‐, and multipollutant models for cardiovascular risk of long‐term exposure to PM2.5. The y‐axis denotes the hazard ratio (box) with 95% confidence intervals (line). PM2.5 indicates fine particulate matter ≤2.5 μm in aerodynamic diameter.
(J Am Heart Assoc. 2017;6:e007170 DOI: 10.1161/JAHA.117.007170.)29118034
References
- 1. World Health Organization . Burden of disease from household air pollution for 2012. 2012.
- 2. Cohen AJ, Brauer M, Burnett R, Anderson HR, Frostad J, Estep K, Balakrishnan K, Brunekreef B, Dandona L, Dandona R, Feigin V, Freedman G, Hubbell B, Jobling A, Kan H, Knibbs L, Liu Y, Martin R, Morawska L, Pope CA III, Shin H, Straif K, Shaddick G, Thomas M, van Dingenen R, van Donkelaar A, Vos T, Murray CJ, Forouzanfar MH. Estimates and 25‐year trends of the global burden of disease attributable to ambient air pollution: an analysis of data from the Global Burden of Diseases Study 2015. Lancet. 2017;389:1907–1918. [DOI] [PMC free article] [PubMed] [Google Scholar]
- 3. Global Burden of Disease 2015 Risk Factors Collaborators . Global, regional, and national comparative risk assessment of 79 behavioural, environmental and occupational, and metabolic risks or clusters of risks, 1990–2015: a systematic analysis for the Global Burden of Disease Study 2015. Lancet. 2016;388:1659–1724. [DOI] [PMC free article] [PubMed] [Google Scholar]
- 4. Newby DE, Mannucci PM, Tell GS, Baccarelli AA, Brook RD, Donaldson K, Forastiere F, Franchini M, Franco OH, Graham I, Hoek G, Hoffmann B, Hoylaerts MF, Kunzli N, Mills N, Pekkanen J, Peters A, Piepoli MF, Rajagopalan S, Storey RF. Expert position paper on air pollution and cardiovascular disease. Eur Heart J. 2015;36:83–93b. [DOI] [PMC free article] [PubMed] [Google Scholar]
- 5. Brook RD, Rajagopalan S, Pope CA III, Brook JR, Bhatnagar A, Diez‐Roux AV, Holguin F, Hong Y, Luepker RV, Mittleman MA, Peters A, Siscovick D, Smith SC Jr, Whitsel L, Kaufman JD. Particulate matter air pollution and cardiovascular disease: an update to the scientific statement from the American Heart Association. Circulation. 2010;121:2331–2378. [DOI] [PubMed] [Google Scholar]
- 6. Di Q, Wang Y, Zanobetti A, Wang Y, Koutrakis P, Choirat C, Dominici F, Schwartz JD. Air pollution and mortality in the Medicare population. N Engl J Med. 2017;376:2513–2522. [DOI] [PMC free article] [PubMed] [Google Scholar]
- 7. Fuks KB, Weinmayr G, Basagana X, Gruzieva O, Hampel R, Oftedal B, Sorensen M, Wolf K, Aamodt G, Aasvang GM, Aguilera I, Becker T, Beelen R, Brunekreef B, Caracciolo B, Cyrys J, Elosua R, Eriksen KT, Foraster M, Fratiglioni L, Hilding A, Houthuijs D, Korek M, Kunzli N, Marrugat J, Nieuwenhuijsen M, Ostenson CG, Penell J, Pershagen G, Raaschou‐Nielsen O, Swart WJR, Peters A, Hoffmann B. Long‐term exposure to ambient air pollution and traffic noise and incident hypertension in seven cohorts of the European study of cohorts for air pollution effects (ESCAPE). Eur Heart J. 2017;38:983–990. [DOI] [PubMed] [Google Scholar]
- 8. Kang SH, Heo J, Oh IY, Kim J, Lim WH, Cho Y, Choi EK, Yi SM, Do Shin S, Kim H, Oh S. Ambient air pollution and out‐of‐hospital cardiac arrest. Int J Cardiol. 2016;203:1086–1092. [DOI] [PubMed] [Google Scholar]
- 9. Shah AS, Langrish JP, Nair H, McAllister DA, Hunter AL, Donaldson K, Newby DE, Mills NL. Global association of air pollution and heart failure: a systematic review and meta‐analysis. Lancet. 2013;382:1039–1048. [DOI] [PMC free article] [PubMed] [Google Scholar]
- 10. Bhaskaran K, Hajat S, Armstrong B, Haines A, Herrett E, Wilkinson P, Smeeth L. The effects of hourly differences in air pollution on the risk of myocardial infarction: case crossover analysis of the MINAP database. BMJ. 2011;343:d5531. [DOI] [PMC free article] [PubMed] [Google Scholar]
- 11. Lipsett MJ, Ostro BD, Reynolds P, Goldberg D, Hertz A, Jerrett M, Smith DF, Garcia C, Chang ET, Bernstein L. Long‐term exposure to air pollution and cardiorespiratory disease in the California teachers study cohort. Am J Respir Crit Care Med. 2011;184:828–835. [DOI] [PMC free article] [PubMed] [Google Scholar]
- 12. Miller KA, Siscovick DS, Sheppard L, Shepherd K, Sullivan JH, Anderson GL, Kaufman JD. Long‐term exposure to air pollution and incidence of cardiovascular events in women. N Engl J Med. 2007;356:447–458. [DOI] [PubMed] [Google Scholar]
- 13. Lee J, Lee JS, Park SH, Shin SA, Kim K. Cohort profile: the National Health Insurance Service‐National Sample Cohort (NHIS‐NSC), South Korea. Int J Epidemiol. 2016;46:e15. [DOI] [PubMed] [Google Scholar]
- 14. Park TH, Choi JC. Validation of stroke and thrombolytic therapy in Korean National Health Insurance claim data. J Clin Neurol. 2016;12:42–48. [DOI] [PMC free article] [PubMed] [Google Scholar]
- 15. Crowson CS, Therneau TM, O'Fallon WM. Attributable risk estimation in cohort studies 2009. Available at: http://www.mayo.edu/research/documents/biostat-82pdf/doc-10027843. Accessed June 22, 2017.
- 16. United States Environmental Protection Agency . Particulate matter (PM) basics. 2017.
- 17. Pope CA III, Burnett RT, Thun MJ, Calle EE, Krewski D, Ito K, Thurston GD. Lung cancer, cardiopulmonary mortality, and long‐term exposure to fine particulate air pollution. JAMA. 2002;287:1132–1141. [DOI] [PMC free article] [PubMed] [Google Scholar]
- 18. Martin LD, Krunkosky TM, Dye JA, Fischer BM, Jiang NF, Rochelle LG, Akley NJ, Dreher KL, Adler KB. The role of reactive oxygen and nitrogen species in the response of airway epithelium to particulates. Environ Health Perspect. 1997;105(suppl 5):1301–1307. [DOI] [PMC free article] [PubMed] [Google Scholar]
- 19. Dockery DW, Stone PH. Cardiovascular risks from fine particulate air pollution. N Engl J Med. 2007;356:511–513. [DOI] [PubMed] [Google Scholar]
- 20. Nemmar A, Hoylaerts MF, Nemery B. Effects of particulate air pollution on hemostasis. Clin Occup Environ Med. 2006;5:865–881. [DOI] [PubMed] [Google Scholar]
- 21. Adar SD, Sheppard L, Vedal S, Polak JF, Sampson PD, Diez Roux AV, Budoff M, Jacobs DR Jr, Barr RG, Watson K, Kaufman JD. Fine particulate air pollution and the progression of carotid intima‐medial thickness: a prospective cohort study from the Multi‐Ethnic Study of Atherosclerosis and air pollution. PLoS Med. 2013;10:e1001430. [DOI] [PMC free article] [PubMed] [Google Scholar]
- 22. Kaufman JD, Adar SD, Barr RG, Budoff M, Burke GL, Curl CL, Daviglus ML, Diez Roux AV, Gassett AJ, Jacobs DR Jr, Kronmal R, Larson TV, Navas‐Acien A, Olives C, Sampson PD, Sheppard L, Siscovick DS, Stein JH, Szpiro AA, Watson KE. Association between air pollution and coronary artery calcification within six metropolitan areas in the USA (the Multi‐Ethnic Study of Atherosclerosis and air pollution): a longitudinal cohort study. Lancet. 2016;388:696–704. [DOI] [PMC free article] [PubMed] [Google Scholar]
- 23. Krewski D, Burnett RT, Goldberg M, Hoover K, Siemiatycki J, Abrahamowicz M, White W. Reanalysis of the Harvard Six Cities Study, part I: validation and replication. Inhal Toxicol. 2005;17:335–342. [DOI] [PubMed] [Google Scholar]
- 24. Dockery DW, Pope CA III, Xu X, Spengler JD, Ware JH, Fay ME, Ferris BG Jr, Speizer FE. An association between air pollution and mortality in six U.S. cities. N Engl J Med. 1993;329:1753–1759. [DOI] [PubMed] [Google Scholar]
- 25. Beelen R, Stafoggia M, Raaschou‐Nielsen O, Andersen ZJ, Xun WW, Katsouyanni K, Dimakopoulou K, Brunekreef B, Weinmayr G, Hoffmann B, Wolf K, Samoli E, Houthuijs D, Nieuwenhuijsen M, Oudin A, Forsberg B, Olsson D, Salomaa V, Lanki T, Yli‐Tuomi T, Oftedal B, Aamodt G, Nafstad P, De Faire U, Pedersen NL, Ostenson CG, Fratiglioni L, Penell J, Korek M, Pyko A, Eriksen KT, Tjonneland A, Becker T, Eeftens M, Bots M, Meliefste K, Wang M, Bueno‐de‐Mesquita B, Sugiri D, Kramer U, Heinrich J, de Hoogh K, Key T, Peters A, Cyrys J, Concin H, Nagel G, Ineichen A, Schaffner E, Probst‐Hensch N, Dratva J, Ducret‐Stich R, Vilier A, Clavel‐Chapelon F, Stempfelet M, Grioni S, Krogh V, Tsai MY, Marcon A, Ricceri F, Sacerdote C, Galassi C, Migliore E, Ranzi A, Cesaroni G, Badaloni C, Forastiere F, Tamayo I, Amiano P, Dorronsoro M, Katsoulis M, Trichopoulou A, Vineis P, Hoek G. Long‐term exposure to air pollution and cardiovascular mortality: an analysis of 22 European cohorts. Epidemiology. 2014;25:368–378. [DOI] [PubMed] [Google Scholar]
- 26. Cesaroni G, Badaloni C, Gariazzo C, Stafoggia M, Sozzi R, Davoli M, Forastiere F. Long‐term exposure to urban air pollution and mortality in a cohort of more than a million adults in Rome. Environ Health Perspect. 2013;121:324–331. [DOI] [PMC free article] [PubMed] [Google Scholar]
- 27. The World Bank . PM2.5 air pollution, mean annual exposure (micrograms per cubic meter). 2015.
- 28. Heo J, Schauer JJ, Yi O, Paek D, Kim H, Yi SM. Fine particle air pollution and mortality: importance of specific sources and chemical species. Epidemiology. 2014;25:379–388. [DOI] [PubMed] [Google Scholar]
- 29. Elser M, Huang RJ, Wolf R, Slowik JG, Wang Q, Canonaco F, Li G, Bozzetti C, Daellenbach KR, Huang Y, Zhang R, Li Z, Cao J, Baltensperger U, El‐Haddad I, Prévôt ASH. New insights into PM2.5 chemical composition and sources in two major cities in China during extreme haze events using aerosol mass spectrometry. Atmos Chem Phys. 2016;16:3207–3225. [Google Scholar]
- 30. OECD . OECD regions at a glance 2016.
- 31. Environmental Performance Index . Global metrics for the environment: the environmental performance index ranks countries' performance on high‐priority environmental issues. 2016.
- 32. Rohde RA, Muller RA. Air pollution in China: mapping of concentrations and sources. PLoS One. 2015;10:e0135749. [DOI] [PMC free article] [PubMed] [Google Scholar]
- 33. Lunden MM, Thatcher TL, Hering SV, Brown NJ. Use of time‐ and chemically resolved particulate data to characterize the infiltration of outdoor PM2.5 into a residence in the San Joaquin Valley. Environ Sci Technol. 2003;37:4724–4732. [DOI] [PubMed] [Google Scholar]
- 34. Funk MJ, Landi SN. Misclassification in administrative claims data: quantifying the impact on treatment effect estimates. Curr Epidemiol Rep. 2014;1:175–185. [DOI] [PMC free article] [PubMed] [Google Scholar]
Associated Data
This section collects any data citations, data availability statements, or supplementary materials included in this article.
Supplementary Materials
Table S1. Summary Statistics for Air Pollutions in Seoul, 2007–2013
Table S2. Correlation Matrix Among Air Pollutants in Seoul, 2007–2013
Table S3. Incidence of Cardiovascular Events Per 100 Person‐Years in Seoul, 2007–2013
Figure S1. The yearly trends of the average concentrations of air pollutants, 2007–2013.
Figure S2. Single‐, 2‐, and multipollutant models for cardiovascular risk of long‐term exposure to PM2.5. The y‐axis denotes the hazard ratio (box) with 95% confidence intervals (line). PM2.5 indicates fine particulate matter ≤2.5 μm in aerodynamic diameter.