Abstract
Background
Activated cardiac fibroblasts (CFs), preglomerular vascular smooth muscle cells (PGVSMCs), and glomerular mesangial cells (GMCs) proliferate, cause hypertrophy, and produce collagen; in this way, activated CFs contribute to cardiac fibrosis, and activated PGVSMCs and GMCs promote renal fibrosis. In heart and kidney diseases, SDF‐1α (stromal cell‐derived factor 1α; endogenous CXCR4 [C‐X‐C motif chemokine receptor 4] receptor agonist) levels are often elevated; therefore, it is important to know whether and how the SDF‐1α/CXCR4 axis activates CFs, PGVSMCs, or GMCs.
Methods and Results
Here we investigated whether SDF‐1α activates CFs, PGVSMCs, and GMCs to proliferate, hypertrophy, or produce collagen. DPP4 (dipeptidyl peptidase 4) inactivates SDF‐1α and previous experiments show that growth‐promoting peptides have greater effects in cells from genetically‐hypertensive animals. Therefore, we performed experiments in the absence and presence of sitagliptin (DPP4 inhibitor) and in cells from normotensive Wistar–Kyoto rats and spontaneously hypertensive rats. Our studies show (1) that spontaneously hypertensive and Wistar–Kyoto rat CFs, PGVSMCs, and GMCs express CXCR4 receptors and DPP4 activity; (2) that chronic treatment with physiologically relevant concentrations of SDF‐1α causes concentration‐dependent increases in the proliferation (cell number) and hypertrophy (3H‐leucine incorporation) of and collagen production (3H‐proline incorporation) by CFs, PGVSMCs, and GMCs; (3) that sitagliptin augments these effects of SDF‐1α; (4) that interactions between SDF‐1α and sitagliptin are greater in spontaneously hypertensive rat cells; (5) that CXCR4 antagonism (AMD3100) blocks all effects of SDF‐1α; and (6) that SDF‐1α/CXCR4 signal transduction likely involves the RACK1 (receptor for activated C kinase 1)/Gβγ/PLC (phospholipase C)/PKC (protein kinase C) signaling complex.
Conclusions
The SDF‐1α/CXCR4 axis drives proliferation and hypertrophy of and collagen production by CFs, PGVSMCs, and GMCs, particularly in cells from genetically hypertensive animals and when DPP4 is inhibited.
Keywords: cardiac fibroblasts, C‐X‐C motif chemokine receptor 4, dipeptidyl peptidase 4, fibroblasts, glomerular mesangial cells, hypertension, kidney, sitagliptin, stromal cell‐derived factor
Subject Categories: Cell Signalling/Signal Transduction, Fibrosis, Hypertension, Heart Failure, Growth Factors/Cytokines
Clinical Perspective
What Is New?
The chemokine SDF‐1α (stromal cell‐derived factor 1α) stimulates the proliferation and hypertrophy of and collagen production by cardiac fibroblasts (CFs), preglomerular vascular smooth muscle cells (PGVSMCs), and glomerular mesangial cells (GMCs).
DPP4 (dipeptidyl peptidase 4) inhibition augments the effects of SDF‐1α on CFs, PGVSMCs, and GMCs.
The effects of SDF‐1α on CFs, PGVSMCs, and GMCs are enhanced in cells from genetically hypertensive animals.
A 3‐way interaction among SDF‐1α, DPP4 inhibition, and a hypertensive genetic background augments proliferation and hypertrophy of and collagen production by CFs, PGVSMCs, and GMCs.
SDF‐1α stimulation of cell proliferation involves CXCR4 (C‐X‐C motif chemokine receptor 4) receptors, which, via Gβγ, activate the PLC (phospholipase C)/PKC (protein kinase C)/Src/ERK1/2 (extracellular signal‐regulated kinases 1 and 2) and PI3K (phosphatidylinositol 3‐kinase)/AKT pathways, with convergence at the level of cyclin D1.
What Are the Clinical Implications?
SDF‐1α activates CFs, PGVSMCs, and GMCs, and this provides a scientific basis for the growing body of evidence that SDF‐1α promotes cardiac and renal fibrosis.
DPP4 inhibition and a hypertensive genetic background augment the ability of SDF‐1α to activate CFs, PGVSMCs, and GMCs; therefore, patients with high circulating or local levels of SDF‐1α who are hypertensive and being treated for diabetes mellitus with DPP4 inhibitors may have an elevated risk of cardiorenal fibrosis.
CXCR4 antagonists may prevent organ fibrosis in hypertensive or diabetic patients treated with DPP4 inhibitors.
Inhibition of RACK1 (receptor for activated C kinase 1) may protect against organ fibrosis.
DPP4 (dipeptidyl peptidase 4) inhibitors are antidiabetic drugs for treatment of type 2 diabetes mellitus. DPP4 metabolizes incretin hormones, such as gastric inhibitory peptide and glucagon‐like peptide 1, and, as a result, DPP4 inhibitors increase systemic levels of incretin hormones that augment insulin release.1 Of concern, however, is the fact that DPP4 metabolizes at least 45 known peptides,2, 3, 4 a finding that implies DPP4 inhibition augments levels of a multitude of potentially biologically active peptides, some of which may entail risks. The kidney and heart (major organs damaged by diabetes mellitus and hypertension), for example, are likely exposed to high levels of neuropeptide Y1–36 (NPY1–36) and peptide YY1–36 (PYY1–36), both of which are potent endogenous agonists of Gi‐coupled Y1 receptors (Y1Rs).5, 6 However, the biological activities of these peptides are curtailed by DPP4, which efficiently converts PYY1–36 to PYY3–36 and NPY1–36 to NPY3–36 by cleaving 2 amino acids from the N‐terminus of PYY1–36 and NPY1–36.1, 3 Although PYY1–36 and NPY1–36 are potent Y1R agonists, PYY3–36 and NPY3–36 are inactive at Y1Rs.5, 6 Consequently, it is likely that DPP4 inhibitors chronically increase Y1R activation by reducing the metabolism (inactivation) of NPY1–36 and PYY1–36.
Attenuation of the metabolism of NPY1–36 and PYY1–36 by DPP4 inhibitors may have adverse consequences. Our recently published results show that NPY1–36 and PYY1–36, but not NPY3–36 or PYY3–36, stimulate proliferation of and extracellular matrix production by cardiac fibroblasts (CFs), preglomerular vascular smooth muscle cells (PGVSMCs), and glomerular mesangial cells (GMCs).7, 8 Moreover, our results show that the effects of NPY1–36 and PYY1–36 are mediated by Y1Rs, are greater in cells from animals with genetic hypertension (spontaneously hypertensive rats [SHRs]), and are enhanced by inhibition of DPP4.7, 8 Because activation of CFs can lead to cardiac fibrosis and heart failure9 and activation of PGVSMCs and GMCs can lead to renovascular hypertrophy, glomerulosclerosis, renal fibrosis, and renal failure,10 these results indicate that we must more thoroughly investigate the effects of DPP4 inhibitors on growth responses to DPP4 peptide substrates.
To follow up on our findings with NPY1–36 and PYY1–36, we are currently investigating other DPP4 substrates that activate Gi‐coupled receptors and thus might affect proliferation of and extracellular matrix production by CFs, PGVSMCs, and GMCs when DPP4 is inhibited. In this regard, we are presently examining SDF‐1α (stromal cell‐derived factor 1α) because (1) SDF‐1α is an excellent substrate for DPP4 (ie, DPP4 removes 2 amino acids from the N‐terminus of SDF‐1α11); (2) full length SDF‐1α (consists of amino acids 1–68) is a potent agonist at CXCR4 receptors, whereas the truncated SDF‐1α (composed of amino acids 3–68) is inactive at CXCR4 receptors11; and (3) like Y1Rs, CXCR4 receptors are Gi‐coupled.12
In this article, we report the effects of SDF‐1α—in both the absence and the presence of DPP4 inhibition—on proliferation of, hypertrophy of, and collagen production by CFs, PGVSMCs, and GMCs. Our previous results demonstrate that SHR CFs, PGVSMCs, and GMCs respond more vigorously to NPY1–36 and PYY1–36 than do Wistar–Kyoto rat (WKY) cells; therefore, we examined the effects of SDF‐1α in cells isolated from both SHR and normotensive WKYs. Finally, because our results indicated that SDF‐1α robustly stimulates CFs, PGVSMCs, and GMCs, we also elucidated the receptor mediating the effects of SDF‐1α in SHR and WKY CFs, PGVSMCs, and GMCs and investigated the signal transduction system responsible for the growth effects of SDF‐1α.
Methods
Materials
Chemicals were from the following sources: SDF‐1α (ProSpec); sitagliptin (Merck); AMD3100 (R&D Systems); pertussis toxin, U73122, GF109203X, PD98059, PP1, rapamycin, and LY294002 (Sigma‐Aldrich).
Animals
Cells were isolated from adult (≈12 weeks of age) male normotensive WKYs and SHRs from Charles River Laboratories. The institutional animal care and use committee approved all procedures. The investigation conforms to the Guide for the Care and Use of Laboratory Animals published by the US National Institutes of Health (8th edition, 2011). All experiments used cells arising from multiple, different cultures.
Culture of CFs
Rat CFs were isolated, cultured, and characterized, as described recently.8
Culture of PGVSMCs
Rat PGVSMCs were isolated, cultured, and characterized, as described recently.13
Culture of GMCs
Rat GMCs were isolated, cultured, and characterized, as described previously.14
Proliferation (Cell Number) Studies
Cells were maintained in DMEM/F12 containing 10% fetal bovine serum under standard tissue culture conditions. Subconfluent cultures were growth‐arrested for 2 days in DMEM/F12 containing 0.4% bovine serum albumin. Next, cells were placed in DMEM/F12 containing a low concentration of platelet‐derived growth factor–BB (25 ng/mL) and then treated every day for 4 days without or with various treatments. Finally, cells were harvested, and cell number was quantified using a Nexcelom Cellometer Auto T4 cell counter (Nexcelom Bioscience).
Collagen Synthesis (3H‐Proline Incorporation) Studies
Cells were allowed to proliferate to confluence in DMEM/F12 supplemented with 10% fetal bovine serum under standard tissue culture conditions and then rendered quiescent in DMEM supplemented with 0.4% bovine serum albumin. To initiate collagen synthesis, confluent, growth‐arrested cells were placed in DMEM supplemented with platelet‐derived growth factor–BB (25 ng/mL) and 3H‐l‐proline (2 μCi/mL) and containing or lacking the various treatments. After 36 hours, the experiments were terminated by washing cells twice with phosphate‐buffered saline and twice with ice‐cold trichloroacetic acid (10%). The precipitate was solubilized in 0.5 mL of 0.3 N NaOH and 0.1% SDS and radioactivity determined in the precipitate using a liquid scintillation counter.
Hypertrophy (3H‐Leucine Incorporation) Studies
3H‐Leucine incorporation was determined in confluent, growth‐arrested cells using a method similar to that described for 3H‐proline incorporation; however, the cells were exposed to the various treatments for 20 hours, and then at 5 hours before termination, the cells were pulsed with 3H‐l‐leucine (2 μCi/mL).
Western Blotting
Western blotting was performed, as described previously.15 For a list of antibodies and conditions, see Table.
Table 1.
Details of the Primary Antibodies Used
| Primary Antibody (Source) | Dilution of Primary Antibody (Temperature and Duration of Incubation) |
|---|---|
| Anti‐AKT total (Abcam) | 1:1000 (4°C, 18 h) |
| Anti‐AKT phosphorylated on Thr308 (Abcam) | 1:500 (4°C, 18 h) |
| Anti–β‐actin (Sigma‐Aldrich) | 1:5000 (4°C, 18 h) |
| Anti‐CXCR4 (Abcam) | 1:100 (4°C, 18 h) |
| Anti–cyclin A (Santa Cruz Biotechnology) | 1:200 (4°C, 18 h) |
| Anti–cyclin D1 (Santa Cruz Biotechnology) | 1:200 (4°C, 18 h) |
| Anti‐ERK1/2 total (Abcam) | 1:7500 (4°C, 18 h) |
| Anti‐ERK1/2 phosphorylated on Thr202/Tyr204 (Abcam) | 1:400 (4°C, 18 h) |
| Antiretinoblastoma total (Abcam) | 1:500 (4°C, 18 h) |
| Antiretinoblastoma phosphorylated on Ser807/811 (Cell Signaling) | 1:300 (4°C, 18 h) |
| Anti‐Src phosphorylated on Tyr416 (Cell Signaling) | 1:250 (4°C, 18 h) |
| Anti‐Src phosphorylated on Tyr529 (Abcam) | 1:5000 (4°C, 18 h) |
Ser indicates serine; Thr, threonine; Tyr, tyrosine.
Real‐Time Polymerase Chain Reaction
Real‐time polymerase chain reaction for CXCR4 was performed, as described previously.15 Forward and reverse primers were 5′‐gctgaggagcatgacagaca‐3′ and 5′‐gatgaaggccaggatgagaa‐3′, respectively.
DPP4 Activity Measurements
DPP4 activity was determined in cell extracts using the BioVision DPP4 Fluorometric Assay Kit.
RACK1 Knockdown
RACK1 was knocked down in CFs using a lentivirus encoding a RACK1 29‐bp short hairpin RNA (shRNA). See Zhu et al8 for details regarding our method for generating the RACK1 shRNA‐encoding lentivirus and transducing CFs with this construct.
3′,5′‐cAMP Measurements
3′,5′‐cAMP was measured using ultraperformance liquid chromatography–tandem mass spectrometry, as described recently.16
Statistical Analyses
Values are presented as mean±SEM. Statistical analysis was performed using appropriate models of ANOVA, followed by the Fisher least significant difference test if the overall effects or interactions in the ANOVA were significant. P<0.05 was considered statistically significant.
Results
Expression of CXCR4 Receptors in CFs, PGVSMCs, and GMCs
To determine whether SHR and WKY CFs, PGVSMCs, and GMCs express CXCR4 receptors (ie, the receptor for SDF‐1α), we performed real‐time polymerase chain reaction and western blotting for CXCR4 receptor mRNA and protein, respectively. CXCR4 receptor mRNA was detectable in WKY CFs, SHR CFs, WKY PGVSMCs, SHR PGVSMCs, WKY GMCs, and SHR GMCs (threshold cycles [Ct] were 32.2±0.2, 31.8±0.2, 30.4±0.8, 31.8±0.3, 34.5±0.9, and 34.6±0.3, respectively; n=4 for each). A comparison of WKY versus SHR 2−ΔΔCt (normalizing to β‐actin mRNA) revealed a modestly but statistically significantly increased expression of CXCR4 receptor mRNA in SHR CFs (0.93±0.09 versus 1.31±0.02 in WKY versus SHR, respectively; P=0.0063; ≈41% increased CXCR4 receptor mRNA expression in SHR versus WKY CFs). However, 2−ΔΔCt calculations indicated similar expression of CXCR4 receptor mRNA in WKY versus SHR PGVSMCs and in WKY versus SHR GMCs. As shown in Figure 1, CXCR4 protein was detectable in WKY and SHR CFs, and CXCR4 receptor protein expression (normalized to β‐actin) was, like CXCR4 mRNA, modestly increased in SHR versus WKY CFs (0.42±0.06 versus 0.56±0.08 in WKY versus SHR CFs, respectively; n=3; P=0.0409; ≈33% increased CXCR4‐receptor protein expression in SHR versus WKY CFs). Four days of treatment with SDF‐1α (10 nmol/L) plus sitagliptin (1 μmol/L) significantly (P=0.0064) but modestly reduced CXCR4 receptor protein expression in both WKY and SHR CFs. In PGVSMCs and GMCs, however, CXCR4 receptor protein expression was not greater in SHR versus WKY cells and was not reduced by chronic treatment with SDF‐1α plus sitagliptin (Figure 2). Together, these data show that CFs, PGVSMCs, and GMCs express the receptor for SDF‐1α and do so both in the presence and the absence of chronic treatment with SDF‐1α plus sitagliptin. Moreover, it is unlikely that differences in CXCR4 receptor expression between SHR versus WKY cells could account for any differential responses to SDF‐1α between SHR versus WKY cells.
Figure 1.
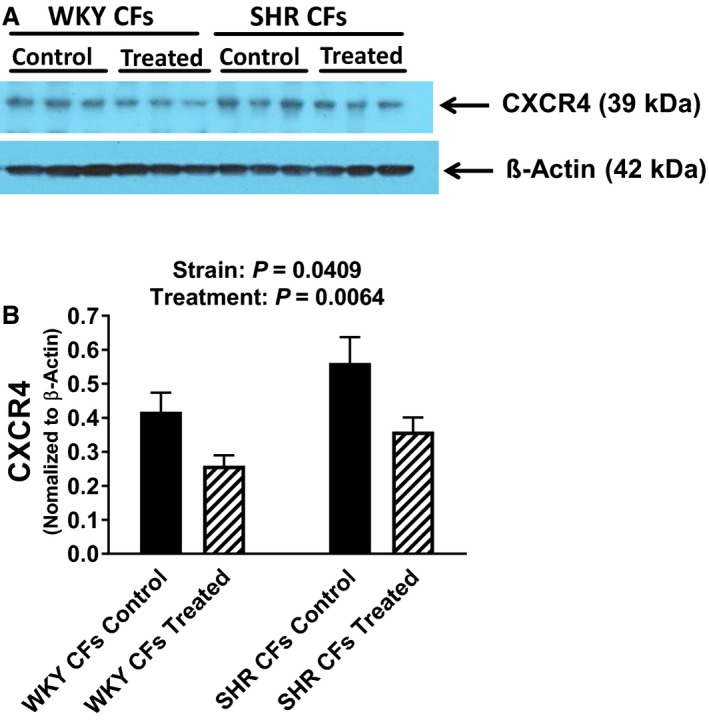
A, Western blots show that cardiac fibroblasts (CFs) from spontaneously hypertensive rats (SHR) and normotensive Wistar–Kyoto rats (WKY) express CXCR4 (C‐X‐C motif chemokine receptor 4) receptors and that the expression of CXCR4 receptors is modestly increased in SHR CFs and modestly decreased in both SHR and WKY CFs by 4 days of treatment with SDF‐1α (stromal cell‐derived factor 1α; 10 nmol/L) plus sitagliptin (1 μmol/L; treated). B, Bar graph summarizes the densitometric analysis of the bands corresponding to the CXCR4 receptor (normalized to β‐actin). Values are means and SEM.
Figure 2.
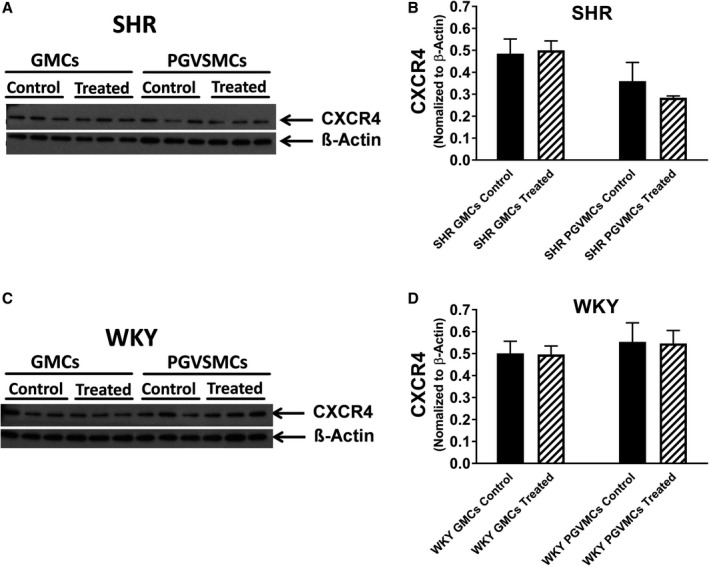
Western blots show that glomerular mesangial cells (GMCs) and preglomerular vascular smooth muscle cells (PGVSMCs) from spontaneously hypertensive rats (SHR; A) and normotensive Wistar–Kyoto rats (WKY; C) express CXCR4 (C‐X‐C motif chemokine receptor 4) receptors and that the expression of CXCR4 receptors is similar in untreated (control) vs cells treated with SDF‐1α (stromal cell‐derived factor 1α; 10 nmol/L) plus sitagliptin (1 μmol/L) for 4 days (treated). Bar graphs summarize the densitometric analysis of the bands corresponding to the CXCR4 receptor (normalized to β‐actin) for SHR (B) and WKY (D) GMCs and PGVSMCs. Values are means and SEM.
DPP4 Activity in CFs, PGVSMCs, and GMCs
Using real‐time polymerase chain reaction and western blotting, our previous work established that CFs, PGVSMCs, and GMCs express DPP4 (the enzyme that metabolizes and inactivates SDF‐1α) and that the expression of DPP4 in these cell types is similar in WKYs versus SHRs.7, 8 We also compared DPP4 activity in WKY versus SHR CFs, PGVSMCs, and GMCs. Our results confirmed that these cell types express DPP4 activity and that the activity of DPP4 is similar in WKY versus SHR cells (7.6±2.6, 2.9±0.5, 12.1±1.6, 8.5±1.7, 5.1±0.5, and 4.4±0.6 pmoles of product [7‐amino‐4‐methylcoumarin] per 30 minutes per 2 million cells in WKY CFs, SHR CFs, WKY PGVSMCs, SHR PGVSMCs, WKY GMCs and SHR GMCs, respectively; n=6 for each). Together with our previously published results, we can conclude that CFs, PGVSMCs, and GMCs express DPP4 and that DPP4 expression is similar in WKY versus SHR cells.
Effects of SDF‐1α on Proliferation, Leucine Incorporation, and Proline Incorporation in CFs, PGVSMCs, and GMCs
Figure 3 summarizes the concentration‐dependent effects of SDF‐1α on cell number (Figure 3A and 3B), 3H‐leucine incorporation (Figure 3C and 3D) and 3H‐proline incorporation (Figure 3E and 3F) in SHR and WKY CFs (top and bottom panels, respectively). SDF‐1α significantly increased all 3 measures of cell growth (in this context, growth means proliferation, hypertrophy, or collagen production) in both SHR and WKY CFs; and the effects of SDF‐1α in this regard were significantly greater in the presence of sitagliptin (ie, the P values for the sitagliptin×SDF‐1α interactions were significant for all measures of cell growth and in both strains). Moreover, the magnitude of the interaction between sitagliptin and SDF‐1α was greater in SHR versus WKY CFs (ie, the P values for the strain×sitagliptin×SDF‐1α interactions were significant for all 3 measures of cell growth). As shown in Figures 4 and 5, the observations described for CFs also apply to PGVSMCs and GMCs, with the 1 exception that in GMCs, the sitagliptin‐induced enhancement of the effects of SDF‐1α on cell number was similar in SHR versus WKY GMCs. Together these data show (1) that SDF‐1α stimulates cell proliferation, hypertrophy, and collagen production; (2) that sitagliptin enhances these effects of SDF‐1α; and (3) that the ability of sitagliptin to augment the effects of SDF‐1α on cell proliferation, hypertrophy, and collagen production is greater in SHR versus WKY cells.
Figure 3.
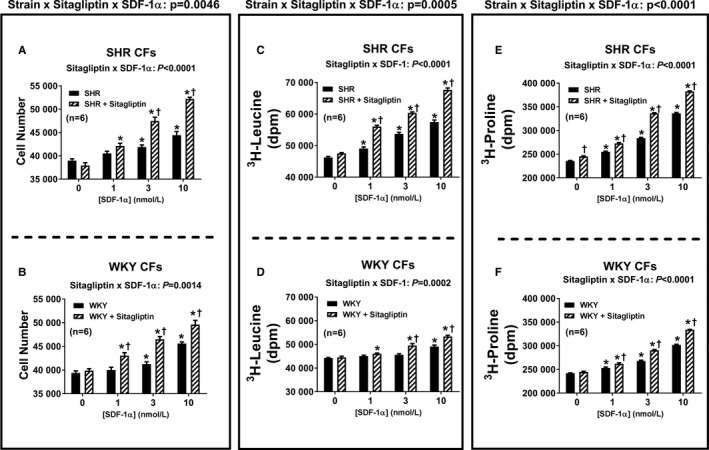
Bar graphs depict the concentration‐dependent effects of SDF‐1α (stromal cell‐derived factor 1α; 1, 3, and 10 nmol/L) on cell number (A and B), 3H‐leucine incorporation (C and D), and 3H‐proline incorporation (E and F) in cardiac fibroblasts (CFs) from spontaneously hypertensive rats (SHR; A, C, and E) and normotensive Wistar–Kyoto rats (WKY; B, D, and F) in the absence and the presence of sitagliptin (1 μmol/L). Each P value at the top of each main panel is the 3‐way interaction P value from a 3‐factor ANOVA. These P values demonstrate that the strain from which the cells were derived (SHR vs WKY) interacts with sitagliptin to determine the overall effects of SDF‐1α on cell number, 3H‐leucine incorporation, and 3H‐proline incorporation. Each P value at the top of each subpanel is the 2‐way interaction P value from a 2‐factor ANOVA. These P values demonstrate that for all 3 variables and for both SHR and WKY CFs, sitagliptin augmented responses to SDF‐1α. *Significant difference (P<0.05; Fisher least significant difference test) between the indicated concentration of SDF‐1α and the basal values (ie, values in the absence of SDF‐1α) for the indicated variable. †Significant difference (P<0.05; Fisher least significant difference test) between sitagliptin‐treated and non–sitagliptin‐treated cells at the indicated concentration of SDF‐1α. Values are means and SEM.
Figure 4.
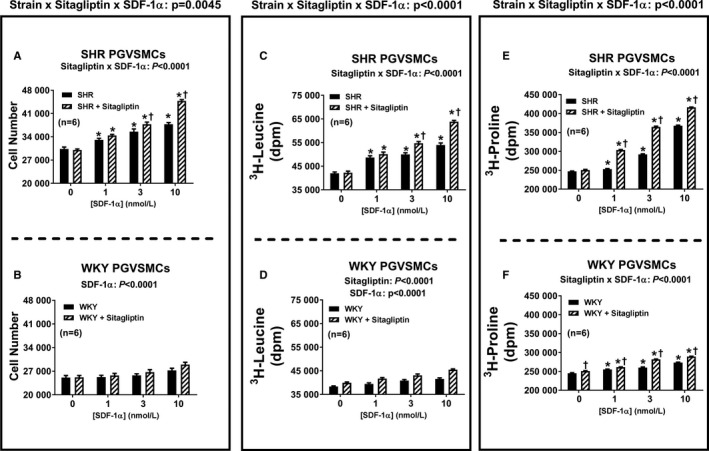
Bar graphs depict the concentration‐dependent effects of SDF‐1α (stromal cell‐derived factor 1α; 1, 3, and 10 nmol/L) on cell number (A and B), 3H‐leucine incorporation (C and D), and 3H‐proline incorporation (E and F) in preglomerular vascular smooth muscle cells (PGVSMCs) from spontaneously hypertensive rats (SHR; A, C, and E) and normotensive Wistar–Kyoto rats (WKY; B, D, and F) in the absence and the presence of sitagliptin (1 μmol/L). Each P value at the top of each main panel is the 3‐way interaction P value from a 3‐factor ANOVA. These P values demonstrate that the strain from which the cells were derived (SHR vs WKY) interacts with sitagliptin to determine the overall effects of SDF‐1α on cell number, 3H‐leucine incorporation, and 3H‐proline incorporation. The significant 2‐way interaction P values in subpanels (A, C, E, and F) demonstrate that sitagliptin augmented responses to SDF‐1α. In WKY PGVSMCs, SDF‐1α and sitagliptin modestly enhanced cell number or 3H‐leucine incorporation, but the interaction was not significant. *Significant difference (P<0.05; Fisher least significant difference test) between the indicated concentration of SDF‐1α and the basal values (ie, values in the absence of SDF‐1α) for the indicated variable. †Significant difference (P<0.05; Fisher least significant difference test) between sitagliptin‐treated and non–sitagliptin‐treated cells at indicated concentrations of SDF‐1α. Values are means and SEM.
Figure 5.
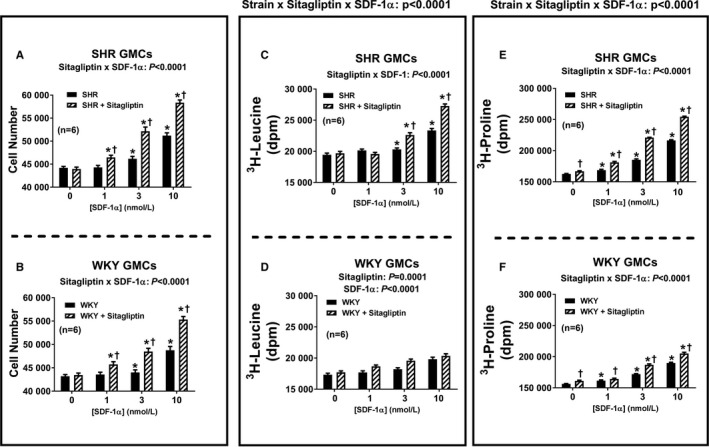
Bar graphs depict the concentration‐dependent effects of SDF‐1α (stromal cell‐derived factor 1α; 1, 3, and 10 nmol/L) on cell number (A and B), 3H‐leucine incorporation (C and D), and 3H‐proline incorporation (E and F) in glomerular mesangial cells (GMCs) from spontaneously hypertensive rats (SHR; A, C, and E) and normotensive Wistar–Kyoto rats (WKY; B, D, and F) in the absence and the presence of sitagliptin (1 μmol/L). The P values at the top of the main panels for 3H‐leucine incorporation (C and D) and 3H‐proline incorporation (E and F) are the 3‐way interaction P values from a 3‐factor ANOVA. These P values demonstrate that the strain from which the cells were derived (SHR vs WKY) interacts with sitagliptin to determine the overall effects of SDF‐1α on 3H‐leucine incorporation and 3H‐proline incorporation. For cell number, however, the strain×sitagliptin×SDF‐1α interaction was not significant. The P values at the top of subpanels (A, B, C, E, and F) are the 2‐way interaction P values from a 2‐factor ANOVA. These P values demonstrate that sitagliptin augmented responses to SDF‐1α. In WKY GMCs, SDF‐1α and sitagliptin modestly enhanced 3H‐leucine incorporation, but the interaction was not significant. *Significant difference (P<0.05; Fisher least significant difference test) between the indicated concentration of SDF‐1α and the basal values (ie, values in the absence of SDF‐1α) for the indicated variable. †Significant difference (P<0.05; Fisher least significant difference test) between sitgliptin‐treated and non‐sitagliptin‐treated cells at indicated concentration of SDF‐1α. Values are means and SEM.
Role of CXCR4 Receptors in Responses to SDF‐1α
Next, we addressed the question of whether the effects of SDF‐1α on cell proliferation, hypertrophy, and collagen production are mediated by activation of CXCR4 receptors. Figure 6 illustrates the SDF‐1α–induced change in cell number (Figure 6A and 6B), 3H‐leucine incorporation (Figure 6C and 6D), and 3H‐proline incorporation (Figure 6E and 6F) in SHR and WKY CFs (top and bottom panels, respectively) in the absence and the presence of sitagliptin and with and without AMD3100 (CXCR4 receptor antagonist). We again observed that in both SHR and WKY CFs, SDF‐1α enhanced all measures of cell growth; moreover, these effects of SDF‐1α were augmented by sitagliptin. Importantly, AMD3100 nearly abolished all effects of SDF‐1α and SDF‐1α plus sitagliptin on all measures of cell growth. As shown in Figures 7 and 8, the observations described for CFs apply also for PGVSMCs and GMCs. These data support the conclusion that CXCR4 receptors mediate the effects of SDF‐1α per se on cell proliferation, hypertrophy, and collagen production, as well as the augmentation of these effects by sitagliptin.
Figure 6.
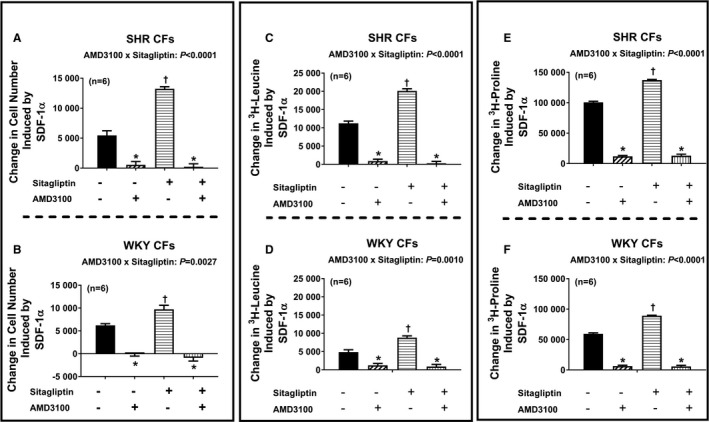
Bar graphs summarize changes (y‐axes) induced by SDF‐1α (stromal cell‐derived factor 1α; 10 nmol/L) in cell number (A and B), 3H‐leucine incorporation (C and D), and 3H‐proline incorporation (E and F) in cardiac fibroblasts (CFs) from spontaneously hypertensive rats (SHR; A, C, and E) and normotensive Wistar–Kyoto rats (WKY; B, D, and F) under 4 different conditions: (1) without sitagliptin and without AMD3100 (−/−), (2) without sitagliptin but with AMD3100 (−/+), (3) with sitagliptin but without AMD3100 (+/−), (4) both with sitagliptin and with AMD3100 (+/+). The concentrations of sitagliptin and AMD3100 were 1 and 10 μmol/L, respectively. Each P value at the top of each subpanel panel is the 2‐way interaction P value from a 2‐factor ANOVA. These P values demonstrate that for both SHR and WKY CFs, AMD3100 inhibited the response to SDF‐1α, and more so in cells cotreated with sitagliptin because in the presence of sitagliptin there was more response to inhibit. *Significant difference (P<0.05; Fisher least significant difference test) between −/− vs −/+ or between +/− vs +/+. †Significant difference (P<0.05; Fisher least significant difference test) between −/− vs +/−. Values are means and SEM.
Figure 7.
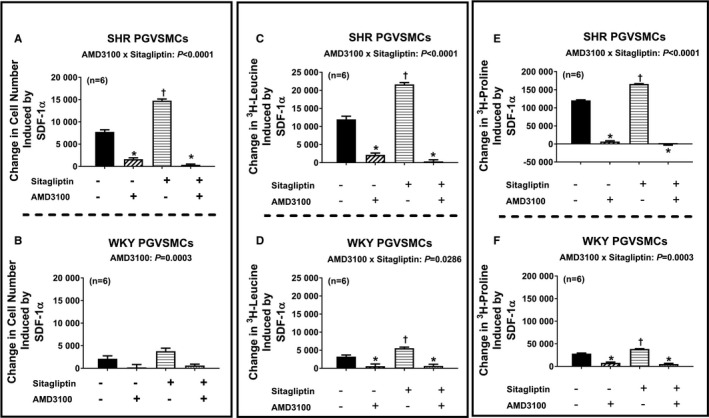
Bar graphs summarize changes (y‐axes) induced by SDF‐1α (stromal cell‐derived factor 1α; 10 nmol/L) in cell number (A and B), 3H‐leucine incorporation (C and D), and 3H‐proline incorporation (E and F) in preglomerular vascular smooth muscle cells (PGVSMCs) from spontaneously hypertensive rats (SHR; A, C, and E) and normotensive Wistar–Kyoto rats (WKY; B, D, and F) under 4 different conditions: (1) without sitagliptin and without AMD3100 (−/−), (2) without sitagliptin but with AMD3100 (−/+), (3) with sitagliptin but without AMD3100 (+/−), (4) both with sitagliptin and with AMD3100 (+/+). The concentrations of sitagliptin and AMD3100 were 1 and 10 μmol/L, respectively. The P values at the top of subpanels (A, C, D, E, and F) are the 2‐way interaction P values from a 2‐factor ANOVA. These P values demonstrate that AMD3100 inhibited the response to SDF‐1α, and more so in cells cotreated with sitagliptin because in the presence of sitagliptin there was more response to inhibit. AMD3100 also blocked the effects of SDF‐1α in subpanel B (cell number for WKY PGVSMCs) but, in this case, equally in sitagliptin vs non–sitagliptin‐treated cells. *Significant difference (P<0.05; Fisher least significant difference test) between −/− vs −/+ or between +/− vs +/+. †Significant difference (P<0.05; Fisher least significant difference test) between −/− vs +/−. Values are means and SEM.
Figure 8.
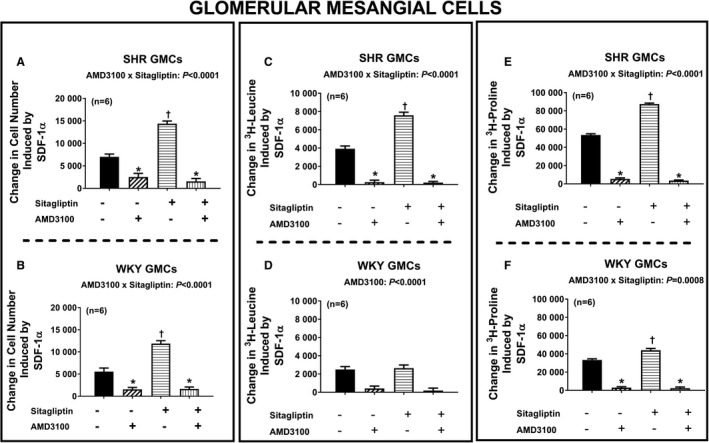
Bar graphs summarize changes (y‐axes) induced by SDF‐1α (stromal cell‐derived factor 1α; 10 nmol/L) in cell number (A and B), 3H‐leucine incorporation (C and D), and 3H‐proline incorporation (E and F) in glomerular mesangial cells (GMCs) from spontaneously hypertensive rats (SHR; A, C, and E) and normotensive Wistar–Kyoto rats (WKY; B, D, and F) under 4 different conditions: (1) without sitagliptin and without AMD3100 (−/−), (2) without sitagliptin but with AMD3100 (−/+), (3) with sitagliptin but without AMD3100 (+/−), (4) both with sitagliptin and with AMD3100 (+/+). The P values at the top of subpanels (A, B, C, E, and F) are the 2‐way interaction P values from a 2‐factor ANOVA. These P values demonstrate that AMD3100 inhibited the response to SDF‐1α, and more so in cells cotreated with sitagliptin because in the presence of sitagliptin there was more response to inhibit. AMD3100 also blocked the effects of SDF‐1α in subpanel D (3H‐leucine incorporation for WKY GMCs) but, in this case, equally in sitagliptin vs non–sitagliptin‐treated cells. *Significant difference (P<0.05; Fisher least significant difference test) between −/− vs −/+ or between +/− vs +/+. †Significant difference (P<0.05; Fisher least significant difference test) between −/− vs +/−. Values are means and SEM.
Mechanism by Which CXCR4 Receptors Activate CFs, PGVSMCs, and GMCs
Having established that SDF‐1α and SDF‐1α plus sitagliptin increase all measures of cell growth by activating CXCR4 receptors, we then turned our attention to the signaling mechanisms by which CXCR4 receptors stimulate cell growth. In this regard, we focused our studies on cell proliferation (cell number) as the primary measure of cell growth. Our previous studies show that NPY1–36 stimulates proliferation of CFs, PGVSMCs, and GMCs via Gi‐coupled Y1 receptors,7, 8 and the current study indicates that SDF‐1α augments proliferation of CFs, PGVSMCs, and GMCs via CXCR4 receptors. Because CXCR4 receptors are also Gi‐coupled,12 we began our mechanistic investigation by hypothesizing that CXCR4 receptor activation by SDF‐1α stimulates cell proliferation by a mechanism similar to that for the NPY1–36/Y1 receptor pathway. Our previous studies show that in CFs8 and PGVSMCs,15 the signaling by the NPY1–36/Y1 receptor pathway involves Gβγ, PLC (phospholipase C), and PKC (protein kinase C), and our additional experiments in PGVSMCs implicate activation of ERKs (extracellular signal‐regulated kinases), PI3K (phosphatidylinositol 3‐kinase), SFKs (Src family kinases), and mTOR (mammalian target of rapamycin).15 Moreover, we have strong evidence that RACK1 (receptor for activated C kinase 1) scaffolds the Gβγ/PLC/PKC signaling complex in CFs8 and PGVSMCs.13, 15 Consequently, our working hypothesis was that the components mentioned are involved in the SDF‐1α/CXCR4 receptor signaling pathway.
To test our working hypothesis, we examined the effects of SDF‐1α on cell number in the absence and the presence of coincubation with pertussis toxin (blocks release of Gβγ from Gi), U73122 (PLC inhibitor), GF109203X (PKC inhibitor), PD98059 (MEK/ERK pathway inhibitor), PP1 (SFK inhibitor), rapamycin (mTOR inhibitor), LY294002 (PI3K/AKT pathway inhibitor), and RACK1 shRNA (reduces RACK1 expression). To maximize the growth effects of SDF‐1α, mechanistic studies were performed in SHR CFs, and sitagliptin was coadministered with SDF‐1α. As demonstrated in Figure 9, pertussis toxin (Figure 9A), U73122 (Figure 9B), GF109203X (Figure 9C), and PD98059 (Figure 9D) abolished SDF‐1α–induced increases in cell number. Likewise, as shown in Figure 10, PP1 (Figure 10A), rapamycin (Figure 10B), LY294002 (Figure 10C), and RACK1 shRNA (Figure 10D) also abolished SDF‐1α–induced increases in cell number. Similar findings were observed in PGVSMCs (Figures 11 and 12) and GMCs (Figures 13 and 14). These data are highly consistent with our working hypothesis.
Figure 9.
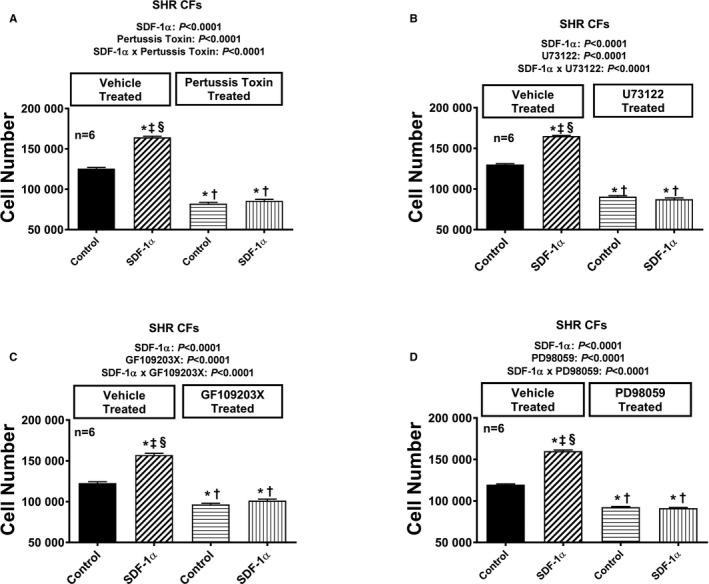
Bar graphs illustrate the effects of SDF‐1α (stromal cell‐derived factor 1α; 10 nmol/L, with added sitagliptin at 1 μmol/L to enhance the response) on cell number in the absence and the presence of pertussis toxin (A; 100 ng/mL), U73122 (B; 10 μmol/L), GF109203X (C; 10 μmol/L), and PD98059 (D; 10 μmol/L) in cardiac fibroblasts (CFs) from spontaneously hypertensive rats (SHR). Each set of P values in each panel are from a 2‐factor ANOVA (factor A, level of SDF‐1α; factor B, level of indicated inhibitor). The interaction P values show that the effects of SDF‐1α were blocked by the indicated inhibitor. *,†,‡,§Significant difference (P<0.05; Fisher least significant difference test) from first, second, third, and fourth columns, respectively. Values are means and SEM.
Figure 10.
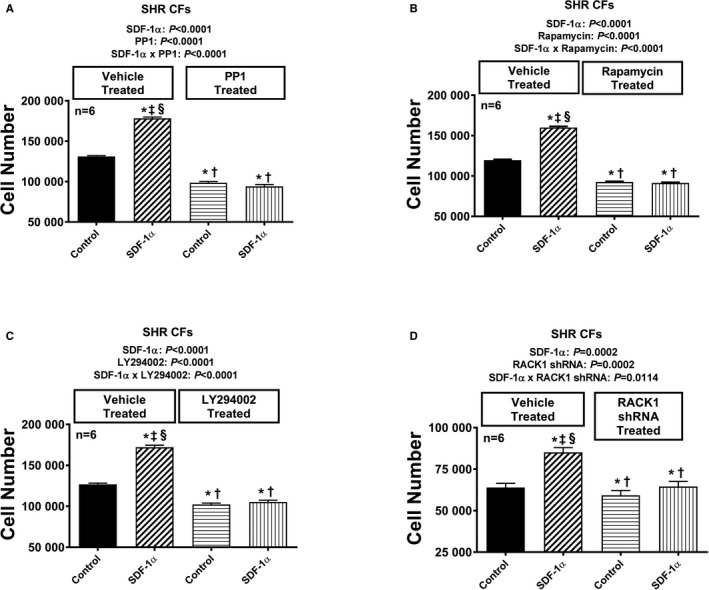
Bar graphs illustrate the effects of SDF‐1α (stromal cell‐derived factor 1α; 10 nmol/L, with added sitagliptin at 1 μmol/L to enhance the response) on cell number in the absence and the presence of PP1 (A; 100 ng/mL), rapamycin (B; 10 μmol/L), LY294002 (C; 10 μmol/L), and RACK1 short hairpin RNA (D) in cardiac fibroblasts (CFs) from spontaneously hypertensive rats (SHR). Each set of P values in each panel are from a 2‐factor ANOVA (factor A, level of SDF‐1α; factor B, level of indicated inhibitor). The interaction P values show that the effects of SDF‐1α were blocked by the indicated inhibitor. *,†,‡,§Significant difference (P<0.05; Fisher least significant difference test) from the first, second, third, and fourth columns, respectively. Values are means and SEM.
Figure 11.
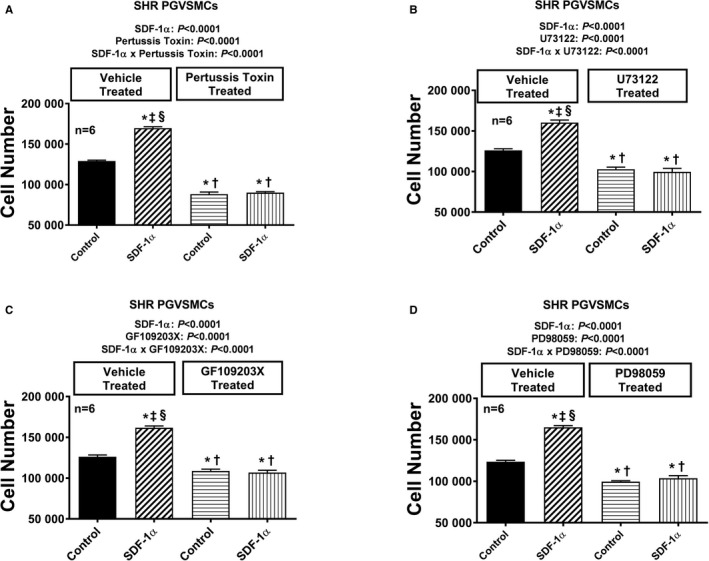
Bar graphs illustrate the effects of SDF‐1α (stromal cell‐derived factor 1α; 10 nmol/L, with added sitagliptin at 1 μmol/L to enhance the response) on cell number in the absence and the presence of pertussis toxin (A; 100 ng/mL), U73122 (B; 10 μmol/L), GF109203X (C; 10 μmol/L), and PD98059 (D; 10 μmol/L) in preglomerular vascular smooth muscle cells (PGVSMCs) from spontaneously hypertensive rats (SHR). Each set of P values in each panel are from a 2‐factor ANOVA (factor A, level of SDF‐1α; factor B, level of indicated inhibitor). The interaction P values show that the effects of SDF‐1α were blocked by the indicated inhibitor. *,†,‡,§Significant difference (P<0.05; Fisher least significant difference test) from the first, second, third, and fourth columns, respectively. Values are means and SEM.
Figure 12.
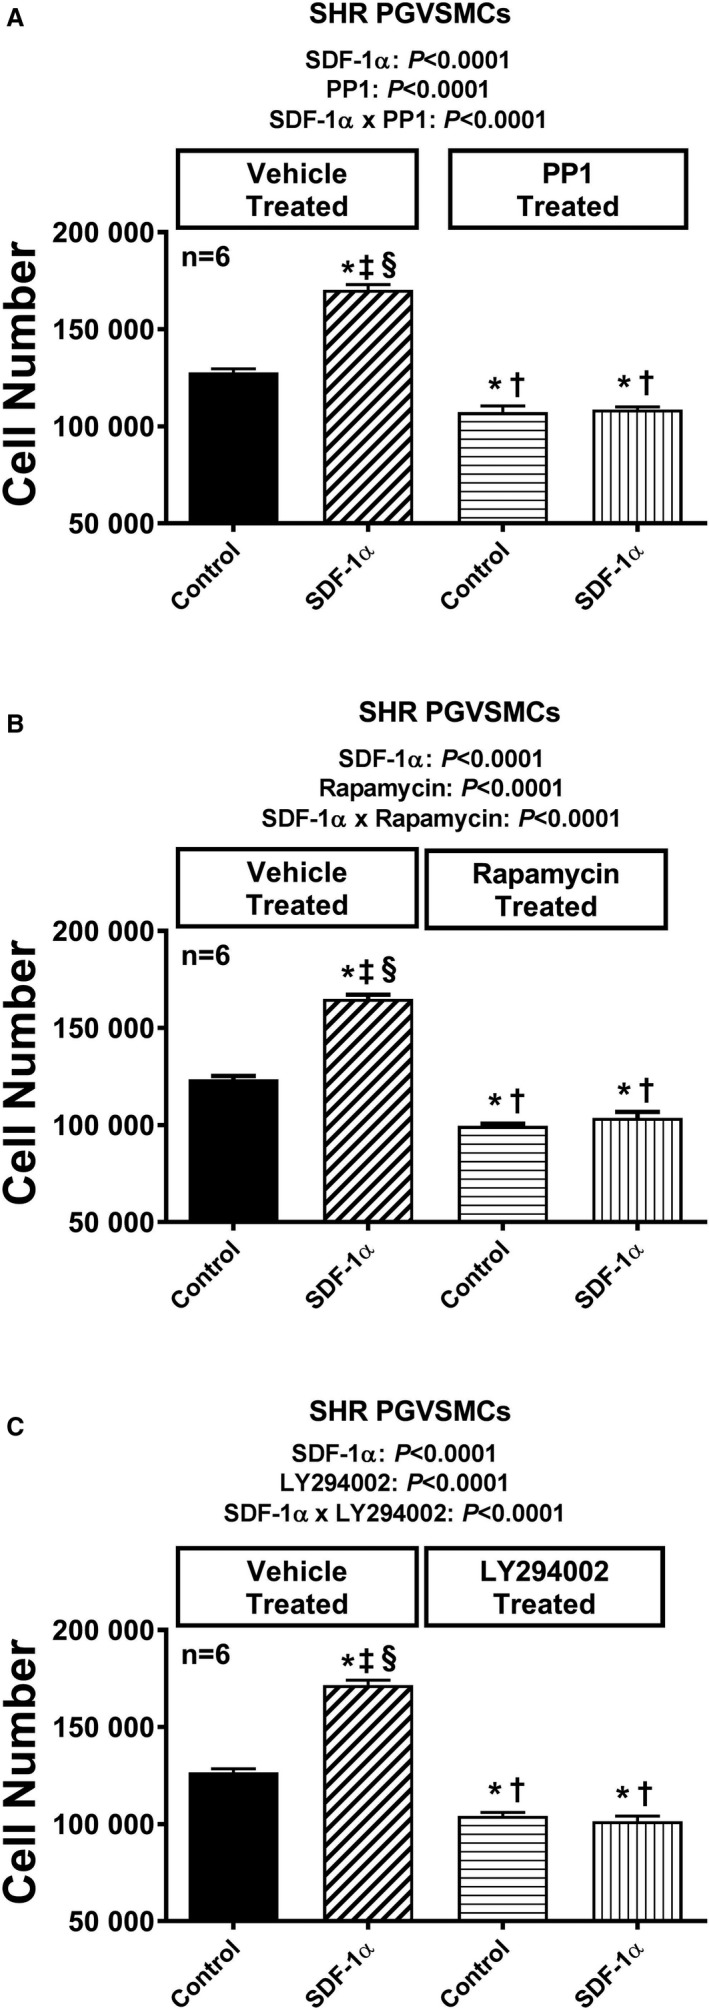
Bar graphs illustrate the effects of SDF‐1α (stromal cell‐derived factor 1α; 10 nmol/L, with added sitagliptin at 1 μmol/L to enhance the response) on cell number in the absence and the presence of PP1 (A; 100 ng/mL), rapamycin (B; 10 μmol/L), and LY294002 (C; 10 μmol/L) in preglomerular vascular smooth muscle cells (PGVSMCs) from spontaneously hypertensive rats (SHR). Each set of P values in each panel are from a 2‐factor ANOVA (factor A, level of SDF‐1α; factor B, level of indicated inhibitor). The interaction P values show that the effects of SDF‐1α were blocked by the indicated inhibitor. *,†,‡,§Significant difference (P<0.05; Fisher least significant difference test) from the first, second, third, and fourth columns, respectively. Values are means and SEM.
Figure 13.
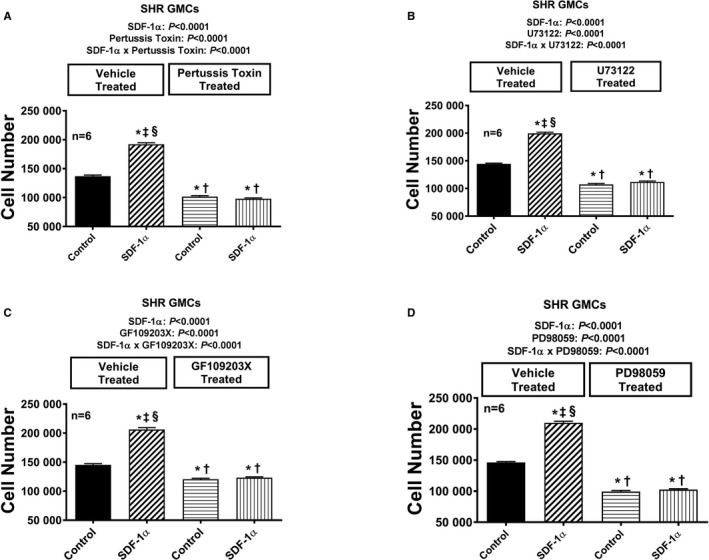
Bar graphs illustrate the effects of SDF‐1α (stromal cell‐derived factor 1α; 10 nmol/L, with added sitagliptin at 1 μmol/L to enhance the response) on cell number in the absence and the presence of pertussis toxin (A; 100 ng/mL), U73122 (B; 10 μmol/L), GF109203X (C; 10 μmol/L), and PD98059 (D; 10 μmol/L) in glomerular mesangial cells (GMCs) from spontaneously hypertensive rats (SHR). Each set of P values in each panel are from a 2‐factor ANOVA (factor A, level of SDF‐1α; factor B, level of indicated inhibitor). The interaction P values show that the effects of SDF‐1α were blocked by the indicated inhibitor. *,†,‡,§Significant difference (P<0.05; Fisher least significant difference test) from the first, second, third, and fourth columns, respectively. Values are means and SEM.
Figure 14.
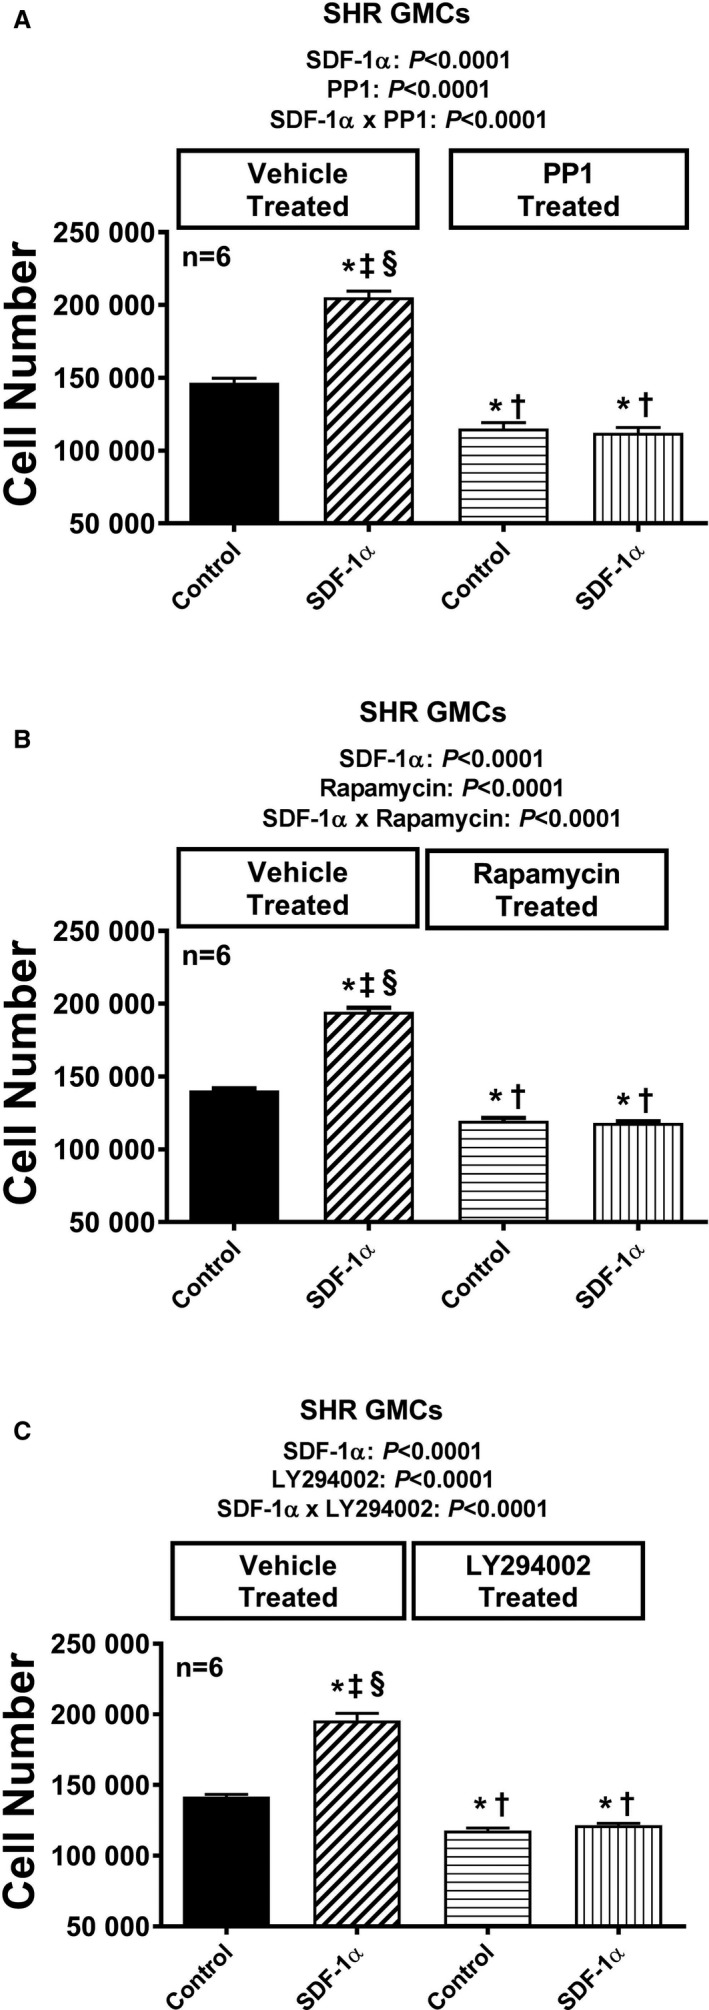
Bar graphs illustrate the effects of SDF‐1α (stromal cell‐derived factor 1α; 10 nmol/L, with added sitagliptin at 1 μmol/L to enhance the response) on cell number in the absence and presence of PP1 (A; 100 ng/mL), rapamycin (B; 10 μmol/L), and LY294002 (C; 10 μmol/L) in glomerular mesangial cells (GMCs) from spontaneously hypertensive rats (SHR). Each set of P values in each panel are from a 2‐factor ANOVA (factor A, level of SDF‐1α; factor B, level of indicated inhibitor). The interaction P values show that the effects of SDF‐1α were blocked by the indicated inhibitor. *,†,‡,§Significant difference (P<0.05; Fisher least significant difference test) from the first, second, third, and fourth columns, respectively. Values are means and SEM.
Our pharmacological experiments indicated a role for ERK, AKT, and SFK in the CXCR4 signaling pathway, leading to enhanced cell proliferation. To further challenge our working hypothesis, we examined the effects of SDF‐1α plus sitagliptin in SHR CFs on the expression of activated ERK (phosphorylated on threonine 202/tyrosine 204), activated Src (phosphorylated on Try416), and activated AKT (phosphorylated on threonine 308). We also probed for the expression of retinoblastoma protein phosphorylated on the critical serine 807/811 inhibitory sites and for the expression of key cell cycle–regulating proteins cyclin D1 and cyclin A. As shown in Figure 15, SDF‐1α plus sitagliptin increased phosphorylated ERK (normalized to total ERK; Figure 15A), phosphorylated AKT (normalized to total AKT; Figure 15B), phosphorylated Src416 (normalized to the inhibitory form, p‐scr529; Figure 15C), phosphorylated retinoblastoma (normalized to total retinoblastoma; Figure 15D), cyclin D1 (normalized to β‐actin; Figure 15E), and cyclin A (normalized to β‐actin; Figure 15F). Actual western blots are shown in Figure 16. Because CXCR4 is coupled to Gi, and Gα‐i inhibits adenylyl cyclase, we also measured intracellular amounts of 3′,5′‐cAMP in SHR CFs treated with SDF‐1α plus sitagliptin for 4, 8, 24, and 48 hours. As shown in Figure 17, there was no evidence that CXCR4 signaling inhibits the adenylyl cyclase/3′,5′‐cAMP pathway in CFs. Taken together, these signal transduction experiments, viewed in the light of our previous studies with the NPY1–36/Y1 receptor pathway, support the signaling network illustrated in Figure 18.
Figure 15.
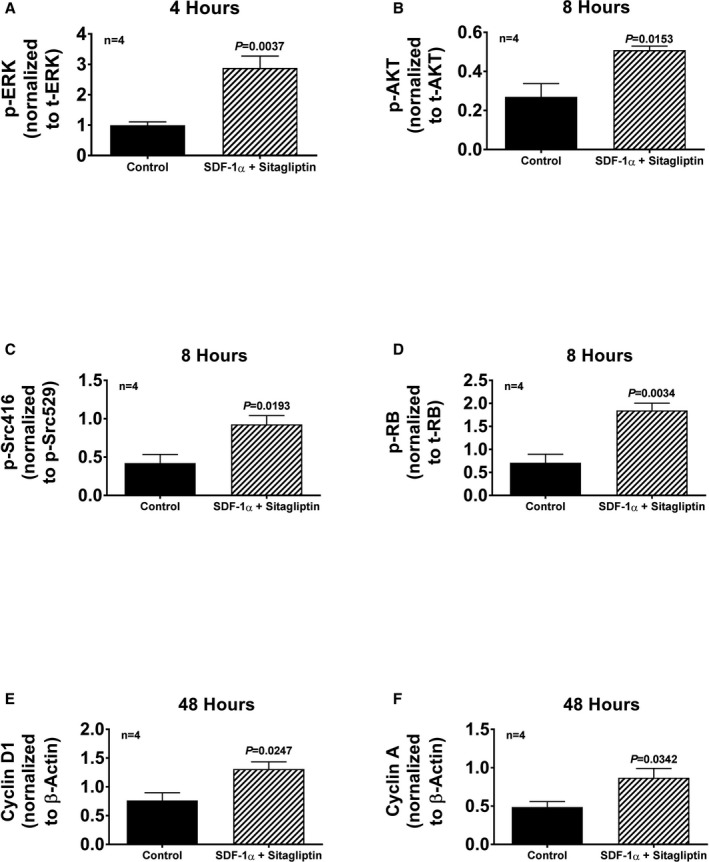
Cardiac fibroblasts (CFs) from spontaneously hypertensive rats (SHR) were treated either without or with SDF‐1α (stromal cell‐derived factor 1α; 10 nmol/L, with added sitagliptin at 1 μmol/L to enhance the response), and cells were harvested at the indicated times and proteins extracted and analyzed by western blotting. The bar graphs summarize densitometric analysis of the bands corresponding to the protein of interest: (A) ERK phosphorylated on threonine 202/tyrosine 204 (p‐ERK) normalized to total ERK (t‐ERK); (B) AKT phosphorylated on threonine 308 (p‐AKT) normalized to total AKT (t‐AKT); (C) Src phosphorylated on tyrosine 416 (p‐Scr416) normalized to Src phosphorylated on tyrosine 529 (p‐Src529); (D) retinoblastoma protein phosphorylated on serine 807/serine 811 (p‐RB) normalized to total retinoblastoma (t‐RB); (E) cyclin D1 normalized to β‐actin; (F) cyclin A normalized to β‐actin. Images of the actual western blots are provided in Figure 16. The P values (unpaired Student t test) indicate that SDF‐1α (stromal cell‐derived factor 1α; plus sitagliptin) increased the expression of each of the signal transduction proteins. Values are means and SEM.
Figure 16.
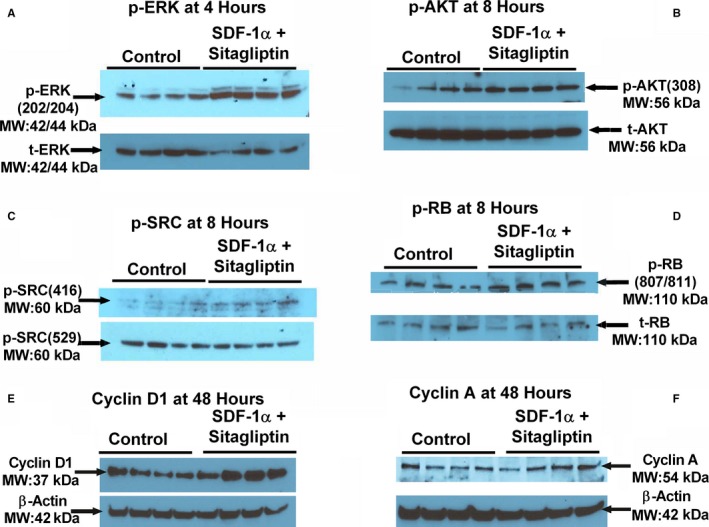
Western blots showing the expression of (A) ERK phosphorylated on threonine 202/tyrosine 204 (p‐ERK[202/204]) normalized to total ERK (t‐ERK); (B) AKT phosphorylated on threonine 308 (p‐AKT[308]) normalized to total AKT (t‐AKT); (C) Src phosphorylated on tyrosine 416 (p‐Scr[416]) normalized to Src phosphorylated on tyrosine 529 (p‐Src[529]); (D) retinoblastoma protein phosphorylated on serine 807/serine 811 (p‐RB[807/811]) normalized to total RB (t‐RB); (E) cyclin D1 normalized to β‐actin; (F) cyclin A normalized to β‐actin.
Figure 17.
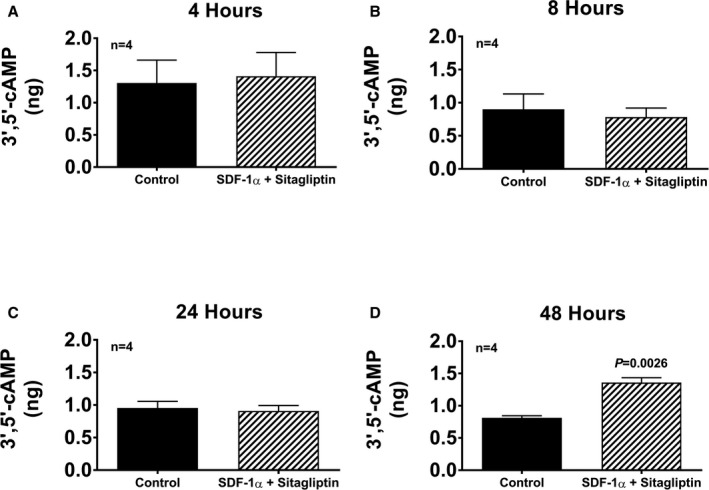
Bar graphs show intracellular levels of 3′,5′‐cAMP in cardiac fibroblasts (CFs) from spontaneously hypertensive rats treated for 4, 8, 24, and 48 h (A through D, respectively) with SDF‐1α (stromal cell‐derived factor 1α; 10 nmol/L) plus sitagliptin at (1 μmol/L). Values are means and SEM.
Figure 18.
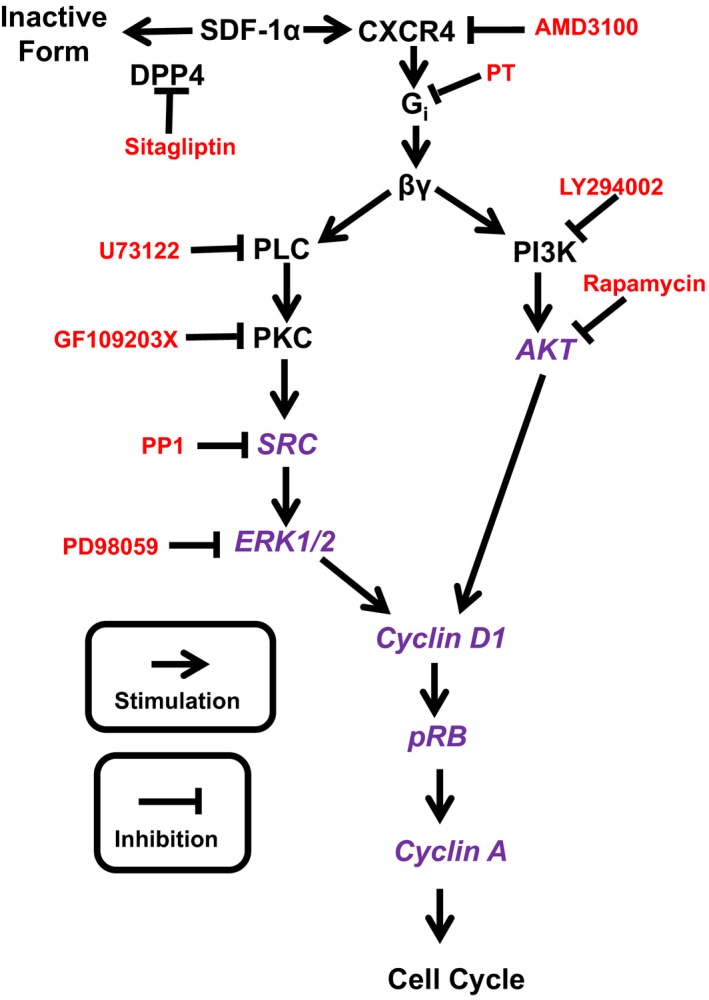
Working hypothesis regarding the mechanism by which SDF‐1α (stromal cell‐derived factor 1α) stimulates cell proliferation. Schematic also shows site of action of inhibitors used to disrupt the pathway. Not shown is the role of RACK1 to scaffold βγ, PLC, PKC, Src, and ERK1/2, as well as βγ, PI3K and AKT, into signaling complexes. DPP4 indicates dipeptidyl peptidase 4; ERK1/2, extracellular signal regulated kinases 1 and 2; PI3K, phosphatidylinositol‐4,5‐bisphosphate 3‐kinase; PKC, protein kinase C; PLC, phospholipase C; p‐RB, phosphorylated retinoblastoma protein; PT, pertussis toxin; RACK1, receptor for activated C kinase 1. Inhibitors are indicated in red, and signal transduction components probed by western blotting are shown in purple.
Discussion
The present study demonstrates that CFs, PGVSMCs, and GMCs express CXCR4 receptors and that stimulation of these receptors with the endogenous agonist SDF‐1α increases 3 measures of cellular activation, namely, cellular proliferation, hypertrophy, and collagen production. The conclusion that SDF‐1α stimulates cell growth is further supported by our mechanistic experiments showing that this cytokine activates robust progrowth pathways in CFs, PGVSMCs, and GMCs. Our findings are consistent with the report by Jie et al17 that glucose stimulates the proliferation of aortic vascular smooth muscle cells via the SDF‐1α/CXCR4 receptor axis, with the studies by Pan et al18 showing enhanced proliferation and migration of A10 cells by activation of the SDF‐1α/CXCR4 receptor axis, and with the studies by Shao et al19 showing that antagonism of CXCR4 receptors reduces collagen formation by and migration of bone marrow stem cells that had been previously induced (by treatment with TGF‐β [transforming growth factor β]) to differentiate into myofibroblasts. The present results, however, are unique in that they illustrate the potent and efficacious effects of SDF‐1α on cells directly involved in cardiac fibrosis (ie, CFs) and in cells directly involved in renal fibrosis (PGVSMCs and GMCs). Thus the results of the present study raise the possibility that the SDF‐1α/CXCR4 receptor axis contributes to cardiac and renal fibrosis by activating CFs, PGVSMCs, or GMCs.
Is there evidence that the effects of the SDF‐1α/CXCR4 receptor axis on CFs, PGVSMCs, and GMCs observed in the present study may translate to increased cardiac and renal fibrosis in vivo? Although there is evidence that knockdown of CXCR4 receptors specifically in cardiomyoctes reduces cardiac fibrosis,20 studies by Chu et al demonstrated that, in mice, antagonism of CXCR4 receptors reduces cardiorenal fibrosis in mineralocorticoid‐induced hypertension21 and cardiac fibrosis in type 1 and 2 diabetes mellitus.22 Moreover, experiments by Zuk et al23 showed that blockade of CXCR4 receptors decreases renal fibrosis due to kidney injury. In addition, Yuan et al24 reported that CXCR4 receptor expression is increased in ureteral obstruction and that CXCR4 receptor knockout prevents hydronephrosis‐induced renal fibrosis. Kazakov and coworkers found that endothelial nitric oxide synthase inhibition induces cardiac fibrosis via the SDF‐1α/CXCR4 receptor axis.25 Shao et al19 noted that in SHR with cardiac fibrosis, SDF‐1α levels in the serum and myocardium are elevated. Studies by Sayyed et al26 demonstrated that in a mouse model of type 2 diabetes mellitus, inhibition of SDF‐1α reduces glomerulosclerosis, increases podocytes number, prevents albuminuria, and preserves the peritubular vasculature. Studies by Schober et al27 and Zernecke et al28 show that the SDF‐1α/CXCR4 receptor axis augments neointimal hyperplasia in injured coronary arteries. Importantly, in patients, circulating SDF‐1α is associated with heart failure29 and all‐cause mortality,30 and in patients with myocarditis, myocardial levels of SDF‐1α are associated with cardiac fibrosis and are the strongest predictor of mortality.31 The growing body of evidence that the SDF‐1α/CXCR4 receptor axis contributes to organ fibrosis underscores the significance of the findings reported in this article.
The current findings also demonstrate that blocking DPP4 augments the progrowth effects of SDF‐1α on CFs, PGVSMCs, and GMCs. Likely, the augmentation by sitagliptin of the effects of SDF‐1α on CFs, PGVSMCs, and GMCs relates to the ability of DPP4 to metabolize, and thus inactivate, SDF‐1α. This conclusion is based on the premises that sitagliptin is a potent DPP4 inhibitor,32 SDF‐1α is an excellent substrate for DPP4,11 and SDF‐1α per se is a potent agonist at CXCR4 receptors, whereas the DPP4 cleavage product of SDF‐1α is not.11 The significance of the interaction—revealed in the present study—between SDF‐1α and DPP4 inhibition is underscored by the increasing awareness that DPP4 inhibitors increase the risk of heart failure (for review, see Jackson33), which possibility could be due to accumulation of SDF‐1α, leading to cardiac fibrosis in selected patients.
The efficacy of SDF‐1α to stimulate CF, PGVSMC, and GMC proliferation, hypertrophy, and collagen production is particularly high in cells derived from genetically hypertensive animals. Moreover, our results clearly delineate a synergistic interaction between DPP4 inhibition and the genetic background of the CFs, PGVSMCs, and GMCs with regard to the ability of SDF‐1α to stimulate cellular proliferation, hypertrophy, and collagen production. In other words, there is a 3‐way interaction among SDF‐1α, DPP4 inhibition, and cellular genetic background on proliferation, hypertrophy, and collagen production by CFs, PGVSMCs, and GMCs. The clinical implication of these observations is that patients with high circulating or local levels of SDF‐1α who have a genetic predisposition for hypertension and who are being treated with DPP4 inhibitors for diabetes mellitus would be at greatest risk for SDF‐1α/CXCR4 receptor axis–induced organ fibrosis. The corollary of this hypothesis is that CXCR4 antagonists may be particularly useful with regard to preventing organ fibrosis in such patients.
As recently reviewed,34, 35 evidence shows that in animal models, DPP4 inhibitors have antifibrotic effects in the heart and kidneys. As recently reviewed by Fadini et al,36 however, the reality is that the putative cardiorenal protective effects of DPP4 inhibitors detected in some preclinical models have not been borne out in large randomized clinical trials, observational studies, or meta‐analyses. In fact, the results have been just the opposite of those predicted by in vivo animal studies, namely, that in humans, DPP4 inhibitors may increase the risk of heart failure and renal dysfunction.33 Indeed, the US Food and Drug Administration (FDA) issued a safety warning of the increased risk of heart failure for both saxagliptin and alogliptin, and the FDA Endocrinology and Metabolic Drugs Advisory Committee concluded that alogliptin increases the risk of hospitalization for heart failure by 6 patients per 1000. As reviewed by Jackson,33 the disconnect between animal studies versus human outcomes with regard to the protective versus harmful effects of DPP4 inhibitors likely is due to the context‐dependent effects of DPP4 inhibitors that, in turn, are the result of the fact that DPP4 inhibitors modify the levels of a large number of biologically active polypeptides. In the present in vitro study, we controlled the “context” of the cells so as to reveal the effects of SDF‐1α in DPP4‐treated cells from normotensive and hypertensive animals.
Why are cells from SHRs more susceptible to the growth‐enhancing effects of the SDF‐1α/CXCR4 receptor axis? It is unlikely that the difference between SHR and WKY cells in this regard is related to CXCR4 receptor expression or to the activity of DPP4. As described in this report, CXCR4 receptor expression and DPP4 activity are comparable in SHR versus WKY cells. A limitation of this conclusion is that a type II statistical error may have masked a significant difference between SHR versus WKY cells. However, because the numerical differences in CXCR4 receptor expression and DPP4 activity in SHR versus WKY cells were minor, even if these differences were real, this would not explain why SHR cells are more susceptible to the growth‐enhancing effects of the SDF‐1α/CXCR4 receptor axis. The implication, therefore, is that the greater responsiveness of SHR cells must be because the mechanism of action by which the SDF‐1α/CXCR4 receptor axis activates cells is in some way enhanced in SHR cells.
What is the mechanism of action by which the SDF‐1α/CXCR4 receptor axis activates cells? We addressed this question in some detail in the present study. Based on our previous findings regarding the mechanism by which Gi‐coupled Y1 receptors stimulate the proliferation of PGVSMCs15 and CFs,8 in the current project, we adopted the working hypothesis that release of Gβγ via Gi‐coupled CXCR4 receptors activates both the PLC/PKC/Src/ERK1/2 pathway and the PI3K/AKT pathway, with convergence at the level of cyclin D1 (Figure 18). Indeed, the current findings that inhibition of CXCR4, Gβγ, PLC, PKC, Src, ERK1/2, PI3K, or AKT blocks the proliferative effects of SDF‐1α in CFs are consistent with this theory. Further corroboration is provided by the observations that SDF‐1α increases phosphorylation of Src, ERK1/2, AKT, and retinoblastoma, and increases the expression of cyclin D1 and cyclin A. Consequently, although some of the inhibitors may have off‐target effects, we have confidence in our proposed pathway for 4 reasons. First, the types of inhibitors and concentrations of inhibitors used in this study have been used by numerous investigators. Second, a total of 8 different pharmacological inhibitors were used to define an interlocking pathway; therefore, the positive results with all 8 pharmacological inhibitors reinforce the robustness of the conclusion drawn from any one of the inhibitors. Third, the use of RACK1 shRNA also provides confidence in the conclusion that the proposed pathway is valid because RACK1 is known to scaffold the proposed pathway. Fourth, the proposed pathway is further corroborated by changes in expression/activation (by western blotting) of most of the components of the proposed pathway.
Returning to the question of how the signaling scheme outlined in Figure 18 explains the enhanced responsiveness of SHR cells to SDF‐1α, we again refer back to our previous findings8, 15 demonstrating that Gi‐coupled Y1 receptors stimulate proliferation of SHR CFs and SHR PGVSMCs more than WKY CFs and WKY PGVSMCs. In this regard, we discovered that the greater effect of Y1‐receptor activation in SHR cells is associated with an increased abundance of the scaffolding protein RACK1 in the membrane of SHR CFs and SHR PGVSMCs.8, 15 Moreover, knockdown of RACK1 attenuates the efficacy of Y1‐receptor activation to simulate growth of SHR CFs and SHR PGVSMCs.8, 15 Our most recent findings demonstrate that the underlying cause of the increased membrane localization of RACK1 in SHR PGVSMCs is an enlarged pool of Gβγ and PLCβ3 already present there13; this expanded pool of Gβγ and PLCβ3 binds and localizes RACK1 to the membrane. RACK1 scaffolds a large set of binding partners that includes Gβγ, PLCβ3, PKC, Src, ERK1/2, PI3K, and AKT,37, 38, 39, 40 in some cases enhancing the interaction efficiency of the involved signaling components. The present study shows that RACK1 knockdown using an shRNA construct completely abrogates the effects of SDF‐1α on proliferation of SHR CFs. A reasonable hypothesis is that the known increased expression of RACK1 in SHR CF membranes8 organizes the Gβγ/PLCβ3/PKC/Src/ERK1/2 pathway on the one hand and the Gβγ/PI3K/AKT pathway on the other, leading to enhanced SDF‐1α–induced cellular proliferation.
Perspectives
An important aspect of this research is that it identifies the ability of the endogenous chemokine SDF‐1α to stimulate the proliferation and hypertrophy of and collagen production by CFs, PGVSMCs, and GMCs. These findings provide a scientific basis for the emerging evidence that SDF‐1α contributes to cardiac and renal fibrosis. Another key finding is that the ability of SDF‐1α to activate CFs, PGVSMCs, and GMCs is augmented synergistically by DPP4 inhibition and genetic background. This suggests that DPP4 inhibitors may, in the long term, increase the risk of organ fibrosis, particularly in genetically susceptible patients. The fact that CXCR4 receptor antagonism blocks all effects of SDF‐1α, regardless of the activity of DPP4, the genetic background, or cellular origin, suggests that CXCR4 antagonists may be useful agents to prevent organ fibrosis in hypertensive or diabetic patients treated with DPP4 inhibitors. Finally, the observation that knockdown of RACK1 abrogates the effects of SDF‐1α supports the concept that inhibition of RACK1 may also protect against organ fibrosis.
Sources of Funding
The work was supported by the National Institutes of Health (DK091190, HL069846, DK068575, HL109002 and DK079307).
Disclosures
None.
(J Am Heart Assoc. 2017;6:e007253 DOI: 10.1161/JAHA.117.007253.)29114002
References
- 1. McIntosh CH, Demuth HU, Pospisilik JA, Pederson R. Dipeptidyl peptidase IV inhibitors: how do they work as new antidiabetic agents? Regul Pept. 2005;128:159–165. [DOI] [PubMed] [Google Scholar]
- 2. Gorrell MD. Dipeptidyl peptidase IV and related enzymes in cell biology and liver disorders. Clin Sci. 2005;108:277–292. [DOI] [PubMed] [Google Scholar]
- 3. Mentlein R. Dipeptidyl‐peptidase IV (CD26)—role in the inactivation of regulatory peptides. Regul Pept. 1999;85:9–24. [DOI] [PubMed] [Google Scholar]
- 4. Mulvihill EE, Drucker DJ. Pharmacology, physiology, and mechanisms of action of dipeptidyl peptidase‐4 inhibitors. Endocr Rev. 2014;35:992–1019. [DOI] [PMC free article] [PubMed] [Google Scholar]
- 5. Berglund MM, Hipskind PA, Gehlert DR. Recent developments in our understanding of the physiological role of PP‐fold peptide receptor subtypes. Exp Biol Med. 2003;228:217–244. [DOI] [PubMed] [Google Scholar]
- 6. Michel MC, Beck‐Sickinger A, Cox H, Doods HN, Herzog H, Larhammar D, Quirion R, Schwartz T, Westfall T. XVI. International Union of Pharmacology recommendations for the nomenclature of neuropeptide Y, peptide YY, and pancreatic polypeptide receptors. Pharmacol Rev. 1998;50:143–150. [PubMed] [Google Scholar]
- 7. Jackson EK, Kochanek SJ, Gillespie DG. Dipeptidyl peptidase IV regulates proliferation of preglomerular vascular smooth muscle and mesangial cells. Hypertension. 2012;60:757–764. [DOI] [PMC free article] [PubMed] [Google Scholar]
- 8. Zhu X, Gillespie DG, Jackson EK. NPY1‐36 and PYY1‐36 activate cardiac fibroblasts: an effect enhanced by genetic hypertension and inhibition of dipeptidyl peptidase 4. Am J Physiol Heart Circ Physiol. 2015;309:H1528–H1542. [DOI] [PMC free article] [PubMed] [Google Scholar]
- 9. Brown RD, Ambler SK, Mitchell MD, Long CS. The cardiac fibroblast: therapeutic target in myocardial remodeling and failure. Annu Rev Pharmacol Toxicol. 2005;45:657–687. [DOI] [PubMed] [Google Scholar]
- 10. Dubey RK, Jackson EK, Rupprecht HD, Sterzel RB. Factors controlling growth and matrix production in vascular smooth muscle and glomerular mesangial cells. Curr Opin Nephrol Hypertens. 1997;6:88–105. [DOI] [PubMed] [Google Scholar]
- 11. Wang W, Choi BK, Li W, Lao Z, Lee AY, Souza SC, Yates NA, Kowalski T, Pocai A, Cohen LH. Quantification of intact and truncated stromal cell‐derived factor‐1α in circulation by immunoaffinity enrichment and tandem mass spectrometry. J Am Soc Mass Spectrom. 2014;25:614–625. [DOI] [PubMed] [Google Scholar]
- 12. Busillo JM, Benovic JL. Regulation of CXCR4 signaling. Biochim Biophys Acta. 2007;1768:952–963. [DOI] [PMC free article] [PubMed] [Google Scholar]
- 13. Zhu X, Jackson EK. RACK1 regulates angiotensin II‐induced contractions of SHR preglomerular vascular smooth muscle cells. Am J Physiol Renal Physiol. 2017;312:F565–F576. [DOI] [PMC free article] [PubMed] [Google Scholar]
- 14. Inoue T, Mi Z, Gillespie DG, Jackson EK. Cyclooxygenase inhibition reveals synergistic action of vasoconstrictors on mesangial cell growth. Eur J Pharmacol. 1998;361:285–291. [DOI] [PubMed] [Google Scholar]
- 15. Cheng D, Zhu X, Gillespie DG, Jackson EK. Role of RACK1 in the differential proliferative effects of neuropeptide Y1‐36 and peptide YY1‐36 in SHR vs. WKY preglomerular vascular smooth muscle cells. Am J Physiol Renal Physiol. 2013;304:F770–F780. [DOI] [PMC free article] [PubMed] [Google Scholar]
- 16. Jackson EK, Menshikova EV, Mi Z, Verrier JD, Bansal R, Janesko‐Feldman K, Jackson TC, Kochanek PM. Renal 2′,3′‐cyclic nucleotide 3′‐phosphodiesterase is an important determinant of AKI severity after ischemia‐reperfusion. J Am Soc Nephrol. 2016;27:2069–2081. [DOI] [PMC free article] [PubMed] [Google Scholar]
- 17. Jie W, Wang X, Zhang Y, Guo J, Kuang D, Zhu P, Wang G, Ao Q. SDF‐1α/CXCR4 axis is involved in glucose‐potentiated proliferation and chemotaxis in rat vascular smooth muscle cells. Int J Exp Pathol. 2010;91:436–444. [DOI] [PMC free article] [PubMed] [Google Scholar]
- 18. Pan CH, Chen CW, Sheu MJ, Wu CH. Salvianolic acid B inhibits SDF‐1α‐stimulated cell proliferation and migration of vascular smooth muscle cells by suppressing CXCR4 receptor. Vascul Pharmacol. 2012;56:98–105. [DOI] [PubMed] [Google Scholar]
- 19. Shao S, Cai W, Sheng J, Yin L. Role of SDF‐1 and Wnt signaling pathway in the myocardial fibrosis of hypertensive rats. Am J Transl Res. 2015;7:1345–1356. [PMC free article] [PubMed] [Google Scholar]
- 20. Wang ER, Jarrah AA, Benard L, Chen J, Schwarzkopf M, Hadri L, Tarzami ST. Deletion of CXCR4 in cardiomyocytes exacerbates cardiac dysfunction following isoproterenol administration. Gene Ther. 2014;21:496–506. [DOI] [PMC free article] [PubMed] [Google Scholar]
- 21. Chu P‐Y, Zatta A, Kiriazis H, Chin‐Dusting J, Du X‐J, Marshall T, Kaye DM. CXCR4 antagonism attenuates the cardiorenal consequences of mineralocorticoid excess. Circ Heart Fail. 2011;4:651–658. [DOI] [PubMed] [Google Scholar]
- 22. Chu PY, Walder K, Horlock D, Williams D, Nelson E, Byrne M, Jandeleit‐Dahm K, Zimmet P, Kaye DM. CXCR4 antagonism attenuates the development of diabetic cardiac fibrosis. PLoS One. 2015;10:e0133616. [DOI] [PMC free article] [PubMed] [Google Scholar]
- 23. Zuk A, Gershenovich M, Ivanova Y, MacFarland RT, Fricker SP, Ledbetter S. CXCR4 antagonism as a therapeutic approach to prevent acute kidney injury. Am J Physiol Renal Physiol. 2014;307:F783–F797. [DOI] [PubMed] [Google Scholar]
- 24. Yuan A, Lee Y, Choi U, Moeckel G, Karihaloo A. Chemokine receptor Cxcr4 contributes to kidney fibrosis via multiple effectors. Am J Physiol Renal Physiol. 2015;308:F459–F472. [DOI] [PMC free article] [PubMed] [Google Scholar]
- 25. Kazakov A, Hall R, Jagoda P, Bachelier K, Muller‐Best P, Semenov A, Lammert F, Bohm M, Laufs U. Inhibition of endothelial nitric oxide synthase induces and enhances myocardial fibrosis. Cardiovasc Res. 2013;100:211–221. [DOI] [PubMed] [Google Scholar]
- 26. Sayyed SG, Hagele H, Kulkarni OP, Endlich K, Segerer S, Eulberg D, Klussmann S, Anders HJ. Podocytes produce homeostatic chemokine stromal cell‐derived factor‐1/CXCL12, which contributes to glomerulosclerosis, podocyte loss and albuminuria in a mouse model of type 2 diabetes. Diabetologia. 2009;52:2445–2454. [DOI] [PubMed] [Google Scholar]
- 27. Schober A, Knarren S, Lietz M, Lin EA, Weber C. Crucial role of stromal cell‐derived factor‐1α in neointima formation after vascular injury in apolipoprotein E‐deficient mice. Circulation. 2003;108:2491–2497. [DOI] [PubMed] [Google Scholar]
- 28. Zernecke A, Schober A, Bot I, von Hundelshausen P, Liehn EA, Mopps B, Mericskay M, Gierschik P, Biessen EA, Weber C. SDF‐1α/CXCR4 axis is instrumental in neointimal hyperplasia and recruitment of smooth muscle progenitor cells. Circ Res. 2005;96:784–791. [DOI] [PubMed] [Google Scholar]
- 29. Chu PY, Mariani J, Finch S, McMullen JR, Sadoshima J, Marshall T, Kaye DM. Bone marrow‐derived cells contribute to fibrosis in the chronically failing heart. Am J Pathol. 2010;176:1735–1742. [DOI] [PMC free article] [PubMed] [Google Scholar]
- 30. Subramanian S, Liu C, Aviv A, Ho JE, Courchesne P, Muntendam P, Larson MG, Cheng S, Wang TJ, Mehta NN, Levy D. Stromal cell‐derived factor 1 as a biomarker of heart failure and mortality risk. Arterioscler Thromb Vasc Biol. 2014;34:2100–2105. [DOI] [PMC free article] [PubMed] [Google Scholar]
- 31. Zuern CS, Walker B, Sauter M, Schaub M, Chatterjee M, Mueller K, Rath D, Vogel S, Tegtmeyer R, Seizer P, Geisler T, Kandolf R, Lang F, Klingel K, Gawaz M, Borst O. Endomyocardial expression of SDF‐1 predicts mortality in patients with suspected myocarditis. Clin Res Cardiol. 2015;104:1033–1043. [DOI] [PubMed] [Google Scholar]
- 32. Plosker GL. Sitagliptin: a review of its use in patients with type 2 diabetes mellitus. Drugs. 2014;74:223–242. [DOI] [PubMed] [Google Scholar]
- 33. Jackson EK. Context‐dependent effects of dipeptidyl peptidase 4 inhibitors. Curr Opin Nephrol Hypertens. 2017;26:83–90. [DOI] [PubMed] [Google Scholar]
- 34. Shi S, Koya D, Kanasaki K. Dipeptidyl peptidase‐4 and kidney fibrosis in diabetes. Fibrogenesis Tissue Repair. 2016;9:1. [DOI] [PMC free article] [PubMed] [Google Scholar]
- 35. Bando YK, Murohara T. Heart failure as a comorbidity of diabetes: role of dipeptidyl peptidase 4. J Atheroscler Thromb. 2016;23:147–154. [DOI] [PubMed] [Google Scholar]
- 36. Fadini GP, Albiero M, Avogaro A. Direct effects of DPP‐4 inhibition on the vasculature. Reconciling basic evidence with lack of clinical evidence. Vascul Pharmacol. 2015;73:1–3. [DOI] [PubMed] [Google Scholar]
- 37. Chen S, Spiegelberg BD, Lin F, Dell EJ, Hamm HE. Interaction of Gbetagamma with RACK1 and other WD40 repeat proteins. J Mol Cell Cardiol. 2004;37:399–406. [DOI] [PubMed] [Google Scholar]
- 38. Li JJ, Xie D. RACK1, a versatile hub in cancer. Oncogene. 2015;34:1890–1898. [DOI] [PubMed] [Google Scholar]
- 39. McCahill A, Warwicker J, Bolger GB, Houslay MD, Yarwood SJ. The RACK1 scaffold protein: a dynamic cog in cell response mechanisms. Mol Pharmacol. 2002;62:1261–1273. [DOI] [PubMed] [Google Scholar]
- 40. Sklan EH, Podoly E, Soreq H. RACK1 has the nerve to act: structure meets function in the nervous system. Prog Neurobiol. 2006;78:117–134. [DOI] [PubMed] [Google Scholar]


