

Abstract
Background
Obesity is a risk factor for many diseases. However, the potential association between adiposity and cognitive decline in hypertensive patients is inconclusive. We performed a secondary data analysis of the CSPPT (China Stroke Primary Prevention Trial) to examine whether adiposity is correlated with longitudinal cognitive performance in hypertensive adults.
Methods and Results
The analysis included 16 791 patients in the CSPPT who received at least 2 cognitive assessments by the Mini‐Mental State Examination (MMSE) during the follow‐up (median, 4.5 years; interquartile range, 4.2–4.8 years). Outcomes included changes in MMSE scores and cognitive impairment (defined as MMSE score less than education‐specific cutoff point). A marked reduction in MMSE scores at the final (compared with at the 1‐year) follow‐up was apparent in both men (n=4838; mean [SD] score, 0.41 [3.62]) and women (n=7190; mean [SD] score, 1.07 [4.61]; both P<0.001). Analysis using a mixed‐effects model revealed an association between higher body mass index with less MMSE decline, even after controlling for demographics and comorbidities (men, β=0.0134 [SE, 0.0036]; women, β=0.0133 [SE, 0.0034]; both P<0.001). A total of 1037 men (15.3%) and 3317 women (33.1%) developed cognitive impairment. In multivariable Cox regression analyses, being obese in men (11.3% versus 18.0%; hazard ratio, 0.75; 95% confidence interval, 0.60–0.94) and women (30.1% versus 36.5%; hazard ratio, 0.82; 95% confidence interval, 0.74–0.91) was a protective factor against cognitive impairment compared with normal body mass index.
Conclusions
Higher adiposity is independently associated with slower cognitive decline in Chinese hypertensive adults.
Clinical Trial Registration
URL: http://www.clinicaltrials.gov. Unique identifier: NCT00794885 CSPPT.
Keywords: adiposity, body mass index, cognitive decline, hypertension, waist circumference
Subject Categories: Hypertension, Epidemiology, Cognitive Impairment, Obesity
Clinical Perspective
What Is New?
Most previous studies have focused on the association between obesity and survival, but not cognitive abilities, in individuals with established cardiovascular diseases. This study explores the prospective relationship between adiposity and cognitive decline among hypertensive patients.
There was a high prevalence of increased body mass index and waist circumference in patients with hypertension, present in approximately one fifth and one half of the patients, respectively.
Both higher body mass index and waist circumference were related to a decreased risk of subsequent cognitive decline independent of established cardiovascular risk factors, and patients who were underweight showed a substantial acceleration of cognitive decline.
What Are the Clinical Implications?
Given the increased epidemic of obesity in hypertensive patients, the characterization of trajectories of cognitive change associated with higher adiposity is important in clinical settings.
Although the reasons for the inverse association of adiposity with cognitive decline cannot be determined in this study, the findings identified groups of patients with hypertension who are at increased risk of accelerated cognitive decline who may benefit from possible strategies to prevent or attenuate cognitive deterioration.
Introduction
In recent decades, the prevalence of obesity has reached epidemic proportions worldwide.1 In 2014, >1.9 billion adults were overweight (body mass index [BMI], ≥25 kg/m2), and >600 million of them were obese (BMI, ≥30 kg/m2). In the general population, it has been well established that obesity, especially its abdominal form, is a modifiable risk factor for cardiovascular disease (CVD)–related morbidity and mortality. Higher BMI is also an independent predictor of progression from normal cognition to cognitive dysfunction. Dementia, an irreversible deterioration of cognitive function, is one of the most common causes of cognitive impairment in the elderly. Similar to obesity, dementia has been increasing. The 2015 World Alzheimer Report predicted that the number of people living with dementia worldwide is expected to increase from 46.8 million in 2015 to 131.5 million in 2050.2 Growing evidence supports the notion that midlife obesity confers dementia risk in late life.3, 4 Furthermore, considering that accelerated cognitive decline at an early stage is an important predictor of high risk for dementia, the relationship between adiposity and cognitive decline has also garnered considerable interests of clinical investigators. Less compelling, but consistent, evidence links obesity exposure at younger age to a steeper subsequent cognitive decline, even among people without dementia.5, 6
Paradoxically, obesity also has been shown to confer a survival benefit once CVD is established.7, 8, 9 Emerging evidence has demonstrated that obese patients with CVD may have a more favorable prognosis than their normal‐weight counterparts, a phenomenon often termed “obesity paradox.” The obesity paradox has also been confirmed in non‐CVDs, including type 2 diabetes mellitus, hemodialysis, cancer, and pulmonary disease.10, 11, 12, 13
Hypertension is a major public health challenge, especially in developing countries. Successive population surveys in China have indicated that increases in the prevalence of hypertension have been substantial during the past 30 years, with the most recent national survey reporting at least 325 million Chinese adults (29.6%) have hypertension.14 Obesity is often associated with hypertension, as either a causative factor or a concomitant disease. Understanding the prognostic impact of obesity on clinical outcomes among hypertensive patients is a public health priority. In a previous study from our research group, a post hoc analysis using data of 20 694 middle‐aged and older subjects from the CSPPT (China Stroke Primary Prevention Trial) demonstrated that obesity could reduce the risk of all‐cause mortality by ≈36%. This study strengthened the existing evidence of the obesity paradox in hypertensive patients.15 Cognitive decline significantly affects daily functioning and, thus, quality of life, especially among patients with CVD. Identifying modifiable risk factors associated with cognitive decline is important, given possible strategies for preventing or attenuating cognitive deterioration early. Although prior studies have documented an association between adiposity and cognitive abilities in the general population, it remains unelucidated how obesity affects cognitive function of hypertensive patients. The CSPPT provided an opportunity to address these questions by including a large and well‐defined cohort of hypertensive adults with follow‐up measurements of cognitive function. In the current study, we conducted a secondary data analysis to examine whether obesity confers benefit in cognitive status in hypertensive subjects. Specifically, we examined the potential association between cognitive decline in this study sample over a 4.5‐year period and both BMI and waist circumference (WC).
Methods
Study Design and Participants
A detailed description of the protocol and primary results of the CSPPT has been presented in Data S1 and published previously.16 Briefly, the CSPPT is a community‐based, randomized, multicenter, double‐blind controlled trial conducted from May 19 2008 to August 24 2013 in 32 communities in the Anhui and Jiangsu provinces of China. The study enrolled a total of 20 702 hypertensive adults, aged 45 to 75 years, who were free from other major CVDs. Participants were randomly assigned to receive treatment with either a combination of enalapril and folic acid or enalapril alone and were followed‐up every 3 months for a median of 4.5 years. Detailed inclusion and exclusion criteria for the CSPPT have been described elsewhere.16 This secondary analysis of cognitive outcomes was conducted to determine the effects of adiposity on trajectories of cognitive decline. The analysis included CSPPT participants who received at least 2 cognitive assessments during the follow‐up and had available measures of adiposity at the baseline. The CSPPT was approved by the Ethics Committee of the Institute of Biomedicine, Anhui Medical University (Hefei, China) (FWA assurance number FWA00001263). All patients provided written informed consent before the enrollment.
Definition of Adiposity
Height, weight, and WC were collected at the baseline visit. BMI, the primary measure of adiposity, was calculated as weight in kilograms divided by the square of height in meters. We analyzed BMI as a continuous variable and divided it into Chinese categories for underweight (<18.5 kg/m2), normal weight (18.5–<24 kg/m2), overweight (24–<28 kg/m2), and obese (≥28 kg/m2).17 Abdominal adiposity was assessed using WC and defined as high if WC ≥90 cm for men and ≥80 cm for women.18
Assessment of Cognitive Performance
Cognitive assessment was completed using the Chinese version of the Mini‐Mental State Examination (MMSE) at the 1‐ and 3‐year follow‐ups and the final follow‐up visit. The Chinese version of the MMSE, as a reliable and standardized tool, has been validated for use in the Chinese population and has been widely used to screen cognitive impairment and dementia.19 The tests were performed by trained interviewers in a standardized manner during each follow‐up visit. Specifically, the MMSE includes a broad set of cognitive domains that measure the following: orientation to time (5 points), orientation to place (5 points), registration (3 points), attention and calculation (5 points), recall (3 points), and language (9 points). The total score ranges from 0 to 30 points, with higher scores indicating better cognitive performance. The test was considered invalid if a subject refused to answer a question or there was a missing item in the test.
Outcome Measures
The primary outcome was change in MMSE score. The secondary outcome was time to cognitive impairment. Cognitive impairment was determined according to the education‐specific cutoff points of MMSE in China: ≤17 for illiterate people, ≤20 for people with 1 to 6 years of education (primary school), and ≤24 for people with >6 years of education (middle school or higher).20 We included 2 additional composite outcomes21: (1) cognitive impairment with stroke (defined as the diagnosis of cognitive impairment after a new‐onset stroke during the follow‐up) and (2) other cases of cognitive impairment.
Covariate Variables
Detailed data on sociodemographic status, lifestyle, and medical history as well as seated blood pressure (BP) measurements were obtained by trained investigators using standard procedures. Systolic BP and diastolic BP for analyses were calculated as the mean of 3 consecutive measurements on the right arm. We categorized marriage status as married, never, or other (divorced, widowed, or separated) and cigarette and alcohol consumption as never, former, and current. Living conditions were determined by self‐report (low, moderate, and high). Physical activity was categorized as low, moderate, or high, according to self‐reported exercise frequency. Depressive symptoms were evaluated using the Patient Health Questionnaire‐9.22 The CSPPT collected overnight fasting venous blood samples at the baseline visit. Methods for collecting laboratory assays have been described before.16 Estimated glomerular filtration rate (eGFR) was calculated from serum creatinine using the equation according to the Chronic Kidney Disease Epidemiology Collaboration.23 We defined normal kidney function as eGFR ≥90 mL/min per 1.73 m2 and chronic kidney disease as eGFR <60 mL/min per 1.73 m2. Diabetes mellitus was defined as fasting plasma glucose ≥7.0 mmol/L (to convert mmol/L to mg/dL, divide by 0.0555), self‐reported diagnosis of diabetes mellitus, or use of hypoglycemic agents. New‐onset stroke during follow‐up was determined by an End Point Adjudication Committee.
Statistical Analysis
Baseline demographic and clinical characteristics are expressed as mean (SD) or percentage and compared using Student t test, 1‐way ANOVA test, or χ2 test, where appropriate. Data for marital status (n=81), smoking status (n=2), alcohol consumption (n=5), and physical activity (n=15) were missing for <1% of the patients. Data for serum eGFR (n=326) and diabetes mellitus at baseline (n=310) were missing for 1% to 2% of patients, and data for new‐onset diabetes mellitus (n=1832) during the follow‐up were missing for 11% of the cohort. Missing values of continuous and categorical covariates in outcome analysis were handled using multiple imputation with 10 imputed data sets and a chained equation approach. Because all adiposity measures differed significantly by sex, all subsequent analyses were conducted separately for men and women.
Generalized linear mixed models using unstructured correlation matrices and maximum likelihood method were applied to evaluate whether baseline adiposity measures predicted trajectories of MMSE change during the follow‐up. Intersubject variability was the random effect (random intercepts and slopes), and baseline adiposity measures were the fixed effect. We included adiposity measures, the time in the study (years after randomization), and potential covariates and their interactions with time in the mixed‐effects model. The term for time was modeled as a continuous variable or categorical variable to reflect change in MMSE score per year or per cognitive assessment in the reference group, respectively.
We applied Cox proportional hazards models to estimate the multivariable‐adjusted hazard ratios (HRs) and 95% confidence intervals (CIs) for cognitive impairment related to categories of adiposity measures. Follow‐up duration was calculated from the date of randomization to first diagnosis of cognitive impairment or the end of CSPPT. For patients who were unavailable for follow‐up, data were censored at the last follow‐up visit with cognitive assessment. Tests for linear trend in the HRs of cognitive impairment were based on medians across categories of BMI and WC. Multivariable models (model 1‐2) adjusted for baseline age, study center, educational level, smoking and alcohol consumption, marital status, living conditions, physical activity, depressive symptoms, systolic BP (SBP), mean SBP during treatment period, eGFR, medical diseases (diabetes mellitus and stroke), and treatment allocation. We combined several strategies to select covariates for multivariable adjustment. First, we included variables producing >10% change in the regression coefficient of BMI (or WC) after they were introduced into the basic model and removed from the full model. In addition, we selected variables that were associated with cognitive function at a level of P<0.1 in the univariate analysis. Moreover, we also included appropriate covariates based on evidence from published literature and our clinical perspective. We applied the same modeling strategy in the covariate selection for change in MMSE score in the generalized linear mixed models. In the Cox models, we tested the proportional hazard assumption for each covariate by examining the log‐minus‐log plots against log follow‐up time, and the likelihood‐ratio test was also conducted after introducing an interaction term between time and each covariate into the main effects model.
We further investigated the nonlinear relationship between BMI and WC as continuous variables and the risk of cognitive impairment by smooth curve fitting using penalized thin plate regression splines within general additive models. Threshold analysis was conducted using the segmented regression model, likelihood ratio test, and bootstrap resampling method if tests for nonlinear trend were significant.
In subgroup analyses, we used stratified Cox proportional hazards models to examine the robustness of our primary results on the basis of prespecified baseline variables. Among men, we performed additional analysis to explore if the relationship varied by smoking status (never versus former versus current). Effect modification by above individual covariates was estimated from the likelihood‐ratio test of models with and without interaction terms, where BMI was regarded as a continuous variable.
Several sensitivity analyses were implemented to address reverse causation by excluding patients with chronic kidney disease at baseline, those with new stroke during the follow‐up, and those with cognitive impairment at the 1‐year follow‐up. In additional sensitivity analyses, we divided BMI into World Health Organization categories for underweight (<18.5 kg/m2), normal weight (18.5–<25 kg/m2), overweight (25–30 kg/m2), and obese (≥30 kg/m2). We also defined high WC using ≥94 cm for men and ≥80 cm for women (recommended for whites) and ≥90 cm for men and ≥80 cm for women (recommended in the United States).
A 2‐tailed P<0.05 was considered statistically significant. All analyses were performed using EmpowerStats (http://www.empowerstats.com) and R (http://www.R-project.org) software.
Results
Demographic and Baseline Characteristics of the Study Participants
Of the 20 702 participants enrolled in the CSPPT study, 7 had no information on weight or height at baseline; 13 had missing important covariates, including age and education level, at baseline; 78 died before the first follow‐up; and 3813 had no available cognitive assessments at all follow‐up visits (n=928) or had only 1 cognitive measure (n=2885). A total of 16 791 participants (81.1%) were included in data analysis in the current study (Figure 1). Patient characteristics of the subjects included in the study in comparison with those excluded are reported in Table S1. Excluded participants were slightly younger, more likely to smoke, less likely to be married and diabetic (women only), had higher stroke incidence, and had lower baseline SBP. The demographic data and baseline characteristics of the study participants are summarized in Table 1. Of the 16 791 patients (mean [SD] baseline age, 60.1 [7.4] years; 10 033 [59.8%] were women) in our study, 6370 (37.9%) had normal BMI, 6610 (39.4%) were overweight, and 3411 (20.3%) were obese. In addition, 11.5% of the patients had diabetes mellitus at baseline, 11.3% had de novo diabetes mellitus during the follow‐up, and 2.7% had new‐onset stroke. Table S2 provides demographic and clinical characteristics stratified by BMI categories.
Figure 1.
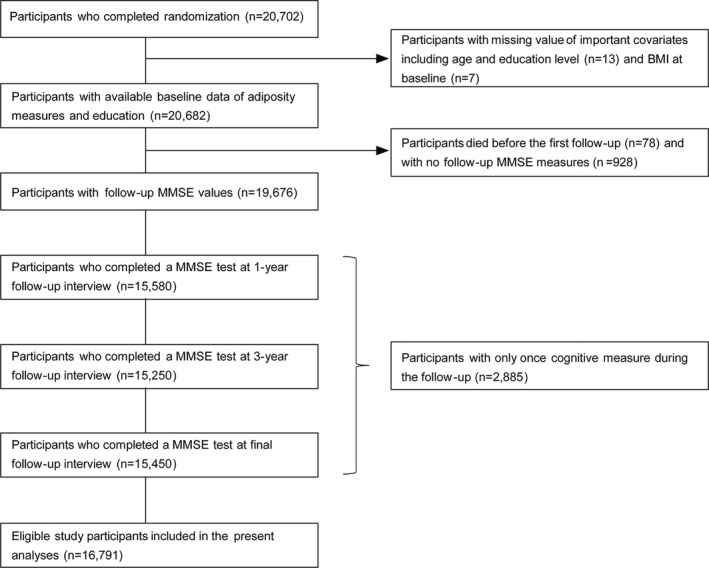
The study flow chart for post hoc cognition analysis of the CSPPT (China Stroke Primary Prevention Trial). BMI indicates body mass index; and MMSE, Mini‐Mental State Examination.
Table 1.
Demographic and Clinical Characteristics of Study Participants by Sex
| Characteristics | Total (N=16 791) | Men (n=6758) | Women (n=10 033) | P Value |
|---|---|---|---|---|
| Age, mean (SD), y | 60.1 (7.4) | 61.3 (7.4) | 59.3 (7.4) | <0.001 |
| Marital status, n (%) | ||||
| Married | 14 435 (86.4) | 5880 (87.5) | 8555 (85.6) | <0.001 |
| Never married | 151 (0.9) | 103 (1.5) | 48 (0.5) | |
| Other (divorced, widowed, or separated) | 2124 (12.7) | 734 (10.9) | 1390 (13.9) | |
| Educational level, n (%) | ||||
| Illiteracy | 10 853 (64.6) | 2549 (37.7) | 8304 (82.8) | <0.001 |
| Primary school | 2759 (16.4) | 1749 (25.9) | 1010 (10.1) | |
| Middle school and higher | 3179 (18.9) | 2460 (36.4) | 719 (7.2) | |
| Living conditions, n (%) | ||||
| Low | 1963 (11.7) | 942 (13.9) | 1021 (10.2) | <0.001 |
| Moderate | 12 909 (76.9) | 5147 (76.2) | 7762 (77.4) | |
| High | 1919 (11.4) | 669 (9.9) | 1250 (12.5) | |
| BMI, mean (SD), kg/m2 | 25.1 (3.7) | 24.3 (3.4) | 25.5 (3.8) | <0.001 |
| BMI category, n (%) | ||||
| Underweight | 400 (2.4) | 209 (3.1) | 191 (1.9) | <0.001 |
| Normal weight | 6370 (37.9) | 3018 (44.7) | 3352 (33.4) | |
| Overweight | 6610 (39.4) | 2528 (37.4) | 4082 (40.7) | |
| Obese | 3411 (20.3) | 1003 (14.8) | 2408 (24.0) | |
| WC, mean (SD), cm | 84.5 (9.9) | 84.4 (10.1) | 84.5 (9.8) | 0.460 |
| SBP, mean (SD), mm Hg | ||||
| Baseline | 167.3 (20.5) | 165.7 (20.6) | 168.4 (20.4) | <0.001 |
| Follow‐up | 138.9 (10.5) | 138.7 (10.2) | 139.0 (10.7) | 0.127 |
| eGFR, mean (SD), mL/min per 1.73 m2 | 93.5 (13.0) | 91.9 (13.4) | 94.6 (12.7) | <0.001 |
| Current smoking, n (%) | 3819 (22.7) | 3498 (51.8) | 321 (3.2) | <0.001 |
| Current alcohol drinking, n (%) | 3918 (23.3) | 3528 (52.2) | 390 (3.9) | <0.001 |
| Low physical activity, n (%) | 6170 (36.8) | 2421 (35.9) | 3749 (37.4) | 0.093 |
| Treatment allocation, n (%) | ||||
| Enalapril | 8446 (50.3) | 3393 (50.2) | 5053 (50.4) | 0.842 |
| Enalapril–folic acid | 8345 (49.7) | 3365 (49.8) | 4980 (49.6) | |
| Medical comorbidities, n (%) | ||||
| Diabetes mellitus at baseline | 1889 (11.5) | 677 (10.3) | 1212 (12.3) | <0.001 |
| New diabetes mellitusa | 1694 (11.3) | 677 (11.3) | 1017 (11.3) | 0.973 |
| Stroke | 447 (2.7) | 210 (3.1) | 237 (2.4) | 0.003 |
BMI indicates body mass index; WC, waist circumference; eGFR, estimated glomerular filtration rate; SBP, systolic blood pressure.
New diabetes mellitus is defined as having no diabetes mellitus at baseline and being diabetic at final follow‐up visit.
Changes in MMSE Scores
The patients in CSPPT were followed‐up for a median duration of 4.5 years (interquartile range, 4.2–4.8 years). The total MMSE score and subscores for each domain of the study participants at each follow‐up visit are shown in Table 2. The mean (SD) MMSE scores were 26.2 (4.0) in men and 22.3 (4.5) in women at the 1‐year follow‐up visit and 25.8 (4.6) in men and 21.2 (5.2) in women at the final follow‐up visit. A significant mean (SD) reduction of 0.41 (3.62) points in total MMSE score was observed in men at the final follow‐up versus the 1‐year follow‐up, and a marked 1.07 (4.61) point reduction was observed in women at the final follow‐up versus the 1‐year follow‐up. Consistently, a significant reduction was also noticed in the MMSE subscores, especially orientation to time and attention/calculation, at the final follow‐up visit versus the 1‐year follow‐up visit (Table 2). Figure 2 also shows the unadjusted mean changes in total MMSE score and their corresponding 95% CIs and sample size of participants with available data by BMI category across follow‐up visits.
Table 2.
Total MMSE Score and Subscores of the Study Participants at Each Follow‐Up Visit
| Measures | Men | Women | ||||||||
|---|---|---|---|---|---|---|---|---|---|---|
| 1 Year | 3 Years | Final | Changea | Changeb | 1 Year | 3 Years | Final | Changea | Changeb | |
| No. of participants with available data | 5707 | 5786 | 5889 | 4735 | 4838 | 8550 | 8790 | 8673 | 7307 | 7190 |
| MMSE score | 26.2 (4.0) | 26.0 (4.0) | 25.8 (4.6) | 0.04 (3.32) | 0.41 (3.62)c | 22.3 (4.5) | 22.1 (4.4) | 21.2 (5.2) | 0.06 (4.02) | 1.07 (4.61)c |
| MMSE subscores | ||||||||||
| Orientation to time | 4.4 (1.0) | 4.4 (1.0) | 4.2 (1.2) | −0.0042 (1.1198) | 0.2377 (1.2373)c | 3.9 (1.3) | 3.8 (1.3) | 3.3 (1.6) | −0.0053 (1.5089) | 0.5764 (1.7400)c |
| Orientation to place | 5.0 (0.2) | 5.0 (0.2) | 4.9 (0.4) | −0.0004 (0.2986) | 0.0593 (0.4738)c | 4.8 (0.7) | 4.8 (0.6) | 4.6 (1.0) | −0.0365 (0.8764) | 0.1982 (1.0803)c |
| Registration | 2.9 (0.5) | 2.9 (0.5) | 2.8 (0.6) | −0.0068 (0.6142) | 0.0562 (0.7007)c | 2.8 (0.6) | 2.8 (0.6) | 2.7 (0.8) | −0.0140 (0.7989) | 0.1462 (0.9591)c |
| Attention/calculation | 4.0 (1.6) | 4.0 (1.7) | 4.0 (1.7) | 0.0707 (1.6683)§ | 0.0978 (1.7462)c | 2.3 (2.1) | 2.2 (2.0) | 2.2 (2.1) | 0.1384 (1.9928)c | 0.0979 (2.0968)c |
| Recall | 2.3 (1.0) | 2.4 (1.0) | 2.4 (1.0) | −0.0967 (1.2382) | −0.1114 (1.2531) | 2.1 (1.1) | 2.2 (1.1) | 2.1 (1.2) | −0.1403 (1.3502) | −0.0501 (1.4019)c |
| Language | 7.5 (1.4) | 7.5 (1.4) | 7.5 (1.5) | 0.0788 (1.1532)c | 0.0699 (1.1575)c | 6.3 (1.0) | 6.2 (1.1) | 6.2 (1.1) | 0.1222 (1.0637)c | 0.1053 (1.0478)c |
For continuous variables, data are presented in mean (SD). MMSE indicates Mini‐Mental State Examination.
Changes in total MMSE score and subscores (scores at 1‐year follow‐up visit–scores at 3‐year follow‐up visit).
Changes in total MMSE score and subscores (scores at 1‐year follow‐up visit–scores at final follow‐up visit).
P<0.001.
P<0.01.
Figure 2.
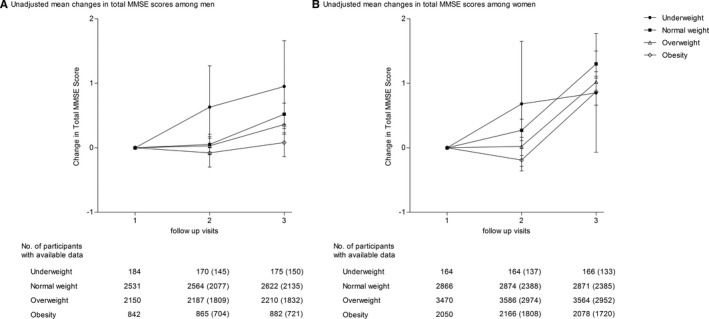
Unadjusted mean change in total Mini‐Mental State Examination (MMSE) score by body mass index (BMI) categories at baseline. Changes of MMSE scores at the 3‐year follow‐up visit and final follow‐up visit vs the 1‐year follow‐up visit are presented in men (A) and women (B). A, After adjusting for covariates, the changes in total MMSE score between all other BMI groups and normal‐weight group are not statistically significant at 3‐year follow‐up visit vs 1‐year follow‐up visit; the change in total MMSE score between obesity group and normal‐weight group is P=0.004 at final follow‐up visit vs 1‐year follow‐up visit. B, After adjusting for covariates, the change in total MMSE score between obesity group and normal‐weight group is P=0.004 at 3‐year follow‐up visit vs 1‐year follow‐up visit; the changes in total MMSE score between overweight group and normal‐weight group and between obesity group and normal‐weight group are P=0.027 and P<0.027, respectively, at final follow‐up visit vs 1‐year follow‐up visit. Error bars indicate 95% confidence intervals. Numbers outside parentheses represent number of participants with available data at each follow‐up visit, and numbers in parentheses represent number of participants with available data on the changes of MMSE between 3‐year follow‐up (or final follow‐up) and 1‐year follow‐up.
Baseline Adiposity Measures and Trajectories of Cognitive Decline in MMSE Scores
When BMI was analyzed as a continuous variable, analysis using the mixed‐effects regression model showed a 1‐U increase in BMI was associated with significantly slower rates of decline in total MMSE score during the follow‐up (P<0.001; Table 3). The mean (SEM) rate of MMSE decline for a participant at a normal BMI level of 24 kg/m2 was 0.4785 (0.0856) points per year among men (P<0.001) and 0.6430 (0.0841) points per year among women (P<0.001). The decline in total MMSE score per year is 0.0153 points less with each additional unit increase in BMI >24 kg/m2 among men and 0.0142 points less with each additional unit increase in BMI >24 kg/m2 among women. When BMI was analyzed as a categorical variable, a more rapid decrease in MMSE score over time was observed in patients who were underweight compared with normal‐weight individuals, although this association was significant only among men (β=−0.1669 [SE, 0.0704]; P=0.018; Table 4). Furthermore, rates of MMSE decline were significantly slower in obese patients than those of normal‐weight patients (men: β=0.1104 [SE, 0.0359] [P=0.002]; women: β=0.1176 [SE, 0.0328] [P<0.001]). In particular, obese individuals experienced a 0.0250‐point decrease per year in men and a 0.2213‐point decrease per year in women, whereas those with a normal BMI experienced a 0.1354‐point decrease per year in men and a 0.3389‐point decrease per year in women. These associations remained significant after further adjustment for cardiovascular risks and other factors (Table 5). Similar associations were also found between WC and MMSE decline (Table S3 through S5).
Table 3.
Effects of Continuous BMI Levels on Longitudinal Change in Cognitive Function Represented by MMSE Score
| Modela | Men | Women | |||
|---|---|---|---|---|---|
| Coefficient β (SE)b | P Value | Coefficient β (SE)b | P Value | ||
| Effect of time on change in MMSE score (per year/test) | |||||
| Model 1c | Time | −0.4785 (0.0856) | <0.001 | −0.6430 (0.0841) | <0.001 |
| Model 2d | Time (2) | −1.1359 (0.3448) | 0.001 | −1.0952 (0.3326) | 0.001 |
| Time (3) | −1.9174 (0.3421) | <0.001 | −2.5749 (0.3351) | <0.001 | |
| Additional effect of BMI on change in MMSE score (per year/test) | |||||
| Model 1 | BMI×time | 0.0153 (0.0035) | <0.001 | 0.0142 (0.0033) | <0.001 |
| Model 2 | BMI×time (2) | 0.0431 (0.0140) | 0.002 | 0.0386 (0.0129) | 0.003 |
| BMI×time (3) | 0.0614 (0.0139) | <0.001 | 0.0570 (0.0130) | <0.001 | |
BMI indicates body mass index; and MMSE, Mini‐Mental State Examination.
The mixed model is adjusted for study center, age, and education.
Coefficient β (SE) represents mean change over time for an individual in the reference group (with a BMI level of 18.5 kg/m2, which is the lower bound of the normal‐weight group) and the additional effect of a 1‐U increase in BMI on change in MMSE score per year (or per test).
In model 1, time is modeled as a continuous variable to reflect change in MMSE score per year for an individual in the reference group.
In model 2, time is modeled as a categorical variable to reflect change in MMSE score per test for an individual in the reference group, time (2) represents comparison of MMSE score at the 3‐year follow‐up visit vs the 1‐year follow‐up visit, and time (3) represents comparison of MMSE score at the final follow‐up visit and the 1‐year follow‐up visit.
Table 4.
Effects of Categorical BMI Status on Longitudinal Change in Cognitive Function Represented by MMSE Score
| Modela | Men | Women | |||
|---|---|---|---|---|---|
| Coefficient β (SE)b | P Value | Coefficient β (SE)b | P Value | ||
| Effect of time on change in MMSE score (per year/test) | |||||
| Model 1c | Time | −0.1354 (0.0180) | <0.001 | −0.3389 (0.0212) | <0.001 |
| Model 2d | Time (2) | −0.1222 (0.0725) | 0.092 | −0.2888 (0.0845) | <0.001 |
| Time (3) | −0.5390 (0.0719) | <0.001 | −1.3554 (0.0845) | <0.001 | |
| Additional effect of BMI categories on change in MMSE score (per year/test) | |||||
| Model 1 | Underweight×time | −0.1669 (0.0704) | 0.018 | 0.0488 (0.0918) | 0.595 |
| Overweight×time | 0.0481 (0.0265) | 0.070 | 0.0724 (0.0286) | 0.011 | |
| Obese×time | 0.1104 (0.0359) | 0.002 | 0.1176 (0.0328) | <0.001 | |
| Model 2 | Underweight×time (2) | −0.5846 (0.2844) | 0.040 | −0.4850 (0.3631) | 0.182 |
| Overweight×time (2) | 0.0688 (0.1067) | 0.519 | 0.2457 (0.1137) | 0.031 | |
| Obese×time (2) | 0.1872 (0.1446) | 0.195 | 0.3661 (0.1295) | 0.005 | |
| Underweight×time (3) | −0.6676 (0.2816) | 0.018 | 0.1976 (0.3660) | 0.589 | |
| Overweight×time (3) | 0.1914 (0.1061) | 0.071 | 0.2953 (0.1138) | 0.009 | |
| Obese×time (3) | 0.4414 (0.1436) | 0.002 | 0.4735 (0.1306) | <0.001 | |
BMI indicates body mass index; and MMSE, Mini‐Mental State Examination.
The mixed model is adjusted for study center, age, and education.
Coefficient β (SE) represents mean change over time for an individual with a BMI level in the reference group of the normal‐weight category and the additional effect of being underweight, overweight, or obese on change in MMSE score per year (or per MMSE test).
In model 1, time is modeled as a continuous variable to reflect change in MMSE score per year for an individual in the reference group.
In model 2, time is modeled as a category variable to reflect change in MMSE score per test for an individual in the reference group, time (2) represents the comparison of MMSE score at the 3‐year follow‐up visit vs the 1‐year follow‐up visit, and time (3) represents comparison of MMSE score between the final follow‐up visit and the 1‐year follow‐up visit.
Table 5.
Multivariate‐Adjusted Associations Between BMI at Baseline and Change in Cognitive Function Represented by MMSE Score
| Modela | Men | Women | |||
|---|---|---|---|---|---|
| Coefficient β (SE)b | P Value | Coefficient β (SE)b | P Value | ||
| Effect of time on change in MMSE score (per year/test) | |||||
| Model 1c | Time | −0.4293 (0.0897) | <0.001 | −0.6179 (0.0885) | <0.001 |
| Model 2d | Time (2) | −0.9189 (0.3727) | 0.014 | −1.0277 (0.3596) | 0.004 |
| Time (3) | −1.7163 (0.3588) | <0.001 | −2.4590 (0.3524) | <0.001 | |
| Additional effect of BMI on change in MMSE score (per year/test) | |||||
| Model 1 | BMI×time | 0.0134 (0.0036) | <0.001 | 0.0133 (0.0034) | <0.001 |
| Model 2 | BMI×time (2) | 0.0356 (0.0151) | 0.019 | 0.0389 (0.0139) | 0.005 |
| BMI×time (3) | 0.0538 (0.0146) | <0.001 | 0.0534 (0.0136) | <0.001 | |
| Effect of time on change in MMSE score (per year/test) | |||||
| Model 1c | Time | −0.1297 (0.0189) | <0.001 | −0.3345 (0.0223) | <0.001 |
| Model 2d | Time (2) | −0.0798 (0.0788) | 0.311 | −0.2169 (0.0917) | 0.018 |
| Time (3) | −0.5078 (0.0756) | <0.001 | −1.3192 (0.0889) | <0.001 | |
| Additional effect of BMI categories on change in MMSE score (per year/test) | |||||
| Model 1 | Underweight×time | −0.1335 (0.0746) | 0.073 | 0.0717 (0.0965) | 0.457 |
| Overweight×time | 0.0375 (0.0278) | 0.178 | 0.0648 (0.0299) | 0.030 | |
| Obese×time | 0.1091 (0.0374) | 0.004 | 0.1146 (0.0344) | <0.001 | |
| Model 2 | Underweight×time (2) | −0.3114 (0.3127) | 0.319 | −0.2637 (0.3917) | 0.501 |
| Overweight×time (2) | 0.0325 (0.1152) | 0.778 | 0.2236 (0.1223) | 0.067 | |
| Obese×time (2) | 0.1751 (0.1547) | 0.258 | 0.3976 (0.1396) | 0.004 | |
| Underweight×time (3) | −0.5421 (0.2983) | 0.069 | 0.2695 (0.3843) | 0.483 | |
| Overweight×time (3) | 0.1453 (0.1113) | 0.192 | 0.2625 (0.1193) | 0.028 | |
| Obese×time (3) | 0.4324 (0.1498) | 0.004 | 0.4623 (0.1372) | <0.001 | |
BMI indicates body mass index; and MMSE, Mini‐Mental State Examination.
The mixed model is adjusted for study center, age, education, smoking, alcohol drinking, marital status, living conditions, physical activity, Patient Health Questionnaire‐9 scores, systolic blood pressure at baseline, mean systolic blood pressure during the follow‐up, estimated glomerular filtration rate, new stroke, diabetes mellitus, and treatment allocation.
Coefficient β (SE) represents mean change over time for an individual in the reference group (with a BMI level of 18.5 kg/m2, which is the lower bound of the normal‐weight group) and the additional effect of a 1‐U increase in BMI on changes in MMSE score per year (or per test) or mean change over time for an individual with a BMI level in the reference group of the normal‐weight category and the additional effect of being underweight, overweight, or obese on change in MMSE score per year (or per MMSE test).
In model 1, time is modeled as a continuous variable to reflect change in MMSE score per year for an individual in the reference group.
In model 2, time is modeled as a categorical variable to reflect change in MMSE score per test for an individual in the reference group, time (2) represents comparison of MMSE score at the 3‐year follow‐up visit vs the 1‐year follow‐up visit, and time (3) represents comparison of MMSE score between the final follow‐up visit and the 1‐year follow‐up visit.
We further explored the relationship between BMI and changes in multifactorial MMSE subscores (Table 6). Higher BMI was significantly associated with a decelerated decline in MMSE subscores in both men and women (P<0.05 for both), especially in the domains of orientation to time, attention/calculation, and recall. Further adjustment for cardiovascular risk factors also did not substantially change these results (Table 7). A similar pattern was found in the effect of WC in men, but not in women (Tables S6 and S7).
Table 6.
Associations Between Baseline BMI and Longitudinal Changes in Cognitive Domains Represented by MMSE Subscores
| MMSE Subscoresa | Men | Women | ||||||
|---|---|---|---|---|---|---|---|---|
| Timeb | BMI×Timec | Timeb | BMI×Timec | |||||
| Coefficient β (SE) | P Value | Coefficient β (SE) | P Value | Coefficient β (SE) | P Value | Coefficient β (SE) | P Value | |
| Orientation to time (0–5 points) | −0.1882 (0.0292) | <0.001 | 0.0053 (0.0012) | <0.001 | −0.2220 (0.0313) | <0.001 | 0.0029 (0.0012) | 0.018 |
| Orientation to place (0–5 points) | −0.0176 (0.0101) | 0.082 | 0.0001 (0.0004) | 0.772 | −0.1001 (0.0192) | <0.001 | 0.0020 (0.0007) | 0.009 |
| Registration (0–3 points) | −0.0428 (0.0160) | 0.008 | 0.0012 (0.0007) | 0.073 | −0.0477 (0.0170) | 0.005 | 0.0003 (0.0007) | 0.621 |
| Attention/calculation (0–5 points) | −0.1272 (0.0417) | 0.002 | 0.0040 (0.0017) | 0.015 | −0.1170 (0.0390) | 0.003 | 0.0036 (0.0015) | 0.016 |
| Recall (0–3 points) | −0.0546 (0.0295) | 0.064 | 0.0034 (0.0012) | 0.005 | −0.0731 (0.0258) | 0.005 | 0.0032 (0.0010) | 0.001 |
| Language (0–9 points) | −0.0406 (0.0280) | 0.146 | 0.0009 (0.0011) | 0.413 | −0.0763 (0.0205) | <0.001 | 0.0019 (0.0008) | 0.019 |
BMI indicates body mass index; and MMSE, Mini‐Mental State Examination.
The mixed model is adjusted for study center, age, and education.
Time is modeled as a continuous variable to reflect changes in MMSE subscores per year for an individual in the reference group (with a BMI level of 18.5 kg/m2).
The term of BMI×time represents the additional effect of a 1‐U increase in BMI on annual changes in MMSE subscores for an individual in the reference group.
Table 7.
Multivariate‐Adjusted Associations Between Baseline BMI and Longitudinal Changes in Cognitive Domains Represented by MMSE Subscores
| MMSE Subscoresa | Men | Women | ||||||
|---|---|---|---|---|---|---|---|---|
| Timeb | BMI×Timec | Timeb | BMI×Timec | |||||
| Coefficient β (SE) | P Value | Coefficient β (SE) | P Value | Coefficient β (SE) | P Value | Coefficient β (SE) | P Value | |
| Orientation to time (0–5 points) | −0.1854 (0.0306) | <0.001 | 0.0051 (0.0012) | <0.001 | −0.2149 (0.0332) | <0.001 | 0.0025 (0.0013) | 0.047 |
| Orientation to place (0–5 points) | −0.0160 (0.0110) | 0.145 | 0.0001 (0.0004) | 0.950 | −0.1015 (0.0204) | <0.001 | 0.0020 (0.0008) | 0.014 |
| Registration (0–3 points) | −0.0375 (0.0167) | 0.025 | 0.0009 (0.0007) | 0.177 | −0.0497 (0.0175) | 0.005 | 0.0004 (0.0007) | 0.561 |
| Attention/calculation (0–5 points) | −0.1063 (0.0437) | 0.015 | 0.0034 (0.0018) | 0.059 | −0.1081 (0.0402) | 0.007 | 0.0033 (0.0016) | 0.033 |
| Recall (0–3 points) | −0.0535 (0.0310) | 0.084 | 0.0034 (0.0013) | 0.008 | −0.0694 (0.0265) | 0.009 | 0.0031 (0.0010) | 0.003 |
| Language (0–9 points) | −0.0344 (0.0292) | 0.239 | 0.0007 (0.0012) | 0.544 | −0.0747 (0.0210) | <0.001 | 0.0018 (0.0008) | 0.025 |
BMI indicates body mass index; and MMSE, Mini‐Mental State Examination.
The mixed model is adjusted for study center, age, education, smoking, alcohol drinking, marital status, living conditions, physical activity, Patient Health Questionnaire‐9 scores, systolic blood pressure at baseline, mean systolic blood pressure during the follow‐up, estimated glomerular filtration rate, new stroke, diabetes mellitus, and treatment allocation.
Time is modeled as a continuous variable to reflect changes in MMSE subscores per year for an individual in the reference group (with a BMI level of 18.5 kg/m2).
The term of BMI×time represents the additional effect of a 1‐U increase in BMI on annual changes in MMSE subscores for an individual in the reference group.
Baseline Adiposity Measures and Cognitive Impairment
A total of 25.9% of the patients developed cognitive impairment, including 1037 men (15.3%) and 3317 women (33.1%). Among them, 159 (3.7%) had “cognitive impairment with stroke,” and the remaining 4195 had “other cognitive impairment.” Analysis using the multivariable Cox proportional hazards model showed a decline in relative risk for every increasing BMI category after adjustment for study center, age, and education only (P<0.001; Table 8). The highest risk was seen in the underweight group (men: HR, 1.37; 95% CI, 1.02–1.85; women: HR, 1.24; 95% CI, 1.00–1.54). After controlling for known cardiovascular risk factors, there was a nonsignificant trend for increasing risk in patients who were underweight (men: HR, 1.25; 95% CI, 0.90–1.76; women: HR, 1.21; 95% CI, 0.96–1.53). Being overweight or obese was significantly associated with reduced risk of cognitive impairment relative to normal weight among both men (overweight: HR, 0.78; 95% CI, 0.67–0.91; obese: HR, 0.75; 95% CI, 0.60–0.94) and women (overweight: HR, 0.87; 95% CI, 0.80–0.95; obese: HR, 0.82; 95% CI, 0.74–0.91). The reduction in risk was exclusively observed in patients with “other cognitive impairment” (P<0.001). Adiposity did not alter the risk of cognitive impairment with stroke (men: HR, 0.95; 95% CI, 0.87–1.04; women: HR, 0.97; 95% CI, 0.91–1.04). When BMI was modeled as a continuous variable, the penalized spline plots showed an approximately linear pattern in the effect of BMI on cognitive impairment in men, with a 4% decrease in risk for a 1‐U increase in BMI (HR, 0.96; 95% CI, 0.94–0.98). The association was seemingly weaker, but statistically significant, in women, and a threshold effect was observed at a BMI >28.7 kg/m2 (Figure 3). Similar findings were observed for the association between WC and cognitive impairment (Table S8 and Figure S1). Threshold analysis revealed a clear cutoff for WC in relation to cognitive impairment in women, with the association between increasing WC levels and an ever‐decreasing risk reaching a plateau at >92 cm.
Table 8.
Multivariable Cox Proportional Hazards Model for Cognitive Impairment According to BMI Categories at Baseline
| Variables | Cognitive Impairment | Cognitive Impairment With Stroke | Other Cognitive Impairment | ||||||
|---|---|---|---|---|---|---|---|---|---|
| Events, % | Model 1 | Model 2 | Events, % | Model 1 | Model 2 | Events, % | Model 1 | Model 2 | |
| Men | |||||||||
| BMI, kg/m2 | 1037 (15.3) | 0.96 (0.94–0.97) | 0.96 (0.94–0.98) | 66 (1.0) | 0.96 (0.88–1.04) | 0.95 (0.87–1.04) | 971 (14.4) | 0.96 (0.94–0.98) | 0.96 (0.94–0.99) |
| BMI category, kg/m2 | |||||||||
| <18.5 | 49 (23.4) | 1.37 (1.02–1.85) | 1.25 (0.90–1.76) | 3 (1.4) | 2.06 (0.61–6.98) | 2.66 (0.74–9.58) | 46 (22.0) | 1.34 (0.99–1.82) | 1.23 (0.87–1.74) |
| 18.5–23.9 | 544 (18.0) | 1.00 (Ref) | 1.00 (Ref) | 28 (0.9) | 1.00 (Ref) | 1.00 (Ref) | 516 (17.1) | 1.00 (Ref) | 1.00 (Ref) |
| 24–27.9 | 331 (13.1) | 0.75 (0.65–0.86) | 0.78 (0.67–0.91) | 29 (1.1) | 1.11 (0.65–1.89) | 1.01 (0.55–1.87) | 302 (11.9) | 0.73 (0.63–0.84) | 0.76 (0.65–0.89) |
| ≥28 | 113 (11.3) | 0.75 (0.61–0.93) | 0.75 (0.60–0.94) | 6 (0.6) | 0.65 (0.26–1.59) | 0.55 (0.20–1.54) | 107 (10.7) | 0.76 (0.61–0.94) | 0.78 (0.62–0.98) |
| P value for trend | <0.001 | <0.001 | 0.333 | 0.171 | <0.001 | <0.001 | |||
| Women | |||||||||
| BMI, kg/m2 | 3317 (33.1) | 0.98 (0.97–0.99) | 0.98 (0.97–0.99) | 93 (0.9) | 1.03 (0.97–1.08) | 0.97 (0.91–1.04) | 3224 (32.1) | 0.98 (0.97–0.99) | 0.98 (0.97–0.99) |
| BMI category, kg/m2 | |||||||||
| <18.5 | 89 (46.6) | 1.24 (1.00–1.54) | 1.21 (0.96–1.53) | 3 (1.6) | 2.24 (0.67–7.46) | 2.63 (0.78–8.91) | 86 (45.0) | 1.22 (0.98–1.52) | 1.18 (0.93–1.50) |
| 18.5–23.9 | 1224 (36.5) | 1.00 (Ref) | 1.00 (Ref) | 28 (0.8) | 1.00 (Ref) | 1.00 (Ref) | 1196 (35.7) | 1.00 (Ref) | 1.00 (Ref) |
| 24–27.9 | 1279 (31.3) | 0.87 (0.80–0.94) | 0.87 (0.80–0.95) | 38 (0.9) | 1.02 (0.62–1.67) | 0.83 (0.48–1.44) | 1241 (30.4) | 0.86 (0.80–0.94) | 0.87 (0.80–0.95) |
| ≥28 | 725 (30.1) | 0.87 (0.79–0.95) | 0.82 (0.74–0.91) | 24 (1.0) | 1.08 (0.62–1.89) | 0.81 (0.43–1.50) | 701 (29.1) | 0.86 (0.78–0.95) | 0.83 (0.74–0.92) |
| P value for trend | <0.001 | <0.001 | 0.897 | 0.238 | <0.001 | <0.001 | |||
For the multivariate‐adjusted hazard ratios, data are adjusted for study center, age (continuous variable), and education (illiteracy vs primary school vs middle school and higher) in model 1; and additional adjustment for smoking (never smoking vs ever smoking vs current smoking), alcohol drinking (never drinking vs ever drinking vs current drinking), marital status (married vs never married vs other), living conditions (low vs moderate vs high), physical activity (low vs moderate vs high), Patient Health Questionnaire‐9 scores (continuous variable), systolic blood pressure at baseline (continuous variable), mean systolic blood pressure during the follow‐up (continuous variable), estimated glomerular filtration rate (continuous variable), new stroke (yes vs no, adjusted for all cognitive impairment only), diabetes mellitus (yes vs no), and treatment allocation (enalapril–folic acid vs enalapril) in model 2. BMI indicates body mass index.
Figure 3.
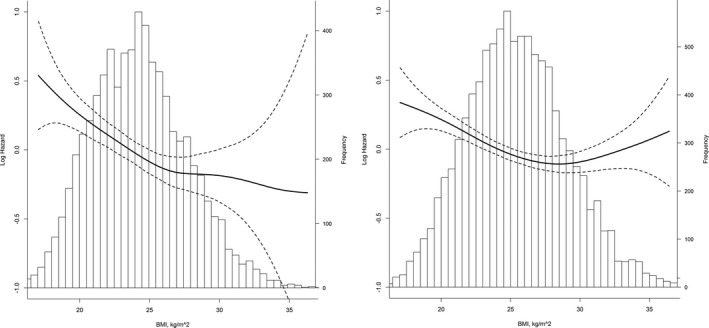
Relationship between body mass index (BMI) at baseline and risk of cognitive impairment by penalized splines. The relative risk of cognitive impairment in association with BMI is shown in men (A) and women (B). Solid lines represent the log hazard ratios for BMI as a continuous variable, and dashed lines represent the 95% confidence intervals. The graphs are truncated at the 1st and 99th percentiles of BMI. Analyses are adjusted for study center, age, education, smoking status, alcohol drinking, marital status, living conditions, physical activity, Patient Health Questionnaire‐9 scores, systolic blood pressure (SBP) at baseline, mean SBP during the follow‐up, estimated glomerular filtration rate, new stroke, diabetes mellitus at baseline, new diabetes mellitus during the follow‐up, and treatment allocation.
Effect Modification by Important Covariates
Stratified analyses showed that the inverse relations between BMI and the risk of cognitive impairment are consistent for all strata (Figure S2). There was no significant interaction between BMI (as a continuous variable) and important covariates stratified by sex (P>0.05 for interaction for all), except that the diabetes mellitus status had a moderate effect modification in women (P=0.041 for interaction). Furthermore, we observed no apparent heterogeneity in the effect of BMI between the men with or without smoking (P=0.487 for interaction; data not shown).
Sensitivity Analyses
The imputation of missing variables did not affect the results (Table S9). The results were virtually unchanged after excluding patients with chronic kidney disease at baseline, those with new stroke during the follow‐up, or those with cognitive impairment at the 1‐year follow‐up (Figure S3). When using ethnic‐specific cut points for adiposity categories, the effect on cognitive impairment remained statistically significant (Figure S4).
Discussion
Despite overwhelming evidence linking obesity to a higher incidence of cognitive dysfunction in the general population, there is a particular paucity of data in hypertensive patients. Using the cohort of the CSPPT, we examined the hypothesis that obesity may confer protection against cognitive decline in hypertensive patients. Approximately one quarter of the study participants (25.9%) developed cognitive impairment during a median follow‐up duration of 4.5 years. The study has demonstrated that higher adiposity is associated with a decelerated decline in MMSE score in Chinese hypertensive adults. Notably, we observed a reduction in risk exclusively in patients with cognitive impairment attributable to causes other than stroke. We also report novel information regarding the effect of adiposity on several cognitive subdomains. These findings are generally supported by analysis using WC as a measure for adiposity, which is more accurate in evaluating the fat distribution and considered by some investigators to be superior in reflecting metabolic characteristics.24, 25, 26
Although our previous analysis from CSPPT and other prior studies have already described the survival advantage in obese patients with hypertension, it remains to be established whether obesity confers a benefit in neurocognitive abilities of hypertensive adults. The present study represents the first attempt to evaluate the issue using a longitudinal design in a large cohort of middle‐aged and elderly patients. The strengths of our study include large sample size and comprehensive adjustments for major demographic and vascular risk factors. Moreover, mixed models can account for the correlation of the repeated MMSE assessments appropriately and use all available data without the imputation of any missing values, compared with traditional methods. An early cross‐sectional study of 184 Japanese hypertensive patients (aged 61–94 years) revealed that lower BMI (14.5–20.3 kg/m2) was a risk for cognitive impairment (odds ratio, 2.54; 95% CI, 1.13–5.73; P=0.02).27 Our analysis using the mixed‐effects regression models also uncovered a more rapid decline in MMSE score in men with a BMI <18.5 kg/m2. We further showed that overweight status and obesity were associated with smaller cognitive decline and a decreased risk of cognitive impairment. In addition, this benefit in cognitive function was independent of comorbidities, treatment allocation, and other factors. Our results lend further support to the obesity paradox that patients with established CVDs benefit from increased BMI. Previous studies reporting the obesity paradox are limited by relying predominantly on BMI assessment. Thus, our study goes 1 step further by demonstrating that consistent results extend beyond BMI to a marker of abdominal adiposity.
Our results provide statistically reliable evidence for true cognitive change. The magnitude of the effect of obesity status on MMSE changes in the current study was similar to the time effect during follow‐up. Moreover, we also applied a more rigorous definition of cognitive impairment to exclude small changes (eg, measurement error, practice effect, and normal aging) in MMSE score (Data S1 and Figure S5). The relationship between adiposity and specific subtypes of cognitive impairment identified in the current study was similar to the findings from the Kame Project study.28 However, the outcome definition herein may insufficiently reflect the actual subtypes of vascular cognitive impairment. The relatively few events also have limited power to confirm that the absence of the effect on “cognitive impairment with stroke” is a true consequence.
Nevertheless, the interpretation of our results presented herein requires caution. There has been previous evidence of a U‐shaped or curvilinear association between BMI and dementia and cardiovascular events.29, 30, 31 Although we observed a threshold effect (>28.7 kg/m2) in female patients, we failed to observe an increased risk caused by further higher degree of obesity (eg, grade 2 or 3 obesity; BMI, ≥35 kg/m2) because of the limited numbers of patients in the extreme groups. Our results still could be the benefit effects of the active BP control in the CSPPT treatment period. The obese people in our study received a higher number of concomitant antihypertensive drugs, which may attenuate the deleterious effects of obesity; however, the proportion was relatively small (Figure S6). Moreover, the mean reduction of BP was comparable across different BMI groups, and obese men and overweight women even had a significantly lower reduction in SBP when compared with normal‐weight patients (Figure S7). Meanwhile, covariate adjustment was made for both baseline and timed‐average SBP.
The finding that underweight was associated with an accelerated rate of cognitive decline is consistent with the observations of the CPRD (Clinical Practice Research Datalink) study, which identified a 34% excess risk of dementia in underweight people.32 Literature available reveals that higher risks of cognitive dysfunction associated with underweight pertain to elderly people in the general population and have been attributed to preclinical dementia and other preexisting illnesses.33, 34 Several perspectives from our study could, to some extent, limit this bias because of reverse causality: (1) the detrimental effect of low body weight existed in younger patients (aged <65 years) but not in elderly patients and (2) excluding patients with cognitive impairment at 1 year of follow‐up and other existing diseases at baseline did not affect the results. Nevertheless, a long‐term follow‐up study with a series of adiposity measures before disease onset and with dementia as the primary end point is needed to eliminate this bias. The recently reported results from the ARIC (Atherosclerosis Risk in Communities) study already demonstrate that premorbid obesity still offers a significant survival advantage in patients with incident heart failure, and weight loss attributable to disease progression may not completely explain the protective effect of higher BMI.10
The age of people at which obesity status is assessed may significantly modify the relationship between adiposity and cognition.28, 35, 36 Several studies report that being overweight in later life may be associated with reduced risk of dementia. These studies enrolled the general population >65 years, whereas our study cohort was a mean age of 60.1±7.4 years (range, 45–75 years). Our Cox regression analysis of sex‐specific risk of cognitive impairment related to baseline BMI and WC categories, according to age tertiles, demonstrated the same pattern in the oldest (aged ≥65 years) and the middle tertile (aged 55–64 years) of patients (Figure S8). Among patients in the youngest tertile (aged <55 years), the effect was consistently smaller; we found age does not significantly modify the relationship between adiposity and cognitive impairment, with no evidence of heterogeneity (P>0.05 for interaction). However, we observed a more prominent effect in older women (P<0.05 for interaction) when age was stratified by 60 years (Table S10). Given a rapid decline in estrogen production in postmenopausal women, estrone secreted by adipose tissues becomes a primary source of endogenous estrogen, which increases in obesity status and may mediate potentially beneficial effects.37 Our results, mainly from the subgroup analyses, may not be as reliable because of the effect of sample size. Future studies having obesity measures at different ages in the same people are needed to validate the possible difference across age spectrums.
Whether the obesity paradox is a product of true biological processes or simply originates from methodological biases has been intensely debated in the clinical and epidemiologic literature. The obesity status of hypertensive patients in our cohort may reflect a specific disease subtype and a metabolic reserve to protect against hypertension and age‐related cognitive decline.10, 38 Although the precise mechanisms underlying the obesity paradox are not elucidated, adipokines, including leptin and insulin‐like growth factor, are neuroprotective; obesity may even protect structural brain integrity.39, 40, 41 Furthermore, abdominal and peripheral subcutaneous adipose tissues were regarded as the nonpathogenic and benign fat depots, and may prevent excessive release of free fatty acids and subsequent ectopic fat deposition, including visceral fat accumulation.42, 43, 44 The imaging technologies used to assess the metabolic properties of fat depositions (eg, abdominal computed tomography/magnetic resonance imaging and dual‐energy x‐ray absorptiometry) are necessary for future studies. On the other hand, selection of patients based on the CVD status from an unbiased general population may generate selection bias. For instance, previous evidence suggested that obese patients receive more optimal treatment for comorbidities at an earlier stage of the disease before enrollment.45 The CSPPT participants were recruited mainly from the rural areas in China, where patients have inadequate resources to receive optimal therapy. Our recent study has confirmed a low use rate of lipid‐lowering drugs (0.8%), glucose‐lowering drugs (1.6%), and antiplatelet drugs (3%) in the CSPPT population.16 Besides, nonobese patients who develop a chronic disease may be more likely than their obese counterparts to have other unmeasured harmful risk factors related to cognitive impairment.46 Our current analyses with a high incidence of cognitive impairment allow us to conduct various subgroup analyses with sufficient adjustment for potentially confounding variables; yet, we cannot completely rule out the possibility of residual confounders (eg, inflammatory biomarkers).
Several limitations of the current study should be mentioned. First, our study is a post hoc analysis in which the cognition end point was not prespecified. However, this should not change the reliability of our results because MMSE measurements coincided with study visits over the trial and were conducted by trainers who were blinded to the present objective. Second, the study cohort lacked baseline cognitive measurement. However, when we used available MMSE scores at the 1‐year follow‐up as the surrogate in a subsample, the observed results persisted. Third, the MMSE test is mainly used as a limited screening tool and may have a poor sensitivity in the detection of mild cognitive impairment. However, acknowledging that our study population came mainly from the rural areas in China, where resources are limited and people have limited or no formal education, the MMSE test may be more appropriate and clinically convenient for the target population than comprehensive neuropsychological assessments.47 Furthermore, several previous studies have provided the support for the use of this test for cognitive assessment and definition according to MMSE scores.21, 48 Finally, our study was limited to relatively homogeneous patients with hypertension in China, and the generalizability of our findings requires confirmation in more cohort studies of ethnically diverse adults.
Conclusion
We report that higher adiposity is independently associated with slower cognitive decline in Chinese hypertensive adults, especially in elderly people. The link between underweight and the unfavorable prognosis of cognition is particularly relevant to routine medical management of hypertension and may deserve more attention.
Author Contributions
K. Wang and Xu had full access to all study data and had final responsibility for the integrity of the data and the accuracy of the data analysis. Study concept and design: K. Wang, B. Wang, Xu, and Huo. Acquisition, analysis, or interpretation of data: All authors. Drafting of the article: K. Wang and J. Zhang. Critical revision of the article for important intellectual content: All authors. Statistical analysis: K. Wang and J. Zhang. Obtained funding: K. Wang, B. Wang, Xu, and Huo. Administrative, technical, or material support: K. Wang and Huo. Study supervision: K. Wang and Xu.
Sources of Funding
This work was supported by Anhui Province Key Laboratory of Cognition and Neuropsychiatric Disorders, China; Collaborative Innovation Center for Neuropsychiatric Disorders and Mental Health, Anhui Province, China; Shenzhen AUSA Pharmed Co Ltd and national, provincial, and private funding, including from National Key Research and Development Program of China (2016YFC1300600); The Major State Basic Research Development Program of China (973 program, grant 2102 CB517703); The National Science and Technology Major Projects Specialized for “Major New Drugs Innovation and Development” during the 12th Five‐Year Plan Period: China Stroke Primary Prevention Trial (grant zx09101105); Clinical Center (grant zx09401013); Projects of National Natural Science Foundation of China (grants 81473052 and 81441091); National Clinical Research Center for Kidney Disease, State Key Laboratory for Organ Failure Research, Renal Division, Nanfang Hospital, Nanfang Medical University, Guangzhou, China; and research grants from the Department of Development and Reform, Shenzhen Municipal Government (grant SFG 20201744). The funding organizations/sponsor (Shenzhen AUSA Pharmed Co Ltd) participated in the study design but had no role in the conduct of the study; collection, management, analysis, and interpretation of the data; preparation, review, or approval of the article or the decision to submit the article for publication.
Disclosures
Dr K. Wang reports research grants from Anhui Province Key Laboratory of Cognition and Neuropsychiatric Disorders, China, Collaborative Innovation Center of Neuropsychiatric Disorders and Mental Health, Anhui Province, National Key Research and Development Program of China and nonfinancial support from Shenzhen AUSA Research Institute. Dr Huo reports research grants from the National Major Scientific and Technological Special Project and nonfinancial support from Shenzhen AUSA Research Institute. Dr B. Wang reports research grants from the National Natural Science Foundation of China, Department of Science and Innovation, and Shenzhen Municipal Government, and consulting fees from Shenzhen AUSA Research Institute. Dr Xu reports research grants from The Ministry of Science and Technology of China, The Major State Basic Research Development Program of China, Department of Development and Reform, Shenzhen Municipal Government, Department of Science and Innovation, Shenzhen Municipal Government, and personal fees from Shenzhen AUSA Pharmed Co Ltd. In addition, Dr Xu has a Chinese patent: 20060816 licensed. The remaining authors have no disclosure to report.
Supporting information
Data S1. Supplemental Methods
Table S1. Characteristics of Included and Excluded Participants in the Present Analysis
Table S2. Demographic and Clinical Characteristics of the Study Participants According to Categories of BMI and Sex
Table S3. Effects of Continuous WC Levels on Longitudinal Change in MMSE Score*
Table S4. Effects of Categorical WC Status on Longitudinal Change in MMSE Score*
Table S5. Multivariate‐Adjusted Associations Between WC at Baseline and Change in MMSE Score During the Follow‐Up*
Table S6. Associations Between Baseline WC and Longitudinal Changes in Cognitive Domains Represented by MMSE Subscores*
Table S7. Multivariate‐Adjusted Associations Between Baseline WC and Changes in Cognitive Domains Represented by MMSE Subscores*
Table S8. Multivariable Cox Proportional Hazards Model for Cognitive Impairment According to WC at Baseline*
Table S9. Cox Proportional Hazard Model for the Risk (Hazard Ratios and 95% CIs) of Cognitive Impairment Related to Adiposity Measures Before and After Imputation of Missing Data*
Table S10. Cox Regression Analysis for Multivariable‐Adjusted Risk of Cognitive Impairment Related to Baseline Adiposity Measures Stratified by Age (Age <60 Years vs ≥60 years)*
Figure S1. Relationship between WC at baseline and risk of cognitive impairment by penalized splines.
Figure S2. Relationship between BMI at baseline and risk of cognitive impairment in exploratory subgroups.
Figure S3. Sensitivity analyses according to baseline BMI and WC after excluding participants with chronic kidney diseases (CKD) at baseline, new stroke during the follow‐up and cognitive impairment at the 1‐year follow.
Figure S4. Sensitivity analyses according to baseline BMI and WC categories using other ethnic‐specific cut‐points.
Figure S5. Relationship between BMI and WC at baseline and risk of cognitive impairment when using alternative definition.
Figure S6. Number of concomitant antihypertensive drugs according to treatment allocation and BMI categories at final follow‐up visit.
Figure S7. Blood pressures at baseline and during the follow‐up by baseline BMI categories.
Figure S8. Cox regression analysis of sex‐specific risk of cognitive impairment related to baseline BMI and WC categories according to age tertiles.
Acknowledgments
We thank all study participants and study staff of the CSPPT (China Stroke Primary Prevention Trial). We thank Xinglin Chen, MD (Key Laboratory of Geriatrics of Health Ministry, Department of Geriatrics, Union Hospital, Tongji Medical College, Huazhong University of Science and Technology, Wuhan, China), Jie Liu, MD (Department of Vascular Surgery, Clinical Division of Surgery, Chinese PLA General Hospital, Beijing, China), and Haibo Li, MS (Institute of Biomedicine, Anhui Medical University, Hefei, China) for the advice on the statistical analysis of this study. No compensation was received for these contributions.
(J Am Heart Assoc. 2017;6:e005561 DOI: 10.1161/JAHA.117.005561.)
References
- 1. WHO . Obesity and overweight fact sheet number 311. Updated January, 2015. Geneva: World Health Organization; 2015. http://www.who.int/mediacentre/factsheets/fs311/en. Accessed March 23, 2015. [Google Scholar]
- 2. Prince M, Wilmo A, Guerchet M, Ali GC, Wu YT, Prina M. World Alzheimer Report 2015: The Global Impact of Dementia. London, England: Alzheimer's Disease International; 2015. [Google Scholar]
- 3. Whitmer RA, Gunderson EP, Barrett‐Connor E, Quesenberry CP Jr, Yaffe K. Obesity in middle age and future risk of dementia: a 27 year longitudinal population based study. BMJ. 2005;330:1360. [DOI] [PMC free article] [PubMed] [Google Scholar]
- 4. Loef M, Walach H. Midlife obesity and dementia: meta‐analysis and adjusted forecast of dementia prevalence in the United States and China. Obesity (Silver Spring). 2013;21:E51–E55. [DOI] [PubMed] [Google Scholar]
- 5. Cournot M, Marquie JC, Ansiau D, Martinaud C, Fonds H, Ferrieres J, Ruidavets JB. Relation between body mass index and cognitive function in healthy middle‐aged men and women. Neurology. 2006;67:1208–1214. [DOI] [PubMed] [Google Scholar]
- 6. Dahl A, Hassing LB, Fransson E, Berg S, Gatz M, Reynolds CA, Pedersen NL. Being overweight in midlife is associated with lower cognitive ability and steeper cognitive decline in late life. J Gerontol A Biol Sci Med Sci. 2010;65:57–62. [DOI] [PMC free article] [PubMed] [Google Scholar]
- 7. Uretsky S, Messerli FH, Bangalore S, Champion A, Cooper‐Dehoff RM, Zhou Q, Pepine CJ. Obesity paradox in patients with hypertension and coronary artery disease. Am J Med. 2007;120:863–870. [DOI] [PubMed] [Google Scholar]
- 8. Vemmos K, Ntaios G, Spengos K, Savvari P, Vemmou A, Pappa T, Manios E, Georgiopoulos G, Alevizaki M. Association between obesity and mortality after acute first‐ever stroke: the obesity‐stroke paradox. Stroke. 2011;42:30–36. [DOI] [PubMed] [Google Scholar]
- 9. Khalid U, Ather S, Bavishi C, Chan W, Loehr LR, Wruck LM, Rosamond WD, Chang PP, Coresh J, Virani SS, Nambi V, Bozkurt B, Ballantyne CM, Deswal A. Pre‐morbid body mass index and mortality after incident heart failure: the ARIC Study. J Am Coll Cardiol. 2014;64:2743–2749. [DOI] [PMC free article] [PubMed] [Google Scholar]
- 10. Carnethon MR, De Chavez PJ, Biggs ML, Lewis CE, Pankow JS, Bertoni AG, Golden SH, Liu K, Mukamal KJ, Campbell‐Jenkins B, Dyer AR. Association of weight status with mortality in adults with incident diabetes. JAMA. 2012;308:581–590. [DOI] [PMC free article] [PubMed] [Google Scholar]
- 11. Vashistha T, Mehrotra R, Park J, Streja E, Dukkipati R, Nissenson AR, Ma JZ, Kovesdy CP, Kalantar‐Zadeh K. Effect of age and dialysis vintage on obesity paradox in long‐term hemodialysis patients. Am J Kidney Dis. 2014;63:612–622. [DOI] [PMC free article] [PubMed] [Google Scholar]
- 12. Hakimi AA, Furberg H, Zabor EC, Jacobsen A, Schultz N, Ciriello G, Mikklineni N, Fiegoli B, Kim PH, Voss MH, Shen H, Laird PW, Sander C, Reuter VE, Motzer RJ, Hsieh JJ, Russo P. An epidemiologic and genomic investigation into the obesity paradox in renal cell carcinoma. J Natl Cancer Inst. 2013;105:1862–1870. [DOI] [PMC free article] [PubMed] [Google Scholar]
- 13. Nie W, Zhang Y, Jee SH, Jung KJ, Li B, Xiu Q. Obesity survival paradox in pneumonia: a meta‐analysis. BMC Med. 2014;12:61. [DOI] [PMC free article] [PubMed] [Google Scholar]
- 14. Wang J, Zhang L, Wang F, Liu L, Wang H; China National Survey of Chronic Kidney Disease Working Group . Prevalence, awareness, treatment, and control of hypertension in China: results from a national survey. Am J Hypertens. 2014;27:1355–1361. [DOI] [PMC free article] [PubMed] [Google Scholar]
- 15. Yang W, Li JP, Zhang Y, Fan FF, Xu XP, Wang BY, Xu X, Qin XH, Xing HX, Tang GF, Zhou ZY, Gu DF, Zhao D, Huo Y. Association between body mass index and all‐cause mortality in hypertensive adults: results from the China Stroke Primary Prevention Trial (CSPPT). Nutrients. 2016;8:E384. DOI: 10.3390/nu8060384. [DOI] [PMC free article] [PubMed] [Google Scholar]
- 16. Huo Y, Li J, Qin X, Huang Y, Wang X, Gottesman RF, Tang G, Wang B, Chen D, He M, Fu J, Cai Y, Shi X, Zhang Y, Cui Y, Sun N, Li X, Cheng X, Wang J, Yang X, Yang T, Xiao C, Zhao G, Dong Q, Zhu D, Wang X, Ge J, Zhao L, Hu D, Liu L, Hou FF; CSPPT Investigators . Efficacy of folic acid therapy in primary prevention of stroke among adults with hypertension in China: the CSPPT randomized clinical trial. JAMA. 2015;313:1325–1335. [DOI] [PubMed] [Google Scholar]
- 17. Zhou BF; Cooperative Meta‐Analysis Group of the Working Group on Obesity in C hina. Predictive values of body mass index and waist circumference for risk factors of certain related diseases in Chinese adults: study on optimal cut‐off points of body mass index and waist circumference in Chinese adults. Biomed Environ Sci. 2002;15:83–96. [PubMed] [Google Scholar]
- 18. Alberti KG, Eckel RH, Grundy SM, Zimmet PZ, Cleeman JI, Donato KA, Fruchart JC, James WP, Loria CM, Smith SC Jr; International Diabetes Federation Task Force on Epidemiology and Prevention; Hational Heart, Lung, and Blood Institute; American Heart Association; World Heart Federation; International Atherosclerosis Society; International Association for the Study of O besity. Harmonizing the metabolic syndrome: a joint interim statement of the International Diabetes Federation Task Force on Epidemiology and Prevention; National Heart, Lung, and Blood Institute; American Heart Association; World Heart Federation; International Atherosclerosis Society; and International Association for the Study of Obesity. Circulation. 2009;120:1640–1645. [DOI] [PubMed] [Google Scholar]
- 19. Folstein MF, Folstein SE, McHugh PR. “Mini‐mental state:” a practical method for grading the cognitive state of patients for the clinician. J Psychiatr Res. 1975;12:189–198. [DOI] [PubMed] [Google Scholar]
- 20. Zhang MY, Katzman R, Salmon D, Jin H, Cai GJ, Wang ZY, Qu GY, Grant I, Yu E, Levy P, Klauber MR, Liu WT. The prevalence of dementia and Alzheimer's disease in Shanghai, China: impact of age, gender, and education. Ann Neurol. 1990;27:428–437. [DOI] [PubMed] [Google Scholar]
- 21. Tzourio C, Anderson C, Chapman N, Woodward M, Neal B, MacMahon S, Chalmers J; PROGRESS Collaborative Group . Effects of blood pressure lowering with perindopril and indapamide therapy on dementia and cognitive decline in patients with cerebrovascular disease. Arch Intern Med. 2003;163:1069–1075. [DOI] [PubMed] [Google Scholar]
- 22. Spitzer RL, Kroenke K, Williams JB. Validation and utility of a self‐report version of PRIME‐MD: the PHQ primary care study: Primary Care Evaluation of Mental Disorders: Patient Health Questionnaire. JAMA. 1999;282:1737–1744. [DOI] [PubMed] [Google Scholar]
- 23. Levey AS, Stevens LA, Schmid CH, Zhang YL, Castro AF III, Feldman HI, Kusek JW, Eggers P, Van Lente F, Greene T, Coresh J. A new equation to estimate glomerular filtration rate. Ann Intern Med. 2009;150:604–612. [DOI] [PMC free article] [PubMed] [Google Scholar]
- 24. Jackson AS, Stanforth PR, Gagnon J, Rankinen T, Leon AS, Rao DC, Skinner JS, Bouchard C, Wilmore JH. The effect of sex, age and race on estimating percentage body fat from body mass index: the Heritage Family Study. Int J Obes Relat Metab Disord. 2002;26:789–796. [DOI] [PubMed] [Google Scholar]
- 25. Snijder MB, van Dam RM, Visser M, Seidell JC. What aspects of body fat are particularly hazardous and how do we measure them? Int J Epidemiol. 2006;35:83–92. [DOI] [PubMed] [Google Scholar]
- 26. Whitmer RA, Gustafson DR, Barrett‐Connor E, Haan MN, Gunderson EP, Yaffe K. Central obesity and increased risk of dementia more than three decades later. Neurology. 2008;71:1057–1064. [DOI] [PubMed] [Google Scholar]
- 27. Sakakura K, Hoshide S, Ishikawa J, Momomura S, Kawakami M, Shimada K, Kario K. Association of body mass index with cognitive function in elderly hypertensive Japanese. Am J Hypertens. 2008;21:627–632. [DOI] [PubMed] [Google Scholar]
- 28. Hughes TF, Borenstein AR, Schofield E, Wu Y, Larson EB. Association between late‐life body mass index and dementia: the Kame Project. Neurology. 2009;72:1741–1746. [DOI] [PMC free article] [PubMed] [Google Scholar]
- 29. Luchsinger JA, Patel B, Tang MX, Schupf N, Mayeux R. Measures of adiposity and dementia risk in elderly persons. Arch Neurol. 2007;64:392–398. [DOI] [PMC free article] [PubMed] [Google Scholar]
- 30. Flegal KM, Kit BK, Orpana H, Graubard BI. Association of all‐cause mortality with overweight and obesity using standard body mass index categories: a systematic review and meta‐analysis. JAMA. 2013;309:71–82. [DOI] [PMC free article] [PubMed] [Google Scholar]
- 31. Angeras O, Albertsson P, Karason K, Ramunddal T, Matejka G, James S, Lagerqvist B, Rosengren A, Omerovic E. Evidence for obesity paradox in patients with acute coronary syndromes: a report from the Swedish Coronary Angiography and Angioplasty Registry. Eur Heart J. 2013;34:345–353. [DOI] [PubMed] [Google Scholar]
- 32. Qizilbash N, Gregson J, Johnson ME, Pearce N, Douglas I, Wing K, Evans SJ, Pocock SJ. BMI and risk of dementia in two million people over two decades: a retrospective cohort study. Lancet Diabetes Endocrinol. 2015;3:431–436. [DOI] [PubMed] [Google Scholar]
- 33. Johnson DK, Wilkins CH, Morris JC. Accelerated weight loss may precede diagnosis in Alzheimer disease. Arch Neurol. 2006;63:1312–1317. [DOI] [PubMed] [Google Scholar]
- 34. Knopman DS, Edland SD, Cha RH, Petersen RC, Rocca WA. Incident dementia in women is preceded by weight loss by at least a decade. Neurology. 2007;69:739–746. [DOI] [PubMed] [Google Scholar]
- 35. Fitzpatrick AL, Kuller LH, Lopez OL, Diehr P, O'Meara ES, Longstreth WT Jr, Luchsinger JA. Midlife and late‐life obesity and the risk of dementia: cardiovascular health study. Arch Neurol. 2009;66:336–342. [DOI] [PMC free article] [PubMed] [Google Scholar]
- 36. Sturman MT, de Leon CF, Bienias JL, Morris MC, Wilson RS, Evans DA. Body mass index and cognitive decline in a biracial community population. Neurology. 2008;70:360–367. [DOI] [PubMed] [Google Scholar]
- 37. Patel BN, Pang D, Stern Y, Silverman W, Kline JK, Mayeux R, Schupf N. Obesity enhances verbal memory in postmenopausal women with Down syndrome. Neurobiol Aging. 2004;25:159–166. [DOI] [PubMed] [Google Scholar]
- 38. Nishihara R, VanderWeele TJ, Shibuya K, Mittleman MA, Wang M, Field AE, Giovannucci E, Lochhead P, Ogino S. Molecular pathological epidemiology gives clues to paradoxical findings. Eur J Epidemiol. 2015;30:1129–1135. [DOI] [PMC free article] [PubMed] [Google Scholar]
- 39. Lieb W, Beiser AS, Vasan RS, Tan ZS, Au R, Harris TB, Roubenoff R, Auerbach S, DeCarli C, Wolf PA, Seshadri S. Association of plasma leptin levels with incident Alzheimer disease and MRI measures of brain aging. JAMA. 2009;302:2565–2572. [DOI] [PMC free article] [PubMed] [Google Scholar]
- 40. Okereke O, Kang JH, Ma J, Hankinson SE, Pollak MN, Grodstein F. Plasma IGF‐I levels and cognitive performance in older women. Neurobiol Aging. 2007;28:135–142. [DOI] [PubMed] [Google Scholar]
- 41. Driscoll I, Gaussoin SA, Wassertheil‐Smoller S, Limacher M, Casanova R, Yaffe K, Resnick SM, Espeland MA. Obesity and structural brain integrity in older women: the Women's Health Initiative Magnetic Resonance Imaging Study. J Gerontol A Biol Sci Med Sci. 2016;71:1216–1222. [DOI] [PMC free article] [PubMed] [Google Scholar]
- 42. Golan R, Shelef I, Rudich A, Gepner Y, Shemesh E, Chassidim Y, Harman‐Boehm I, Henkin Y, Schwarzfuchs D, Ben Avraham S, Witkow S, Liberty IF, Tangi‐Rosental O, Sarusi B, Stampfer MJ, Shai I. Abdominal superficial subcutaneous fat: a putative distinct protective fat subdepot in type 2 diabetes. Diabetes Care. 2012;35:640–647. [DOI] [PMC free article] [PubMed] [Google Scholar]
- 43. Fox CS, Massaro JM, Hoffmann U, Pou KM, Maurovich‐Horvat P, Liu CY, Vasan RS, Murabito JM, Meigs JB, Cupples LA, D'Agostino RB Sr, O'Donnell CJ. Abdominal visceral and subcutaneous adipose tissue compartments: association with metabolic risk factors in the Framingham Heart Study. Circulation. 2007;116:39–48. [DOI] [PubMed] [Google Scholar]
- 44. Esmaillzadeh A, Mirmiran P, Moeini SH, Azizi F. Larger hip circumference independently contributed to reduced metabolic risks in Tehranian adult women. Int J Cardiol. 2006;108:338–345. [DOI] [PubMed] [Google Scholar]
- 45. Hainer V, Aldhoon‐Hainerova I. Obesity paradox does exist. Diabetes Care. 2013;36(suppl 2):S276–S281. [DOI] [PMC free article] [PubMed] [Google Scholar]
- 46. Lajous M, Banack HR, Kaufman JS, Hernan MA. Should patients with chronic disease be told to gain weight? The obesity paradox and selection bias. Am J Med. 2015;128:334–336. [DOI] [PMC free article] [PubMed] [Google Scholar]
- 47. Xu G, Meyer JS, Huang Y, Du F, Chowdhury M, Quach M. Adapting mini‐mental state examination for dementia screening among illiterate or minimally educated elderly Chinese. Int J Geriatr Psychiatry. 2003;18:609–616. [DOI] [PubMed] [Google Scholar]
- 48. Cukierman‐Yaffe T, Anderson C, Teo K, Gao P, Gerstein HC, Yusuf S; ONTARGET/TRANSCEND Investigators . Dysglycemia and cognitive dysfunction and ill health in people with high Cv risk: results from the ONTARGET/TRANSCEND studies. J Clin Endocrinol Metab. 2015;100:2682–2689. [DOI] [PubMed] [Google Scholar]
Associated Data
This section collects any data citations, data availability statements, or supplementary materials included in this article.
Supplementary Materials
Data S1. Supplemental Methods
Table S1. Characteristics of Included and Excluded Participants in the Present Analysis
Table S2. Demographic and Clinical Characteristics of the Study Participants According to Categories of BMI and Sex
Table S3. Effects of Continuous WC Levels on Longitudinal Change in MMSE Score*
Table S4. Effects of Categorical WC Status on Longitudinal Change in MMSE Score*
Table S5. Multivariate‐Adjusted Associations Between WC at Baseline and Change in MMSE Score During the Follow‐Up*
Table S6. Associations Between Baseline WC and Longitudinal Changes in Cognitive Domains Represented by MMSE Subscores*
Table S7. Multivariate‐Adjusted Associations Between Baseline WC and Changes in Cognitive Domains Represented by MMSE Subscores*
Table S8. Multivariable Cox Proportional Hazards Model for Cognitive Impairment According to WC at Baseline*
Table S9. Cox Proportional Hazard Model for the Risk (Hazard Ratios and 95% CIs) of Cognitive Impairment Related to Adiposity Measures Before and After Imputation of Missing Data*
Table S10. Cox Regression Analysis for Multivariable‐Adjusted Risk of Cognitive Impairment Related to Baseline Adiposity Measures Stratified by Age (Age <60 Years vs ≥60 years)*
Figure S1. Relationship between WC at baseline and risk of cognitive impairment by penalized splines.
Figure S2. Relationship between BMI at baseline and risk of cognitive impairment in exploratory subgroups.
Figure S3. Sensitivity analyses according to baseline BMI and WC after excluding participants with chronic kidney diseases (CKD) at baseline, new stroke during the follow‐up and cognitive impairment at the 1‐year follow.
Figure S4. Sensitivity analyses according to baseline BMI and WC categories using other ethnic‐specific cut‐points.
Figure S5. Relationship between BMI and WC at baseline and risk of cognitive impairment when using alternative definition.
Figure S6. Number of concomitant antihypertensive drugs according to treatment allocation and BMI categories at final follow‐up visit.
Figure S7. Blood pressures at baseline and during the follow‐up by baseline BMI categories.
Figure S8. Cox regression analysis of sex‐specific risk of cognitive impairment related to baseline BMI and WC categories according to age tertiles.