

Abstract
Background
Metabolomics is a promising tool of cardiovascular biomarker discovery. We systematically reviewed the literature on comprehensive metabolomic profiling in association with incident cardiovascular disease (CVD).
Methods and Results
We searched MEDLINE and EMBASE from inception to January 2016. Studies were eligible if they pertained to adult humans; followed an agnostic and/or comprehensive approach; used serum or plasma (not urine or other biospecimens); conducted metabolite profiling at baseline in the context of examining prospective disease; and included myocardial infarction, stroke, and/or CVD death in the CVD outcome definition. We identified 12 original articles (9 cohort and 3 nested case‐control studies); participant numbers ranged from 67 to 7256. Mass spectrometry was the predominant analytical method. The number and chemical diversity of metabolites were very heterogeneous, ranging from 31 to >10 000 features. Four studies used untargeted profiling. Different types of metabolites were associated with CVD risk: acylcarnitines, dicarboxylacylcarnitines, and several amino acids and lipid classes. Only tiny improvements in CVD prediction beyond traditional risk factors were observed using these metabolites (C index improvement ranged from 0.006 to 0.05).
Conclusions
There are a limited number of longitudinal studies assessing associations between comprehensive metabolomic profiles and CVD risk. Quantitatively synthesizing the literature is challenging because of the widely varying analytical tools and the diversity of methodological and statistical approaches. Although some results are promising, more research is needed, notably standardization of metabolomic techniques and statistical approaches. Replication and combinations of novel and holistic methodological approaches would move the field toward the realization of its promise.
Keywords: epidemiology, metabolomics, myocardial infarction, stroke
Subject Categories: Clinical Studies, Mechanisms, Metabolism, Myocardial Infarction, Ischemic Stroke
Clinical Perspective
What Is New?
Metabolomic profiling may identify metabolites potentially useful as clinical biomarkers for risk stratification and early identification of cardiovascular disease (CVD).
This systematic review showed that only a small number of longitudinal studies have used comprehensive profiling of circulating metabolites in plasma or serum to identify an early “metabolic fingerprint” for CVD.
Currently, metabolite species associated with higher CVD risk include acylcarnitines, dicarboxylacylcarnitines, as well as several amino acids such as phenylalanine and glutamate, and several lipid classes; however, the addition of these metabolites to CVD risk prediction already employing traditional risk factors yields only small improvements in predictions.
What Are the Clinical Implications?
Current data are promising, although metabolomics approaches and results appear to be heterogeneous.
The lack of robust replications is one of the main limitations in the existing literature due to heterogeneity in study designs, definitions of end points, features of the metabolomics platforms, and small sample sizes.
Additional studies are needed to identify clinically useful metabolic fingerprints for early identification of individuals at high CVD risk.
Introduction
Cardiovascular disease (CVD) continues to be a major global public health challenge. In 2013, coronary heart disease and stroke were globally the first and third leading causes of years of life lost, respectively.1 In the United States, 85 million adults currently have at least 1 type of CVD, and approximately half of them are under 60 years of age.2 Globally, population aging and growth have led to increasing numbers of CVD deaths.3 Moreover, premature cardiovascular mortality is estimated to continue at present rates or even to increase if policies to combat CVD risk factors are not successful.4 This scenario supports a strong need to improve CVD prevention.
A key factor in the fight against CVD is broadening our knowledge of the pathophysiological processes of this complex disease. Among the “omics” sciences, metabolomics has brought a paradigm shift to metabolic research. Metabolomics is the identification and quantification of small molecules that reflect the state of the organism at a particular moment in time. Currently, high‐throughput technologies allow the quantification of hundreds of circulating metabolites across multiple pathways in a single measurement. This approach is advantageous because it is not limited to a single enzymatic reaction or pathway; rather, it captures the complexity of metabolic networks. Metabolomics has considerably increased interest in metabolism across cardiovascular research.5
Large‐scale metabolomic profiling, including “metabolome‐wide” studies, may identify metabolic changes that precede irreversible organ damage and the appearance of disease and thereby may lead to the early identification of individuals at high CVD risk. For this reason the search for metabolites that could be used as clinical biomarkers is probably 1 of the most interesting aspects of metabolomics in CVD research.6 The identification of metabolomic risk profiles has the potential to improve risk stratification and early identification of CVD. In fact, metabolomics and its sister science, lipidomics, are among the newest approaches in the search for novel biomarkers.7 Single biomarkers are no longer sufficient to interpret or characterize complex biological phenomena, and new metabolomic approaches recognize the importance of characterizing the interrelation of metabolites—the metabolic “fingerprint” of disease and preclinical disease states. An inherent interest in using metabolomics in cardiovascular medicine is also driven by the hypothesis that metabolomics findings may lead to a better understanding of the pathophysiology and biological mechanisms involved in the genesis of clinical CVD events. Such an understanding would pave the way to new, evidence‐based approaches in preventing and managing CVD.
Comprehensive metabolomic profiling applied to CVD is still in its relative infancy.8, 9 Currently, there is no single approach that provides comprehensive coverage of the human metabolome, and many approaches have been used alongside a wide range of analytical platforms, each requiring specific sample preparation, approaches (eg, targeted versus untargeted), and post‐data acquisition statistical methods.10
Given the wide variety of metabolomic profiling approaches, in this systematic review, we aimed to assess and summarize existing literature on comprehensive profiling of circulating metabolites, following an agnostic or hypothesis‐free approach, and incident CVD, focusing our review on analytical methods, metabolites assessed and associated with incident CVD risk, and the predictive value of these metabolites.
Methods
The review protocol was registered in PROSPERO International Prospective Register of Systematic Reviews (crd.york.ac.uk/prospero/index.asp Identifier: CRD42015015594). This systematic review was performed according to the MOOSE (Meta‐analysis Of Observational Studies in Epidemiology) checklist11 (Table 1).
Table 1.
MOOSE Checklist for Meta‐Analyses of Observational Studies11
| Item No. | Recommendation | Reported on Page No. |
|---|---|---|
| Reporting of background should include | ||
| 1 | Problem definition | 1‐2 |
| 2 | Hypothesis statement | n/a |
| 3 | Description of study outcome(s) | 2 |
| 4 | Type of exposure or intervention used | 2 |
| 5 | Type of study designs used | 2 |
| 6 | Study population | 2 |
| Reporting of search strategy should include | ||
| 7 | Qualifications of searchers (eg, librarians and investigators) | 2 |
| 8 | Search strategy, including time period included in the synthesis and key words | 2, Table 2 |
| 9 | Effort to include all available studies, including contact with authors | 2 |
| 10 | Databases and registries searched | 2 |
| 11 | Search software used, name and version, including special features used (eg, explosion) | 2, Table 2 |
| 12 | Use of hand searching (eg, reference lists of obtained articles) | 2 |
| 13 | List of citations located and those excluded, including justification | Figure |
| 14 | Method of addressing articles published in languages other than English | 2 |
| 15 | Method of handling abstracts and unpublished studies | n/a |
| 16 | Description of any contact with authors | n/a |
| Reporting of methods should include | ||
| 17 | Description of relevance or appropriateness of studies assembled for assessing the hypothesis to be tested | 2, 4 |
| 18 | Rationale for the selection and coding of data (eg, sound clinical principles or convenience) | 4 |
| 19 | Documentation of how data were classified and coded (eg, multiple raters, blinding, and interrater reliability) | 2, 4 |
| 20 | Assessment of confounding (eg, comparability of cases and controls in studies where appropriate) | n/a |
| 21 | Assessment of study quality, including blinding of quality assessors, stratification, or regression on possible predictors of study results | n/a |
| 22 | Assessment of heterogeneity | n/a |
| 23 | Description of statistical methods (eg, complete description of fixed or random effects models, justification of whether the chosen models account for predictors of study results, dose‐response models, or cumulative meta‐analysis) in sufficient detail to be replicated | n/a |
| 24 | Provision of appropriate tables and graphics | 4 |
| Reporting of results should include | ||
| 25 | Graphic summarizing individual study estimates and overall estimate | n/a |
| 26 | Table giving descriptive information for each study included | Table 3 |
| 27 | Results of sensitivity testing (eg, subgroup analysis) | n/a |
| 28 | Indication of statistical uncertainty of findings | n/a |
| Reporting of discussion should include | ||
| 29 | Quantitative assessment of bias (eg, publication bias) | n/a |
| 30 | Assessment of quality of included studies | n/a |
| 31 | Justification for exclusion (eg, exclusion of non‐English‐language citations) | 16, 19, 20 |
| Reporting of conclusions should include | ||
| 32 | Consideration of alternative explanations for observed results | 20 |
| 33 | Generalization of the conclusions (ie, appropriate for the data presented and within the domain of the literature review) | 20 |
| 34 | Guidelines for future research | 20 |
| 35 | Disclosure of funding source | 23, 20, 21 |
n/a indicates not available.
Data Sources and Search Strategies
We conducted a comprehensive search in MEDLINE (via Ovid and PubMed) and EMBASE from inception through December 2016. Our search strategy included medical subject headings and key terms related to metabolomics and CVD (Table 2). The search in EMBASE was limited to English, Catalan, Czech, French, German, Italian, Portuguese, Slovak, or Spanish, reflecting the competencies of the first authors. No language limits were set in MEDLINE. We also manually searched references in relevant articles that were identified during screening.
Table 2.
Search Strategy and Terms
| Search Engine | Search Expression |
|---|---|
| PubMed | (“metabolome”[MeSH Terms] OR “metabolomics”[MeSH Terms] OR metabolo* [All Fields] OR metabonom* [All Fields] OR “metabolite network*” [All Fields] OR “metabolite profile*” [All Fields] OR lipidom* [All Fields]) AND “Cardiovascular Diseases”[MeSH] AND (“Magnetic Resonance Spectroscopy”[MeSH] OR “High‐Throughput Screening Assays”[MeSH] OR “Chromatography”[MeSH] OR “Mass Spectrometry”[MeSH]) |
| EMBASE | ‘metabolome’/exp OR ‘metabolomics’/exp OR metabolom* OR metabonom* OR ‘metabolite network’ OR ‘metabolite profile’ OR lipidom* AND (‘magnetic resonance spectroscopy’/exp OR ‘high‐throughput screening assays’/exp OR ‘chromatography’/exp OR ‘liquid chromatography’/exp OR ‘mass spectrometry’/exp) AND (‘cardiovascular disease’/exp OR ‘cardiovascular disease’) AND ([article]/lim OR [article in press]/lim OR [erratum]/lim OR [letter]/lim OR [note]/lim OR [review]/lim) AND ([catalan]/lim OR [czech]/lim OR [english]/lim OR [french]/lim OR [german]/lim OR [italian]/lim OR [portuguese]/lim OR [slovak]/lim OR [spanish]/lim) AND [humans]/lim |
Eligibility Criteria
Two investigators (M.R.‐C. and A.H.) independently reviewed all titles and abstracts identified by the search using an online tool for title and abstract screening (http://abstrackr.cebm.brown.edu/). Studies with discrepant decisions were full‐text reviewed, and disagreements between reviewers were resolved by consensus.
Studies were eligible if they met the following criteria: studies had to have been conducted in adult, nonpregnant humans; metabolites studied had to be related to more than 1 specific biological pathway or come from different chemical classes (ie, following an agnostic and/or comprehensive approach); serum or plasma was the biospecimen (we excluded metabolomics profiling conducted in urine samples); metabolite profiling had to have been conducted at least at baseline in the context of a prospective study; and myocardial infarction, stroke, and/or CVD death were included as part of the definition of the main CVD outcome(s).
Data Extraction
Data, extracted independently by 2 investigators (M.R.‐C. and A.H.), included first author, year of publication and journal, study name and location, design of the study, duration of follow‐up, sample size, analysis technique, biospecimen (serum/plasma), primary outcome, number, type, and identity of metabolites investigated, analysis approach (targeted/untargeted), statistical tests used, covariates included in the fully adjusted model, and main findings.
Results
Search Retrieval
We identified 629 titles from electronic databases after the removal of duplicates (Figure). Following the screening of titles and abstracts, 202 articles were eligible for full‐text review; 11 of these were selected, and 1 article was added after a hand search, for a total of 12 original articles included in the present systematic review.12, 13, 14, 15, 16, 17, 18, 19, 20, 21, 22, 23 Most of the 191 articles were excluded because they were cross‐sectional or did not include in their outcome definition at least 1 of our prespecified CVD outcomes (ie, MI, stroke, and/or CVD death).
Figure 1.
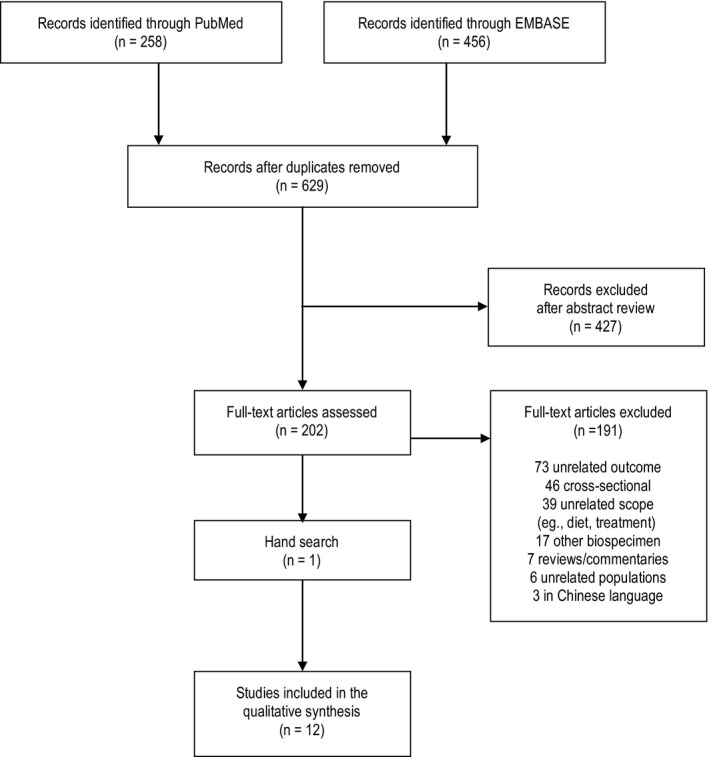
Flow diagram of search results.
Characteristics of Included Studies
General characteristics of the 12 selected articles12, 13, 14, 15, 16, 17, 18, 19, 20, 21, 22, 23 are shown in Table 3. Half of the articles (6/12) were published in 2014, and all except 220, 23 were conducted using European and/or US populations. These 12 articles include 19 separate primary discovery (or “learning”) and replication (or “validation”) analyses of metabolites in relation to CVD risk. Three articles12, 13, 15 included replication analyses conducted in samples derived from the same population, and another 4 articles included replication analyses conducted in 118, 19, 23 or 222 samples from different populations. Publications by Shah and colleagues12 and Zheng and colleagues21 presented the associations between metabolites and CVD risk only as secondary analyses. Several articles12, 13, 17 included cross‐sectional analyses as well.
Table 3.
Publication and Analysis Characteristics
| First Author, Year, Journal | Study Name/Acronym (Country) | Study Design | Follow‐Up Time | N | Baseline Characteristics of Participants | Main Outcome | Assay Method | Sample Type |
|---|---|---|---|---|---|---|---|---|
|
Shah12
2010a Circ Cardiovasc Genet |
CATHGEN (USA) | Prospective repository (discovery) | 2.7 y | 314 (74 cases) | Participants with CAD at baseline | MI or death | LC‐MS/MS | Fasting plasma, EDTA |
| Nested case‐control (replication) | 2 y | 63 cases; 66 matched controls | Participants with ejection fraction >40% and without coronary artery bypass grafting | MI, death, or percutaneous coronary intervention | LC‐MS/MS | Fasting plasma, EDTA | ||
|
Wang13
2011a Nature |
GeneBank (USA) | Case‐control, prospective repository (learning and validation sets) | 3 y | 50 cases, 50 matched controls (learning); 25 cases, 25 matched controls (validation) | Individuals undergoing cardiac evaluation or diagnostic coronary angiography (suspected CAD) | CVD (MI, stroke, or death) | HPLC‐MS | Fasting plasma, EDTA |
|
Shah14
2012 Am Heart J |
MURDOCK CV (USA) | Cohort, prospective repository | 3.1 y | 2023 (294 cases) | Patients undergoing diagnostic cardiac catheterization (suspected CAD) | MI or death | LC‐MS/MS | Fasting plasma, EDTA |
|
Kalim15
2013 J Am Heart Assoc |
ArMORR (USA) | 2 nested case‐control (discovery and replication sets) | 1 y | 100 cases, 100 frequency‐matched controls (discovery); 100 cases, 200 frequency‐matched controls (replication) | Patients initiating hemodialysis (measured within 14 days of enrollment) | CVD death (MI, CHF, CAD, CVD, stroke, TIA, PAD, etc) | LC‐MS/MS | Plasma (predialysis, fasting status NR) |
|
Rizza16
2014 Atherosclerosis |
(Italy) | Outpatient cohort, prospective | 4 y | 67 (17 cases) | Elderly patients with metabolic diseases or CVD | CVD (stroke, MI, peripheral vascular procedure, or CVD death) | LC‐MS/MS | Serum (fasting status NR) |
|
Vaarhorst17
2014a Am Heart J |
Cardiovascular Registry Maastricht study (The Netherlands) | Case‐cohort, prospective | 8.1 y (median) | 565 (79 cases) | Participants free of CVD at baseline | CHD (MI, UA, or CHD death) | H‐NMR | Non‐fasting plasma, EDTA |
|
Stegemann18
2014b Circulation |
The Bruneck Study (Italy) | Cohort, prospective, population‐based | 10 y | 685 (90 cases) | Participants free of CVD at baseline | CVD (MI, ischemic stroke, or sudden cardiac death) | QqQ‐MS | Fasting plasma, citrate |
|
Ganna19
2014 PLoS Genet |
ULSAM (Sweden) | Cohort, prospective (discovery) | Median 10 y | 1028 (131 cases) | Participants free of CVD at baseline | CHD (nonfatal or fatal acute MI or UA) | UPLC‐MS | Plasma (fasting status NR) |
| TwinGene (Sweden) | Case‐cohort, prospective (validation) | Median 3.9 y | 1670 (282 cases) | Participants free of CVD at baseline | CHD (nonfatal or fatal acute MI or UA) | UPLC‐MS | Fasting serum | |
|
Kume20
2014 PLoS One |
Shiga (Japan) | Cohort, prospective | 10 y | 385 (63 cases) | Participants with type 2 diabetes mellitus and without CVD during the year before recruitment | CVD (MI, angina, worsening CHF, stroke, CVD death) | HPLC‐ESI‐MS/MS | Fasting plasma, EDTA |
|
Zheng21
2014c Am J Epidemiol |
ARIC (USA) | Cohort, prospective | 21 y | 1903 (NR cases) | Black participants free of CHD at baseline | CHD (MI or coronary reperfusion) | GC‐MS/LC‐MS | Fasting serum |
|
Würtz22
2015d Circulation |
FINRISK (Finland) | Cohort, prospective | 15 y | 7256 (800 cases) | Participants free of CVD at baseline | CVD (fatal or nonfatal MI, ischemic stroke, revascularization, or UA) | NMR | “Semi‐fasting” (4 h) serum |
| Case‐cohort, prospective (LC‐MS replication) | 15 y | 679 (305 cases) | Participants free of CVD at baseline | CVD (fatal or nonfatal MI, ischemic stroke, revascularization, or UA) | LC‐MS | “Semi‐fasting” (4 hr) serum | ||
| SABRE (UK) | Cohort, prospective (NMR replication) | 20 to 23 y | 2622 (573 cases) | Participants free of CVD at baseline | CVD (MI, acute coronary syndrome, stroke, cardiac revascularization or stenting, UA, CVD death) | NMRe | Fasting serum | |
| BWHHS (UK) | Cohort, prospective (NMR replication) | 11 to 13 y | 3563 (368 cases) | Participants free of CVD at baseline | CVD (MI, ischemic or hemorrhagic stroke, revascularization, or UA, CVD death) | NMR | Fasting serum | |
| Framingham Heart Study Offspring (USA) | Cohort, community‐based, prospective (LC‐MS replication) | Median 12 y | 2289 | Participants free of CVD at baseline | CVD (MI, UA, ischemic stroke, CVD death, revascularization) | LC‐MS | Fasting plasma | |
|
Alshehry23
2016 Circulation |
ADVANCE Trial (multinational) | Case‐cohort (discovery) | Median 5 y | 3154 (698 cases) | Participants with type 2 diabetes mellitus with a history of CVD or other CVD risk factors | CVD (MI, stroke, CVD death) | LC‐MS | Plasma (fasting status NR) |
| LIPID Trial (Australia and New Zealand) | Cohort (validation) | NR | 511 | Participants with type 2 diabetes mellitus and a history of MI or unstable angina | CVD (MI, SCD, ischemic stroke, revascularization, CVD death) | LC‐MS | Plasma (fasting status NR) |
ADVANCE indicates Action in Diabetes and Vascular Disease: Preterax and Diamicron Modified Release Controlled Evaluation; ARIC, Atherosclerosis Risk in Communities study; ArMORR, Accelerated Mortality on Renal Replacement study; BWHHS, British Women's Heart and Health Study; CAD, coronary artery disease; CATHGEN, CATHeterization GENetics; CHD, coronary heart disease; CHF, congestive heart failure; CVD, cardiovascular disease; EDTA, ethylenediaminetetraacetic acid; GC, gas chromatography; HPLC‐ESI, high‐performance liquid chromatography‐electrospray ionization; LC, liquid chromatography; LIPID, long‐term intervention with pravastatin in ischemic disease; MI, myocardial infarction; MS, mass spectrometry; MS/MS, tandem mass spectrometry; MURDOCK CV, Measurement to Understand the Reclassification of Disease of Cabarrus and Kannapolis Cardiovascular Study; NMR, nuclear magnetic resonance; NR, not reported; PAD, peripheral artery disease; QqQ, triple quadrupole; SABRE, Southall and Brent Revisited study; TIA, transient ischemic attack; UA, unstable angina; ULSAM, Uppsala Longitudinal Study of Adult Men; UPLC, ultra‐performance liquid chromatography.
Results of secondary analyses.
Included a validation analysis in the Twins UK study; however, the study was inadequately described for inclusion in this table.
Also reported a cross‐sectional analysis and/or study not described here.
Another prospective study was also reported (Cardiovascular Risk in Young Finns) but was used to track metabolite markers over time, confirm quantification of NMR fatty acid biomarkers, and assess associations with dietary data.
Follow‐up (2008‐2011) serum sample subsequently analyzed with NMR metabolomics; no metabolite change analyses were conducted in relation to CVD risk.
Most of the articles used a cohort design for 1 or more of their analyses,12, 14, 16, 18, 19, 20, 21, 22, 23 4 articles exclusively or additionally included a case‐cohort design,17, 19, 22, 23 and 3 exclusively or additionally included a case‐control design,12, 13, 15 either as the discovery or replication sample analysis. The average follow‐up was 10 years or less in most analyses, except for 6 analyses in 2 separate articles that each included follow‐up longer than 10 years.21, 22 Participant numbers in a given analysis ranged from 67 participants16 to 7256 participants.22 Sample size or power calculations were not explicitly mentioned in any article, although Rizza and colleagues acknowledged their small sample size (67 participants) as the main limitation of their study and performed survival random forest analysis as a way to strengthen their results.16
Participants in 6 articles were free of CVD at baseline,15, 17, 18, 19, 21, 22 but 1 of them was conducted in individuals initiating hemodialysis.15 In 3 articles12, 13, 14 participants had a previous history of suspected coronary disease at baseline. Another article included older participants, of whom 68% had a prior history of CVD,16 and 2 articles included exclusively individuals with type 2 diabetes mellitus coupled with history of CVD or other CVD risk factors.20, 23
In most studies the main outcome was a composite of several end points in addition to MI, stroke, and/or CVD death, with additional CVD conditions including, for example, angina, revascularization, or heart failure.
All of the studies used variations of mass spectrometry (MS) for analyzing metabolite features, while 2 studies also used nuclear magnetic resonance spectroscopy (NMR) or both NMR and MS techniques.17, 22 Additionally, the consistency between NMR and liquid chromatography (LC)‐MS for biomarker associations with CVD was assessed by Würtz and colleagues.22 Twelve analyses relied on plasma, and 7 used serum samples.
Methodological and Statistical Approaches
Four studies used an untargeted profiling approach to identify both unknown and known compounds, including up to 10 162 metabolite features,13, 17, 19, 21 although Zheng and colleagues21 only analyzed 356 named compounds (Table 4). In the reporting of results of these untargeted analyses, independent associations of each metabolite feature were not presented in either the main text or supplemental material (likely due to limitations of space); thus, all unreported associations are presumed to be null. However, 11 out of 12 articles,12, 13, 15, 16, 17, 18, 19, 20, 21, 22, 23 whether targeted or untargeted in their approach, included univariate‐ or multivariate‐adjusted estimates of statistically significant single metabolite associations with CVD incidence in either the main text or supplemental material. Among the studies including only targeted/known metabolites, there was a minimum of 31 metabolites in the study by Kume and colleagues20 and a maximum of 310 lipid species in the study by Alshehry and colleagues.23 Targeted metabolite features tended to include groups of amino acids and related metabolites, acylcarnitines, and lipids.
Table 4.
Results of Analyses Associating Metabolites With CVD Risks
| First Author, Year | Metabolite Profiling | Data Reduction Approach | Statistical Analysis | Covariates in Fully Adjusted Model | Score Calculation | Statistically Significant Metabolites/Scores and/or Selected Metabolites/Scores | Adjusted HR (95%CI) for CVD Per SDa |
|---|---|---|---|---|---|---|---|
|
Shah12
2010 |
Targeted: 45 acylcarnitines, 15 amino acids Absolute values |
PCA (12 factors with an eigenvalue ≥1.0; metabolites with factor loading ≥0.4 identified a factor) Bonferroni correction |
Cox proportional hazards regression; logistic regression | BMI, dyslipidemia, hypertension, diabetes mellitus, family history, smoking, age, race, sex, creatinine, ejection fraction, CAD index | Weighted sum of the standardized metabolites within that factor (weighted on the factor loading for each metabolite) | Short‐chain dicarboxylacylcarnitines (Glutaryl carnitine [C5‐DC], Hexenedioyl carnitine [C8:1‐OH/C6:1‐DC], Citrulline, Octenedioyl carnitine [C8:1‐DC], Adipoyl carnitine C6‐DC) |
Discovery: 1.67 (0.88‐3.13) for T3 vs T1 1.89 (1.09‐3.33) for T3 vs T2 Replication: OR (95%CI) 1.82 (1.08‐3.50) |
| Medium‐chain acylcarnitines (Octanoyl carnitine [C8], Decenoyl carnitine [C10:1], Lauroyl carnitine [C12], Decanoyl carnitine [C10], Dodecenoyl carnitine [C12:1], Suberoyl carnitine [C10‐OH:C8DC], Adipoyl carnitine [C6‐DC], Octenedioyl carnitine [C8:1‐DC], Tetradecenoyl carnitine [C14:1], Tetradecadienoyl carnitine [C14:2], Hexenodioyl carnitine [C8:1‐OH/C6:1‐DC], Acetyl carnitine C2) | NS in adjusted models | ||||||
| Wang132011 |
Untargeted: 2000+analytes m/z values |
Learning and validation case‐control samples→18 analytes met Bonferroni and trend criteria→3 analytes subsequently investigated and identified because of significant correlations, although 17/18 were significantly associated with incident CVD | Logistic and Cox proportional hazards regressions | Age and sex | NA | Choline | 18.0 (4.9‐66.5) for Q4 vs Q1 |
| TMAO | 8.4 (2.5‐27.8) for Q4 vs Q1 | ||||||
| Betaine | 3.9 (1.3‐12.0) for Q4 vs Q1 [18 individual signal associations reported in original publication] | ||||||
|
Shah14
2012 |
Targeted: 45 acylcarnitines, 15 amino acids Absolute values |
PCA (13 factors with an eigenvalue ≥1.0; metabolites with factor loading ≥0.4 identified a factor) | Cox proportional hazards regression | Age, sex, diabetes mellitus, smoking, weight, modified Charlson index, red cell distribution width, heart rate, white blood cell count, chest pain frequency, corrected QT interval, ejectrion fraction, SBP, DBP, hemoglobin, blood urea nitrogen, Duke Index, creatinine, atrial fibrillation, heart failure severity, left bundle‐branch block | Weighted sum of the standardized metabolites within that factor (weighted on the factor loading for each metabolite) | Short‐chain dicarboxylacylcarnitines (Hexenedioyl carnitine [C6:1‐DC/C8:1‐OH], Octenedioyl carnitine [C8:1‐DC], Adipoyl carnitine [C6‐DC], Glutaryl carnitine [C5‐DC], Succinyl carnitine [Ci4‐DC/C4‐DC], Malonyl carnitine [C5‐OH/C3‐DC], Suberoyl carnitine [C10‐OH/C8‐DC], Decatrienoyl carnitine [C10:3]) | 1.11 (1.01‐1.23) per unit increase in factor score |
| Long‐chain dicarboxylacylcarnitines (Hydroxyeicosenoyl carnitine [C20:1‐OH/C18:1‐DC], Octadecanedioyl carnitine C20‐OH/C18‐DC, hexadecanedioyl carnitine [C18‐OH/C16‐DC], tetradecanedioyl carnitine [C16‐OH/C14‐DC], C18:1‐OH/C16:1‐DC, Arachidoyl carnitine [C20]) | 1.13 (1.04‐1.22) per unit increase in factor score | ||||||
| Fatty acids (nonesterified fatty acids, proline) | 1.18 (1.05‐1.32) per unit increase in factor score | ||||||
|
Kalim15
2013 |
Targeted: 165 amino acids and derivatives, urea cycle intermediates, nucleotides, positively charged polar metabolites, acylcarnitines m/z values |
Learning and replication studies→4 acylcarnitines after Bonferroni adjustment, plus TMAO | T tests and logistic regression |
Discovery: age, sex, race, SBP, albumin, transferrin saturation, phosphorous, diabetes mellitus, CAD, CHF, vascular access (catheter vs none), DBP, BMI, average urea reduction ratio, hemoglobin, ferritin, parathyroid hormone level, cardiac troponin T, NT‐pro‐B‐type natriuretic peptide Replication: age, sex, race, initial vascular access (catheter vs none), albumin, SBP, DBP, BMI, average urea reduction ratio, hemoglobin, ferritin, PTH, cardiac troponin T, NT‐pro‐B‐type natriuretic peptide |
NA |
Oleoylcarnitine (C18:1) Linoleylcarnitine (C18:2) Palmitoylcarnitine (C16:0) Stearoylcarnitine (C18:0) (all highly correlated)→Oleoylcarnitine evaluated in logistic models TMAO |
(OR, 95% CI) in discovery: 2.7 (1.4‐5.0) (OR, 95% CI) in replication: 1.5 (1.1‐2.1) Discovery: nominally significant, 1.4 (1.0‐2.0), P=0.04 Replication: 0.9 (0.7‐1.1), P=0.36 |
|
Rizza16
2014 |
Targeted: 18 amino acids, free carnitine, 30 acylcarnitines Absolute values |
PCA (7 factors with an eigenvalue ≥1.5; metabolites with factor loading ≥0.6 identified a factor) | Cox proportional hazards models | Age, sex, smoking, SBP, total and HDL‐C, diabetes mellitus, BMI | Weighted sum of standardized metabolites within that factor (weighted on the factor loading for each metabolite) | Medium‐long‐chain acylcarnitines (acetyl carnitine C2, C6, C8, C10, C10:1, C12, C12:1, C14, C14:1, C14:2, C16, C16:1, C18:1, C18:2) | 1.77 (1.11‐2.81) per unit increase in factor score |
| Alanine | 2.18 (1.17‐4.07) per unit increase in factor score | ||||||
|
Vaarhorst17
2014 |
Untargeted: 100 signals Area under the curve |
LASSO→76 metabolites→36 different compounds | Weighted Cox proportional hazards models | Age, sex, smoking, BMI, diabetes mellitus, parental history of MI, total cholesterol, HDL‐C, SBP | Sum of Cox regression coefficients multiplied by the metabolite values | Metabolite score of 16 LASSO‐determined signals (creatinine, serine, glucose, 1,5‐anhydrosorbitol, TMAO, ornithine, citrate, glutamate, glycoproteins, an unsaturated lipid structure, valine, and 5 nonannotated signals) | 1.58 (1.18‐2.12) [121 individual signal associations reported in original publication supplement] |
|
Stegemann18
2014 |
Targeted: 135 lipids Absolute values |
→28 lipids after Benjamini‐Hochberg FDR→3 consistent across 3 selection methods (LASSO plus 2 alternate selection methods) | Cox proportional hazards models | Age, sex, smoking, diabetes mellitus, statin use, total cholesterol, HDL‐C, SBP, diabetes mellitus | NA | Triacylglycerol 54:2 | 1.22 (1.03‐1.44) |
| Cholesterol ester 16:1 | 1.24 (1.04‐1.47) | ||||||
| Phosphatidylethanolamine 36:5 | 1.16 (1.01‐1.34) [135 individual signal associations reported in original publication supplement] | ||||||
|
Ganna19
2014 |
Untargeted: 10 162 metabolic features m/z values |
Learning (ULSAM)→32 unique metabolites associated with CHD incidence (unadjusted) at <15% FDR level carried to replication in TwinGene | Cox proportional hazards models, meta‐analysis | Age, sex, smoking, diabetes mellitus, SBP, BMI, antihypertensive treatment, LDL‐C, HDL‐C, triglycerides | NA | Lysophosphatidylcholine 18:2 | 0.81 (0.71‐0.92) |
| Lysophosphatidylcholine 18:1 | 0.77 (0.68‐0.86) | ||||||
| Monoglyceride 18:2 | 1.18 (1.04‐1.34) | ||||||
| Sphingomyelin 28:1 | 0.85 (0.75‐0.97) [32 individual signal associations reported in original publication supplement] | ||||||
|
Kume20
2014 |
Targeted: 31 amino acids Absolute values |
Logistic models with combination of 6 amino acids and selection according to AUC for ROC | Cox proportional hazards models | Age, SBP, hypertension, HDL‐C, urinary albumin excretion rate, eGFR, brachial‐ankle pulse wave velocity | Sum of logistic regression coefficients multiplied by metabolite values plus the coefficient for the constant (intercept) | Amino acid‐based index (ethanolamine, hydroxyproline, glutamic acid, 3‐methylhistidine, tyrosine, tryptophan) |
Total CVD: 2.86 (1.57‐5.19) MI and angina: 3.35 (1.64‐6.83) Stroke: 1.51 (0.52‐4.37) |
|
Zheng21
2014 |
Untargeted: 356 named compounds (147 lipid, 88 amino acid, 42 xenobiotic, 29 peptide, 16 carbohydrate, 14 nucleotide, 12 cofactor/vitamin, 8 energy‐related metabolites) | ANCOVA with type of alcohol beverage (categorical) metabolite variable (dependent), with adjustment for age, sex, BMI, smoking status, eGFR | Cox proportional hazards regression | Age, sex, BMI, eGFR | Sum of quartile ranks of alcohol‐related metabolites belonging to 3 metabolic subpathways | γ‐Glutamyl dipeptide pathway score (γ‐glutamyl valine, phenylalanine, leucine, isoleucine, tyrosine, glutamate, and alanine) | 0.98 (CI NR), P=0.03 |
| Lysophosphatidylcholine score (1‐palmitoleoyl‐glycerophosphocholine, 1‐stearoyl‐glycerophosphoethanolamine, 1‐pentadecanoyl‐glycerophosphocholine, and 2‐arachidonoyl‐glycerophosphoethanolamine) | 1.07 (CI NR), P=0.03 | ||||||
| 2‐Hydroxybutyrate score (2‐aminobutyrate, α‐hydroxyisovalerate, α‐hydroxyisobutyrate, α‐hydroxyisocaproate, and 2‐hydroxy‐3‐methylvalerate and 2‐hydroxybutyrate) | 1.04 (CI NR), P=0.03 | ||||||
|
Würtz22
2015 |
Targeted: 68 metabolites (amino acids, glycolysis‐related metabolites, lipids, ketone bodies) Absolute values, log‐transformed, SD‐scaled |
Discovery case‐cohort→19 carried to meta‐analysis with 2 validation cohorts at adjusted P<0.05→5 significant in meta‐analysis at P<0.0007 (Bonferroni correction) | Cox proportional hazards models, meta‐analysis | Age, sex, smoking, diabetes mellitus, BP, geographical region cardiovascular medications, total cholesterol, HDL‐C | NA | Phenylalanine | 1.18 (1.12‐1.24) [68 individual signal associations reported in original publication] |
| Monounsaturated fatty acid (% total fatty acids) | 1.17 (1.11‐1.24) | ||||||
| ω‐6 fatty acids | 0.89 (0.84‐0.94) | ||||||
| Polyunsaturated fatty acids | 0.88 (0.82‐0.93) | ||||||
| Docosahexaenoic acid | 0.90 (0.86‐0.95) | ||||||
|
Alshehry23
2016 |
Targeted: 310 lipid species pmol/mL Log‐transformed, centered, estimates scaled to IQR |
Discovery case‐cohort→correlation minimization procedure→27 individually significant (FDR correction) | Weighted and Cox proportional hazards regression | Age, sex, BMI, SBP, glycohemoglobin, HDL‐C, eGFR, diabetes mellitus duration, C‐reactive protein, history of macrovascular disease, history of heart failure, use of antihypertensive medication, use of antiplatelet medication, and exercise | NA | Monohexosylceramide (d18:1/16:0) | 1.25 (1.12‐1.38) |
| Monohexosylceramide (d18:1/18:0) | 1.20 (1.09‐1.33) | ||||||
| Monohexosylceramide (d18:1/20:0) | 1.21 (1.09‐1.34) | ||||||
| Monohexosylceramide (d18:1/22:0) | 1.18 (1.06‐1.31) | ||||||
| Monohexosylceramide (d18:1/24:0) | 1.19 (1.06‐1.32) | ||||||
| Monohexosylceramide (d18:1/24:1) | 1.28 (1.15‐1.42) | ||||||
| Dihexosylceramide (d18:1/16:0) | 1.23 (1.10‐1.37) | ||||||
| Dihexosylceramide (d18:1/18:0) | 1.25 (1.13‐1.39) | ||||||
| Dihexosylceramide (d18:1/22:0) | 1.17 (1.06‐1.29) | ||||||
| Dihexosylceramide (d18:1/24:1) | 1.21 (1.09‐1.34) | ||||||
| Trihexosylceramide (d18:1/22:0) | 1.19 (1.07‐1.32) | ||||||
| Trihexosylceramide (d18:1/24:0) | 1.22 (1.10‐1.36) | ||||||
| Trihexosylceramide (d18:1/24:1) | 1.23 (1.11‐1.36) | ||||||
| Phosphatidylcholine (34:5) | 0.86 (0.78‐0.96) | ||||||
| Phosphatidylcholine (35:4) | 0.84 (0.75‐0.95) | ||||||
| Phosphatidylcholine (40:6) | 0.84 (0.75‐0.95) | ||||||
| Alkylphosphatidylcholine (O‐32:0) | 1.18 (1.06‐1.30) | ||||||
| Alkylphosphatidylcholine (O‐32:1) | 1.18 (1.06‐1.32) | ||||||
| Alkylphosphatidylcholine (O‐34:1) | 1.33 (1.19‐1.49) | ||||||
| Alkylphosphatidylcholine (O‐36:1) | 1.32 (1.18‐1.48) | ||||||
| Alkylphosphatidylcholine (O‐36:2) | 1.18 (1.06‐1.32) | ||||||
| Alkenylphosphatidylcholine (P‐34:1) | 1.21 (1.07‐1.36) | ||||||
| Alkenylphosphatidylcholine (P‐38:6) | 0.83 (0.74‐0.93) | ||||||
| Lysoalkylhosphatidylcholine (O‐18:0) | 1.14 (1.05‐1.23) | ||||||
| Lysoalkylhosphatidylcholine (O‐18:1) | 1.15 (1.05‐1.25) | ||||||
| Lysoalkylhosphatidylcholine (O‐22:0) | 1.13 (1.04‐1.23) | ||||||
| Lysoalkylhosphatidylcholine (O‐22:1) | 1.12 (1.04‐1.20) | ||||||
| Lysoalkylhosphatidylcholine (O‐24:0) | 1.17 (1.06‐1.30) | ||||||
| Lysoalkylhosphatidylcholine (O‐24:1) | 1.13 (1.05‐1.22) | ||||||
| Lysoalkylhosphatidylcholine (O‐24:2) | 1.13 (1.05‐1.22) | ||||||
| Cholesteryl Ester (16:0) | 1.18 (1.06‐1.31) | ||||||
| Triacylglycerol (56:6) | 0.83 (0.74‐0.94) |
AUC indicates area under the curve; BMI, body mass index; BP, blood pressure; CAD, coronary artery disease; CVD, cardiovascular disease; DBP, diastolic blood pressure; eGFR, estimated glomerular filtration rate; FDR, false discovery rate; HDL‐C, high‐density lipoprotein cholesterol; LASSO, least absolute shrinkage and selection operator algorithm; LDL‐C, low‐density lipoprotein cholesterol; MI, myocardial infarction; m/z, mass‐to‐charge ratio; NA, not applicable; NR, not reported; PCA, principal component analysis; PTH, parathyroid hormone; ROC, receiver operating characteristic; SBP, systolic blood pressure; TMAO, trimethylamine N‐oxide.
Except as stated otherwise.
Different data reduction approaches were applied, including principal component analysis (PCA), stepwise selection, correlation minimization, and others. PCA was implemented in 3 (primary) analyses,12, 14, 16 and another employed PCA in secondary analyses.23 The derived factors were then used as independent variables potentially associated with CVD risk. A combination of learning/discovery and validation/replication samples were used in 6 studies, in which features that were found to be significant in the learning set were carried into the validation set(s).12, 13, 15, 19, 22, 23 The least absolute shrinkage and selection operator (LASSO) algorithm was applied in 3 articles.17, 18, 23
In 6 of 12 articles,12, 14, 16, 17, 20, 21 a score was developed combining between a minimum of 4 and a maximum of 16 metabolites; scores were subsequently used as an independent variable to predict CVD risk. Two of these articles calculated a score by summing the regression coefficients of metabolites independently associated with CVD, multiplied by the metabolite levels, and then used the score to prospectively assess the association with CVD.17, 20 Another article used the sum of quartile ranks according to the association between metabolites and alcohol and considered 3 specific metabolic pathways.21
All articles except 1 used Cox regression models to estimate the association between metabolites, components, or scores and the risk of incident CVD. There was wide variation in the covariates included in fully adjusted models, although all except 213, 21 included classic cardiovascular risk factors (ie, age, sex, smoking, body mass index, diabetes mellitus, hypertension or blood pressure, and total or HDL cholesterol).
Metabolites Associated With CVD Risk
The metabolite features in the 3 articles12, 14, 16 primarily evaluating PCA‐derived components were carnitines and amino acids. Higher CVD risk was found for participants with higher levels of short‐,12, 14 medium‐,16 and long‐chain14 carnitines. PCA components including the amino acids alanine16 and proline14 were also associated with higher CVD risk.
The 3 articles17, 20, 21 that developed scores based on regression coefficients of individual metabolites observed higher CVD risk with higher scores. Vaarhorst and colleagues17 developed a metabolite score derived from untargeted NMR with signals corresponding to 36 different compounds. In a LASSO algorithm, 16 metabolite signals were included in the score: creatinine, serine, glucose, 1,5‐anhydrosorbitol, trimethylamine N‐oxide (TMAO), ornithine, citrate, glutamate, glycoproteins, an unsaturated lipid structure, valine, and 5 nonannotated signals. Kume and colleagues20 targeted 31 amino acids using high‐performance LC‐electrospray ionization‐MS/MS and calculated the area under the curve for models including all possible combinations of 6 or fewer amino acids. The final model included ethanolamine, hydroxyproline, glutamic acid, 3‐methylhistidine, tyrosine, and tryptophan, and it was defined as the amino acid‐based index. Zheng and colleagues, in an untargeted NMR approach capturing 356 named compounds (mainly lipids and amino acids), developed scores from the sums of quartile ranks of alcohol‐related metabolites belonging to 3 metabolic pathways—the γ‐glutamyl dipeptide pathway (γ‐glutamyl, valine, phenylalanine, leucine, isoleucine, tyrosine, glutamate, and alanine), the lysophosphatidylcholine pathway (1‐palmitoleoyl‐glycerophosphocholine, 1‐stearoyl‐glycerophosphoethanolamine, 1‐pentadecanoyl‐glycerophosphocholine, and 2‐arachidonoyl‐glycerophosphoethanolamine), and the 2‐hydroxybutyrate pathway (2‐aminobutyrate, α‐hydroxyisovalerate, α‐hydroxyisobutyrate, α‐hydroxyisocaproate, 2‐hydroxy‐3‐methylvalerate, and 2‐hydroxybutyrate). Higher lysophosphatidylcholine scores and the 2‐hydroxybutyrate scores were associated with 4% to 7% higher CVD risk, and the γ‐glutamyl dipeptide score was associated with 2% reduced risk.21
Five articles13, 15, 18, 19, 22 reduced the initial number of metabolites (ranging from 6822 to >10 00019 features) using either false discovery rate or Bonferroni approaches, resulting in 415 to 3219 features, which were subsequently further analyzed.
Wang and colleagues13 initially reduced >2000 high‐performance LC‐MS features to 18 using Bonferroni and trend criteria, 17/18 of which were independently associated with CVD (identified in the article by their mass‐to‐charge ratios and retention times only). Subsequent analyses, however, focused on 3 phosphatidylcholine metabolites that were highly correlated with each other. Choline, TMAO, and betaine, metabolites related to gut flora, were associated with higher CVD risk, with higher choline notably associated with 18 times (95%CI 4.9‐66.5) the risk when the highest quartile was compared with the lowest.
Kalim and colleagues15 initially targeted 165 LC‐MS/MS metabolites (amino acids and derivatives, carnitines, urea cycle intermediates, nucleotides, positively charged polar metabolites) and, after Bonferroni correction, focused on 4 acylcarnitines plus TMAO. The 4 acylcarnitines (oleoylcarnitine, lineoylcarnitine, palmitoylcarnitine, and stearoylcarnitine) were highly correlated; thus, only oleoylcarnitine was evaluated against CVD risk in both discovery and replication analyses, where higher levels were associated with 2.7‐ and 1.5‐fold higher odds of CVD, respectively. TMAO was nominally associated with higher CVD risk in the discovery but not replication analyses.
Stegemann and colleagues18 initially targeted 135 lipid features in triple‐quadrupole‐MS, reduced to 28 after false discovery rate, finally focusing on 3 lipid metabolites consistent across LASSO and 2 other selection methods (backward stepwise and best subset). Triacylglycerol 54:2, cholesterol ester 16:1 and phosphatidylethanolamine 36:5 were each associated with between 16% and 24% higher risk of CVD.
In an untargeted ultraperformance LC‐MS analysis of 10 162 features, Ganna and colleagues19 identified 32 unique metabolites after false discovery rate correction, and these were carried forward to a validation sample. In meta‐analyses of the discovery and validation samples, 3 metabolites were significantly associated with lower CVD risk (lysophosphatidylcholine 18:1, 18:2, and sphingomyelin 28:1), and another (monoglyceride 18:2) was associated with higher risk. However, in a Mendelian randomization analysis only a weak positive causal effect was suggested for the association between monoglyceride 18:2 and CVD.
In an analysis of 68 targeted features including lipids, amino acids, and other metabolites, Würtz and colleagues22 identified 19 metabolites in the discovery cohort significant after Bonferroni correction, which were subsequently carried into 2 separate replication cohorts. In meta‐analyses of the 3 cohorts, 5 metabolites were associated with risk of CVD: phenylalanine and monounsaturated fatty acids were associated with 18% and 17% higher risk, respectively, and polyunsaturated fatty acids, ω‐6 fatty acids, and docosahexanoic acid were associated with 12%, 11%, and 10% lower risk of CVD, respectively.
Finally, Alshehry and colleagues23 evaluated 310 LC‐MS–derived lipid species in relation to CVD. After removing highly correlated species in the discovery sample, 27 lipid species were directly associated (including di‐ and trihexosylceramides, alkylphosphatidylcholines, and lysoalkylphosphatidylcholines), and 5 (including several phosphatidylcholines) were inversely associated with CVD events and/or death. Results of analyses for CVD death alone overlapped with those for events and death combined.
Predictive Analysis
Nine articles assessed whether metabolites or scores significantly associated with CVD risk were useful in discriminating and/or improving prediction of cases versus noncases beyond that obtained with traditional risk factors alone and reported Harrell C discrimination, net reclassification improvement, and integrative discrimination improvement indices (Table 5). Tiny improvements in CVD prediction were observed when metabolites were added to predictive models already containing traditional CVD risk factors. Specifically, after adding the metabolites into the prediction model with traditional CVD risk factors, the C index increased between 0.006 points in the study by Shah and colleagues14 and 0.05 points in the study by Rizza and colleagues.16
Table 5.
Predictive Analysis of CVD Performed in Selected Comprehensive Metabolomic Studies
| First Author, Year | Outcome | Discriminative Capability C‐Index | NRItotal | IDI | |
|---|---|---|---|---|---|
| Clinical Model | Clinical+Metabolites | ||||
|
Shah14
2012 |
Death or MI |
0.765 (CI NR) Modified Charlson index, age, red cell distribution width, diabetes mellitus, weight, heart rate, sex, white blood cell count, chest pain frequency, corrected QT interval, ejection fraction, diastolic and systolic BP, hemoglobin level, blood urea nitrogen, Duke Index, smoking, creatinine, atrial fibrillation/flutter, heart failure severity, and left bundle‐branch block |
0.771 (CI NR) Clinical model+3 significant metabolomic factors |
3.9% (CI NR) | 0.012 (CI NR) |
|
Kalim15
2013 |
CVD death (MI, CHF, CAD, CVD, stroke, TIA, PAD, etc) (combined discovery and replication) |
0.67 (CI NR) Age, sex, race, albumin, initial vascular access (catheter vs none), transferrin saturation, systolic and diastolic BP |
0.70 (CI NR), P diff=0.04 Clinical model+oleoylcarnitine |
0.38 (0.20‐0.56), P<0.001 | 0.04 (0.02‐0.06), P<0.001 |
|
Rizza16
2014 |
CVD (stroke, MI, peripheral vascular surgical procedure, CVD death) |
0.70 (0.59‐0.81) Recurring coronary heart disease score+BMI |
0.75 (0.64‐0.86) Clinical model+factor 1 (medium‐and long‐chain acylcarnitines) |
0.79 (0.17‐1.36), P=0.005 | 0.07 (0.01‐0.06), P=0.01 |
|
Vaarhorst17
2014 |
CHD (MI, UA, or CHD death) |
0.82 (0.78‐0.87) Age, sex, smoking, diabetes mellitus, parental history of MI, total cholesterol, HDL‐C, systolic BP, BMI, |
0.84 (0.80‐0.87), P diff=0.11 Clinical model+Metabolite score (creatinine, serine, glucose, 1,5‐anhydrosorbitol, TMAO, ornithine, citrate, glutamate, glycoproteins, an unsaturated lipid structure, valine, and 5 nonannotated signals) |
0.038 (CI NR), P=0.21 | 0.012 (CI NR), P=0.09 |
|
Stegemann18
2014 |
CVD (MI, ischemic stroke, sudden cardiac death) |
0.71 (0.66‐0.76) Age, sex, diabetes mellitus, smoking, systolic BP, total cholesterol, HDL‐C |
0.74 (0.69‐0.78) Clinical model+TAG 54:2, PE 36:5, CE 16:1 0.75 (0.70‐0.79) Clinical model+TAG 54:2, PE 36:5, CE 16:1. SM 34:2, LPC 20:5, LPC 22:6 |
0.087 (0.016‐0.159) 0.149 (0.065‐0.234) |
0.021 (0.003‐0.041) 0.034 (0.007‐0.062) |
|
Ganna19
2014 |
CHD (acute MI, UA) |
0.75 (CI NR) Risk factors included in the Framingham Heart Study risk score |
0.76 (P=0.026) Clinical model+LPC 18:1, LPC 18:2, MG 18:2, SM 28:1 |
9.9% (1.2‐20.2%) (events) −0.7% (−6.0% to 0.5%) (non‐events) |
NR |
|
Kume20
2014 |
CVD (MI, angina, worsening CHF, stroke, CVD death) |
0.69 (0.62‐0.77) Urinary albumin excretion rate |
0.72 (0.64‐0.79)a
Amino acid‐based index (ethanolamine, hydroxyproline, glutamic acid, 3‐methylhistidine, tyrosine, tryptophan) (no clinical model) |
NR | NR |
|
Würtz22
2015 |
CVD (MI, ischemic stroke or hemorrhagic stroke, cardiac revascularization, UA, CVD death) |
SABRE: 0.712 (0.695‐0.745) BWHHS: 0.665 (0.636‐0.695) Age, sex, smoking, diabetes mellitus, lipid and BP treatment, BP, total cholesterol, and HDL‐C |
SABRE: 0.720 (0.687‐0.738) (P=0.18) BWHHS: 0.666 (0.637‐0.694) (P=0.97) Clinical model+log‐transformed phenylalanine, MUFA:total fatty acids, ω‐6 fatty acids, DHA |
SABRE: 27.1% (9.1‐45.0%) BWHHS: 15.5% (3.9‐27.0%) |
SABRE: 1.37% (0.57‐2.2%) BWHHS: 0.64% (0.10‐1.17%) |
|
Alshehry23
2016 |
CVD (MI, stroke, CVD death) |
ADVANCE: 0.680 (0.678‐0.682) LIPID: 0.662 (0.661‐0.662) ADVANCE: Age, BMI, HbA1c, HDL‐C, systolic BP, eGFR, CRP, T2D duration, sex, history of macrovascular disease, BP treatment, antiplatelet treatment, and moderate or vigorous exercise. LIPID: Age, treatment arm, BMI, cholesterol, HDL‐C, triglycerides, current smoking, systolic BP, fasting glucose, atrial fibrillation, sex, history of stroke, history of hypertension, nature of prior acute coronary syndrome, revascularization, eGFR, dyspnea grade, angina grade, white blood cell count, peripheral vascular disease, and aspirin use |
ADVANCE: 0.700 (0.698‐0.702) LIPID: 0.684 (0.684‐0.685) Clinical model+7 lipid species [PC(O‐36:1), CE 18:0, PE(O‐36:4), PC 28:0, LPC 20:0, PC 35:4, LPC 18:2] |
ADVANCE: 0.227 (0.219‐0.235) LIPID: 0.297 (0.294‐0.301) (continuous NRI) |
ADVANCE: 0.364 (0.353‐0.374) LIPID: 0.458 (0.449‐0.467) (relative IDI) |
ADVANCE inidcates Action in Diabetes and Vascular Disease: Preterax and Diamicron Modified Release Controlled Evaluation; AUC, area under the curve; BMI, body mass index; BP, blood pressure; BWHHS, British Women's Heart and Health Study; CAD, coronary artery disease; CE, cholesteryl ester; CHF, congestive heart failure; CRP, C‐reactive protein; CVD, cardiovascular disease; DHA, docosahexanoic acid; eGFR, estimated glomerular filtration rate; HbA1c, hemoglobin A1c; HDL‐C, high‐density lipoprotein cholesterol; IDI, integrated discrimination improvement index; LIPID, Long‐Term Intervention With Pravastatin in Ischemic Disease; LPC, lysophosphatidylcholine; MG, monoglyceride; MI, myocardial infarction; MUFA, monounsaturated fatty acid; NR, not reported; NRI, net reclassification improvement index; PAD, peripheral artery disease; PC, phosphatidylcholine; PC(O‐), alkylphosphatidylcholine; PE, phosphatidylethanolamine; PE(O‐), alkylphosphatidylethanolamine; ROC, receiver operating characteristic; SABRE, Southall and Brent Revisited study; SM, sphingomyelin; T2D, type 2 diabetes mellitus; TAG, triacylglycerol; TIA, transient ischemic attack; TMAO, trimethylamine‐N‐oxide; UA, unstable angina.
AUC for ROC.
After a 2‐step metabolite‐ranking procedure and optimal model selection, 7 lipid species were retained in the study by Alshehry and colleagues23: alkylphosphatidylcholine [PC(O‐36:1)], cholesteryl ester [CE(18:0)], alkylphosphatidylethanolamine [PE(O‐36:4)], phosphatidylcholines [PC(28:0) and PC(35:4)], and lysophosphatidylcholines [LPC(20:0) and LPC(18:2)]. Despite the inclusion of these species in optimized CVD prediction models, only 3 were independently significantly associated with CVD risk in weighted Cox models in the discovery sample, and none was significant in the replication sample. As shown in Table 5, the C index improved from 0.680 using only clinical variables to 0.700 after addition of these 7 lipid species.
Discussion
This systematic review identified 12 articles including 19 analyses that have prospectively assessed the association between a wide circulating metabolomic profile and risk of CVD events.12, 13, 14, 15, 16, 17, 18, 19, 20, 21, 22, 23 These articles included metabolite features measured at baseline using predominantly MS as the analytical method. The number and chemical diversity of metabolites were very heterogeneous. Several data reduction approaches were followed in order to identify a smaller subset of metabolites associated with CVD risk. Most of these articles also evaluated the incremental discriminative and predictive capability of metabolites beyond the use of only clinical information and traditional risk factors. Our systematic review reveals the diversity and complexity of current metabolomic profiling in human CVD and, moreover, the challenge of currently drawing any summary conclusions regarding specific circulating metabolites as they relate to CVD risk.
Metabolites Associated With CVD
According to this systematic review, the following types of metabolites are, individually or as a group, associated with CVD risk: acylcarnitines and dicarboxylacylcarnitines,12, 14, 15, 16 TMAO,13, 15, 17 several amino acids such as phenylalanine,21, 22 glutamate,17, 20, 21 and several lipid classes.18, 19, 21, 22, 23 In hypothesis‐based analyses with participants from the PREDIMED study, we have also found an association between CVD risk and branched‐chain amino acids,24 acylcarnitines,25 glutamate,26 ceramides,27 and tryptophan.28 Other studies have also found an association between a score of 3 amino acids,29 as well as ceramides30 and the risk of CVD. This consistency reinforces the potential causal relationship between these metabolites and CVD or at least the role of these metabolites as biomarkers of biological dysfunction related to CVD.31
Interestingly, dicarboxylcarnitines and acylcarnitines,32 plasma branched and aromatic amino acids,33, 34, 35 phenylalanine,33, 34, 35 α‐hydroxybutyrate,36, 37 and ceramides38, 39 have been associated with cardiovascular risk factors including obesity, insulin resistance, and diabetes mellitus. Different complex mechanisms, including inflammation and stress oxidation, are underlying processes potentially explaining these associations.39
Metabolomic Approaches
In order to address specific questions regarding the utility and practice of broad (agnostic) metabolic profiling (“metabolic fingerprint”) in predicting CVD, we restricted our systematic review to prospective studies assessing more than 1 specific biological pathway and/or metabolites from different chemical classes. Therefore, we excluded previous studies using only 1 metabolite or only a small set of targeted compounds. For example, we did not include a meta‐analysis of 22 prospective studies published between 2001 and 2013 that found an association between a single metabolite, asymmetric dimethylarginine, and CVD outcomes.40 Although informative, 1 drawback of a relatively narrow, targeted approach is that it does not render a global metabolic picture of our understanding of the complex biological mechanisms underlying CVD, thus potentially leading us down less‐than‐fruitful paths.41 Numerous parallels may be drawn with genetics studies in this regard, where single variant studies have frequently yielded different results from genome‐wide studies. However, genetics studies now benefit from considerably more uniform techniques, statistical approaches, databases, and reporting methods, all of which are still broadly lacking in metabolomics research.
Eight of the articles in this review used a targeted approach and analyzed metabolites from the same chemical families. Among them, 5 articles targeted acylcarnitines and/or amino acids,12, 14, 15, 16, 20 and 2 studies analyzed a group of lipids.18, 23 Würtz and colleagues22 included 68 metabolites, although some compounds evaluated (eg, ω‐3 fatty acids) cannot be properly considered “small” molecules. Among these targeted approaches, the number of metabolites ranged from 31 amino acids20 to 310 lipid species.23 Targeted metabolomics quantifies the levels of metabolites, and it is preferable when the aim is a specific pathway.42 However, limiting the number or variety of metabolites may be considered a source of bias when the aim is to define a more global metabolic profile or identify the most important circulating biomarkers related to CVD risk.43 In other words, when taken at face value, the results of this systematic review could suggest that acyclarnitines are reliable predictors of incident CVD given that 4 articles showed elevated CVD risk with higher acylcarnitine levels. However, this would belie 2 important points: first, that which is not studied cannot be evaluated, and second, the studies using an agnostic, untargeted approach did not find—to our knowledge—associations of acylcarnitines with CVD risk. However, this latter approach is likely to be less powerful because of issues related to multiple testing in comparison with targeted approaches based on a priori hypotheses. Additionally, it is difficult to compare the results when the number and nature of initial metabolites differ so greatly among studies.
Four articles included in this systematic review followed an untargeted approach.13, 17, 19, 21 This approach is initially considered an unbiased and unsupervised manner of biomarker discovery. However, the initial range of metabolite features ranged from 10017 to more than 10 000.19 In addition to the potential risk of bias in those studies with less comprehensive extraction procedures, an additional problem in an untargeted approach is the identification of metabolites. There is still a relatively low percentage of known metabolites with annotated spectra.44 This results in additional difficulties in comparing results from studies using different untargeted methods.
In this review, articles using untargeted methods also differed from those using targeted methods in the reliability of quantification. An untargeted analysis usually provides a relative quantification, whereas a targeted approach presents absolute quantities, usually expressed in micromolar units. This difference in analytical approaches is also an important factor in terms of comparability between studies. However, improvements in instrumentation will likely allow the merging of untargeted data collection with quantification of metabolites. This would present an optimal situation, combining a hypothesis‐free approach with an approach driven by an a priori hypothesis.
A related problem is with the reporting of findings. Journal space limitations naturally preclude the publication of hundreds of metabolite associations, even in supplemental material. Even if the vast majority of these associations are null, without the availability of such data, there is no reliable way to include effect/association sizes in future quantitative meta‐analyses without risking a biased presentation. This will likely become a more important issue as calls for full data and results sharing continue to gain momentum.
Study Designs, Populations, and Outcomes
All the articles included in this systematic review measured metabolites at baseline and assessed the association of these profiles with incident CVD. Previous studies45, 46, 47 have compared the metabolite phenotype of CVD patients with that of healthy participants. Such an approach might allow the identification of abnormalities in metabolism present in diagnosed CVD, which may drive secondary prevention endeavors.7 In contrast, the studies presented in this systematic review were designed to study circulating metabolites associated with future risk of CVD through the identification of early metabolic changes.5
We found important differences among articles in baseline characteristics of participants and in outcome definitions. Four articles included participants with baseline coronary stenosis12, 13, 14 or previous history of CVD.16 This makes it difficult to compare the findings for associations between metabolite profiles and CVD across all the included articles because the presence of baseline coronary disease is likely already influencing the levels of metabolites. Cardiometabolic risk factors such as anthropometric markers,48 obesity,33, 48, 49 and diabetes mellitus34, 50 have been shown to have a metabolic fingerprint. In previous research we found that an association between baseline branched‐chain amino acids and CVD was no longer statistically significant after adjusting for diabetes mellitus, dyslipidemia, and hypertension, which may be intermediate factors in the causal path.24 Moreover, the metabolite profile may be different according to the stage of disease.51 Thus, the varying selection criteria and control for confounders add more challenges to understanding the complexity of metabolic networks when comparing results among published articles.52
Analytical Techniques
Eleven of 12 studies used MS with some separation technique, with 1 of these additionally including NMR in a targeted approach22; 1 study exclusively used NMR and followed an untargeted approach.17 The study using both NMR and MS techniques concluded that metabolite associations with CVD obtained from NMR were largely consistent with those obtained using a LC‐MS platform.22 Individual metabolites are separated by their mass‐to‐charge ratio in the first case and by their magnetic resonance shift in the second. NMR requires minimal sample preparation and is less expensive that MS.53 These characteristics make it more appealing in the cardiovascular clinical context.54 However, compared with MS, NMR has lower sensitivity and is limited to the analysis of around 100 of the most abundant metabolites in a sample. In fact, 100 signals were initially identified in the study using NMR and an untargeted approach,17 whereas thousands of signals were identified in the untargeted studies using MS.13, 19 Therefore, MS is ostensibly a better approach to discovering new biomarkers because it enables the measurement of low concentrations of metabolites.
Another difference among the studies was the type of sample and sample‐preparation method. Seven studies used plasma samples, 3 used serum, and 2 used both.19, 22 Samples were also not uniformly drawn in the fasted state. Plasma and serum samples are similar but not equivalent, and care should be taken before extrapolating results obtained from plasma to serum or vice‐versa. The sample preparation and extraction protocol are key aspects of metabolomics analyses. Physical aspects such as the extraction solvent, temperature, derivatization reagents, and so on may affect the extraction process. The use of coagulant could also affect results. Thus, although reproducibility between plasma and serum samples is possible, differences among metabolite concentrations can be found between types of blood samples.
Statistical Analysis
All the articles included in this systematic review used methods to identify a combination of metabolites or a reduced number of individual metabolites related to CVD. The approach of combining metabolite signals may lead to data overfitting when using β coefficients obtained from analyses of individual metabolites, in which weights were used to calculate combined scores and thereafter to relate scores to study outcomes. Six articles applied univariate analyses (ie, when 1 metabolite is analyzed at a time) to select the metabolites associated with CVD. Four of them13, 19, 22, 23 initially used a discovery sample, followed by a correction method for multiple testing (false discovery rate or Bonferroni) and testing in a validation sample. Shah and colleagues12 presented as main results metabolite features without correction for multiple comparisons because they considered the analyses to be exploratory and because a Bonferroni correction was too conservative. Besides considering the multiple testing issue, univariate analyses do not take into account the relationship between and among metabolites in similar or different pathways. In addition, many of the analyses including 1 metabolite at a time (univariate analyses) were unadjusted for potential confounders.
Six articles used data‐driven multivariate methods in which all variables are included simultaneously, and some variable‐reduction technique is subsequently applied to deal with the relationships among them. Of these studies, 412, 14, 16, 23 applied PCA, which is frequently used to deal with a high number of interrelated variables in several biological pathways. The other 2 articles17, 18 applied the LASSO algorithm, which is an automated variable selection method, and another used both multivariable models optimized with Akaike information criteria and the LASSO algorithm.23 The study by Stegemann and colleagues also applied 2 alternative selection algorithms (backward stepwise and best subset) and included a network analysis.18 Another data‐driven approach—assessing CVD risk according to metabolites grouped in scores—presents an additional difficulty in synthesizing results among the presently included studies. In the studies reviewed, score calculations such as PCA, were based on approaches specific to the samples studied, thus making it difficult to extrapolate the relevance of these scores from 1 sample population to another.
In short, the different statistical approaches show the need for clearer standards about the statistical analyses that should be applied in metabolomics. Data pretreatment methods, including scaling, centering, and transformations, are another source of heterogeneity between and among studies. This methodological aspect is often overlooked, although it can be an important determinant in the selection process of those metabolites that may become more influential in the results. Issues of sample size and statistical power, addressed in a very limited fashion in the studies included in this review, are also key aspects that should be addressed more thoroughly in future metabolomic analyses.
Limitations and Strengths
Several limitations of this systematic review should be acknowledged. First, we excluded those studies that assessed the association between only 1 or a small set of targeted compounds and CVD risk. The typical rationals for these a priori hypothesis‐based studies are already known associations between specific metabolites and/or pathways and CVD risk. Some of this knowledge was obtained in some cases before the development of metabolomics. In contrast, this review was focused on studies following a wider metabolomic approach and where a statistical method was used for data reduction. Our rationale for this decision was our aim to obtain a robust summary of the best available evidence relating a broad metabolomic fingerprint and a prospective design with hard clinical end points. Second, for this same reason we excluded studies using other types of biospecimens such as urine or saliva. We opted to focus on circulating blood metabolites to reduce the already known variability in metabolomic profiles among different types of biosamples. Third, we excluded cross‐sectional studies that examined the metabolomic profile of CVD patients and controls because our aim was to identify metabolites associated with early metabolic changes to predict the future risk of CVD. Fourth, we were unable to conduct a quantitative analysis, mainly because of the heterogeneity and limitations of the articles already noted above, that is, widely differing metabolite targets and approaches and differential reporting or nonreporting of associations. Nevertheless, our study is the first attempt to systematically review the results and methodological aspects of studies aimed to assess the association between a wide peripheral blood metabolomic profile and risk of future CVD events.
Conclusions
Metabolomics holds considerable promise as an emerging field applied to the discovery of novel biomarkers for the future risk of CVD. There are still a small number of longitudinal studies assessing the association between baseline metabolomic profiles and the risk of CVD. Current data are promising, although approaches and results are heterogeneous. The lack of robust replications is 1 of the main problems in the current literature because of heterogeneity in study designs, end points, metabolomics platforms, and small sample sizes. Toward this end, standardization of platforms, data analysis approaches, and study designs is critical. We also need larger numbers of cases, longer durations of follow‐up, and repeated measures of metabolites, if possible. A pooled analysis of multiple studies would further help to improve statistical power and standardize analytic approaches. Finally, basic science research is needed to achieve better understanding of the biological mechanisms underlying the epidemiologic findings.
Sources of Funding
This work was supported by the National Institutes of Health, NHLBI 1R01HL118264 and NIDDK R01DK 102896. Hruby's contribution to this work was partially supported by the US Department of Agriculture–Agricultural Research Service, under Agreement No. 58‐1950‐4‐003.
Disclosures
None.
(J Am Heart Assoc. 2017;6:e005705 DOI: 10.1161/JAHA.117.005705.)
References
- 1. Global, regional, and national age‐sex specific all‐cause and cause‐specific mortality for 240 causes of death, 1990‐2013: a systematic analysis for the Global Burden of Disease Study 2013. Lancet. 2014;385:117–171. [DOI] [PMC free article] [PubMed] [Google Scholar]
- 2. Mozaffarian D, Benjamin EJ, Go AS, Arnett DK, Blaha MJ, Cushman M, Das SR, de Ferranti S, Després J‐P, Fullerton HJ, Howard VJ, Huffman MD, Isasi CR, Jiménez MC, Judd SE, Kissela BM, Lichtman JH, Lisabeth LD, Liu S, Mackey RH, Magid DJ, McGuire DK, Mohler ER, Moy CS, Muntner P, Mussolino ME, Nasir K, Neumar RW, Nichol G, Palaniappan L, Pandey DK, Reeves MJ, Rodriguez CJ, Rosamond W, Sorlie PD, Stein J, Towfighi A, Turan TN, Virani SS, Woo D, Yeh RW, Turner MB. Heart disease and stroke statistics—2016 update: a report from the American Heart Association. Circulation. 2016;133:e38–e60. [DOI] [PubMed] [Google Scholar]
- 3. Roth GA, Forouzanfar MH, Moran AE, Barber R, Nguyen G, Feigin VL, Naghavi M, Mensah GA, Murray CJL. Demographic and epidemiologic drivers of global cardiovascular mortality. N Engl J Med. 2015;372:1333–1341. [DOI] [PMC free article] [PubMed] [Google Scholar]
- 4. Roth GA, Nguyen G, Forouzanfar MH, Mokdad AH, Naghavi M, Murray CJL. Estimates of global and regional premature cardiovascular mortality in 2025. Circulation. 2015;132:1270–1282. [DOI] [PubMed] [Google Scholar]
- 5. Taegtmeyer H, Young ME, Lopaschuk GD, Abel ED, Brunengraber H, Darley‐Usmar V, Des Rosiers C, Gerszten R, Glatz JF, Griffin JL, Gropler RJ, Holzhuetter H‐G, Kizer JR, Lewandowski ED, Malloy CR, Neubauer S, Peterson LR, Portman MA, Recchia FA, Van Eyk JE, Wang TJ. Assessing cardiac metabolism. A scientific statement from the American Heart Association. Circ Res. 2016;118:1659–1701. [DOI] [PMC free article] [PubMed] [Google Scholar]
- 6. Brown JM, Hazen SL. Seeking a unique lipid signature predicting cardiovascular disease risk. Circulation. 2014;129:1799–1803. [DOI] [PMC free article] [PubMed] [Google Scholar]
- 7. Ussher JR, Elmariah S, Gerszten RE, Dyck JRB. The emerging role of metabolomics in the diagnosis and prognosis of cardiovascular disease. J Am Coll Cardiol. 2016;68:2850–2870. [DOI] [PubMed] [Google Scholar]
- 8. Shah SH, Kraus WE, Newgard CB. Metabolomic profiling for the identification of novel biomarkers and mechanisms related to common cardiovascular diseases form and function. Circulation. 2012;126:1110–1120. [DOI] [PMC free article] [PubMed] [Google Scholar]
- 9. Kordalewska M, Markuszewski MJ. Metabolomics in cardiovascular diseases. J Pharm Biomed Anal. 2015;113:121–136. [DOI] [PubMed] [Google Scholar]
- 10. Heather LC, Wang X, West JA, Griffin JL. A practical guide to metabolomic profiling as a discovery tool for human heart disease. J Mol Cell Cardiol. 2013;55:2–11. [DOI] [PubMed] [Google Scholar]
- 11. Stroup DF, Berlin JA, Morton SC, Olkin I, Williamson GD, Rennie D, Moher D, Becker BJ, Sipe TA, Thacker SB. Meta‐analysis of observational studies in epidemiology: a proposal for reporting. Meta‐analysis Of Observational Studies in Epidemiology (MOOSE) group. JAMA. 2000;283:2008–2012. [DOI] [PubMed] [Google Scholar]
- 12. Shah SH, Bain JR, Muehlbauer MJ, Stevens RD, Crosslin DR, Haynes C, Dungan J, Newby LK, Hauser ER, Ginsburg GS, Newgard CB, Kraus WE. Association of a peripheral blood metabolic profile with coronary artery disease and risk of subsequent cardiovascular events. Circ Cardiovasc Genet. 2010;3:207–214. [DOI] [PubMed] [Google Scholar]
- 13. Wang Z, Klipfell E, Bennett BJ, Koeth R, Levison BS, Dugar B, Feldstein AE, Britt EB, Fu X, Chung Y‐M, Wu Y, Schauer P, Smith JD, Allayee H, Tang WHW, DiDonato JA, Lusis AJ, Hazen SL. Gut flora metabolism of phosphatidylcholine promotes cardiovascular disease. Nature. 2011;472:57–63. [DOI] [PMC free article] [PubMed] [Google Scholar]
- 14. Shah SH, Sun J‐L, Stevens RD, Bain JR, Muehlbauer MJ, Pieper KS, Haynes C, Hauser ER, Kraus WE, Granger CB, Newgard CB, Califf RM, Newby LK. Baseline metabolomic profiles predict cardiovascular events in patients at risk for coronary artery disease. Am Heart J. 2012;163:844–850.e1. [DOI] [PubMed] [Google Scholar]
- 15. Kalim S, Clish CB, Wenger J, Elmariah S, Yeh RW, Deferio JJ, Pierce K, Deik A, Gerszten RE, Thadhani R, Rhee EP. A plasma long‐chain acylcarnitine predicts cardiovascular mortality in incident dialysis patients. J Am Heart Assoc. 2013;2:e000542 DOI: 10.1161/JAHA.113.000542. [DOI] [PMC free article] [PubMed] [Google Scholar]
- 16. Rizza S, Copetti M, Rossi C, Cianfarani MA, Zucchelli M, Luzi A, Pecchioli C, Porzio O, Di Cola G, Urbani A, Pellegrini F, Federici M. Metabolomics signature improves the prediction of cardiovascular events in elderly subjects. Atherosclerosis. 2014;232:260–264. [DOI] [PubMed] [Google Scholar]
- 17. Vaarhorst AAM, Verhoeven A, Weller CM, Böhringer S, Göraler S, Meissner A, Deelder AM, Henneman P, Gorgels APM, van den Brandt PA, Schouten LJ, van Greevenbroek MM, Merry AHH, Verschuren WMM, van den Maagdenberg AMJM, van Dijk KW, Isaacs A, Boomsma D, Oostra BA, van Duijn CM, Jukema JW, Boer JMA, Feskens E, Heijmans BT, Slagboom PE. A metabolomic profile is associated with the risk of incident coronary heart disease. Am Heart J. 2014;168:45–52.e7. [DOI] [PubMed] [Google Scholar]
- 18. Stegemann C, Pechlaner R, Willeit P, Langley SR, Mangino M, Mayr U, Menni C, Moayyeri A, Santer P, Rungger G, Spector TD, Willeit J, Kiechl S, Mayr M. Lipidomics profiling and risk of cardiovascular disease in the prospective population‐based Bruneck study. Circulation. 2014;129:1821–1831. [DOI] [PubMed] [Google Scholar]
- 19. Ganna A, Salihovic S, Sundström J, Broeckling CD, Hedman ÅK, Magnusson PKE, Pedersen NL, Larsson A, Siegbahn A, Zilmer M, Prenni J, Ärnlöv J, Lind L, Fall T, Ingelsson E. Large‐scale metabolomic profiling identifies novel biomarkers for incident coronary heart disease. PLoS Genet. 2014;10:e1004801. [DOI] [PMC free article] [PubMed] [Google Scholar]
- 20. Kume S, Araki S, Ono N, Shinhara A, Muramatsu T, Araki H, Isshiki K, Nakamura K, Miyano H, Koya D, Haneda M, Ugi S, Kawai H, Kashiwagi A, Uzu T, Maegawa H. Predictive properties of plasma amino acid profile for cardiovascular disease in patients with type 2 diabetes. PLoS One. 2014;9:e101219. [DOI] [PMC free article] [PubMed] [Google Scholar]
- 21. Zheng Y, Yu B, Alexander D, Steffen LM, Nettleton JA, Boerwinkle E. Metabolomic patterns and alcohol consumption in African Americans in the Atherosclerosis Risk in Communities Study. Am J Clin Nutr. 2014;99:1470–1478. [DOI] [PMC free article] [PubMed] [Google Scholar]
- 22. Würtz P, Havulinna AS, Soininen P, Tynkkynen T, Prieto‐Merino D, Tillin T, Ghorbani A, Artati A, Wang Q, Tiainen M, Kangas AJ, Kettunen J, Kaikkonen J, Mikkilä V, Jula A, Kähönen M, Lehtimäki T, Lawlor DA, Gaunt TR, Hughes AD, Sattar N, Illig T, Adamski J, Wang TJ, Perola M, Ripatti S, Vasan RS, Raitakari OT, Gerszten RE, Casas J‐P, Chaturvedi N, Ala‐Korpela M, Salomaa V. Metabolite profiling and cardiovascular event risk: a prospective study of 3 population‐based cohorts. Circulation. 2015;131:774–785. [DOI] [PMC free article] [PubMed] [Google Scholar]
- 23. Alshehry ZH, Mundra PA, Barlow CK, Mellett NA, Wong G, McConville MJ, Simes J, Tonkin AM, Sullivan DR, Barnes EH, Nestel PJ, Kingwell BA, Marre M, Neal B, Poulter NR, Rodgers A, Williams B, Zoungas S, Hillis GS, Chalmers J, Woodward M, Meikle PJ. Plasma lipidomic profiles improve on traditional risk factors for the prediction of cardiovascular events in type 2 diabetes mellitus. Circulation. 2016;134:1637–1650. [DOI] [PubMed] [Google Scholar]
- 24. Ruiz‐Canela M, Toledo E, Clish CB, Hruby A, Liang L, Salas‐Salvadó J, Razquin C, Corella D, Estruch R, Ros E, Fito M, Gómez‐Gracia E, Aros F, Fiol M, Lapetra J, Serra‐Majem L, Martínez‐González M, Hu FB. Plasma branched‐chain amino acids and incident cardiovascular disease in the PREDIMED trial. Clin Chem. 2016;62:582–592. [DOI] [PMC free article] [PubMed] [Google Scholar]
- 25. Guasch‐Ferré M, Zheng Y, Ruiz‐Canela M, Hruby A, Martínez‐González MA, Clish CB, Corella D, Estruch R, Ros E, Fitó M, Dennis C, Morales‐Gil IM, Arós F, Fiol M, Lapetra J, Serra‐Majem L, Hu FB, Salas‐Salvadó J. Plasma acylcarnitines and risk of cardiovascular disease: effect of Mediterranean diet interventions. Am J Clin Nutr. 2016;103:1408–1416. [DOI] [PMC free article] [PubMed] [Google Scholar]
- 26. Zheng Y, Hu FB, Ruiz‐Canela M, Clish CB, Dennis C, Salas‐Salvado J, Hruby A, Liang L, Toledo E, Corella D, Ros E, Fitó M, Gómez‐Gracia E, Arós F, Fiol M, Lapetra J, Serra‐Majem L, Estruch R, Martínez‐González MA. Metabolites of glutamate metabolism are associated with incident cardiovascular events in the PREDIMED PREvención con DIeta MEDiterránea (PREDIMED) Trial. J Am Heart Assoc. 2016;5:e003755 DOI: 10.1161/JAHA.116.003755. [DOI] [PMC free article] [PubMed] [Google Scholar]
- 27. Wang DD, Toledo E, Hruby A, Rosner BA, Willett WC, Sun Q, Razquin C, Zheng Y, Ruiz‐Canela M, Guasch‐Ferré M, Corella D, Gómez‐Gracia E, Fiol M, Estruch R, Ros E, Lapetra J, Fitó M, Aros F, Serra‐Majem L, Lee C‐H, Clish CB, Liang L, Salas‐Salvadó J, Martínez‐González MA, Hu FB. Plasma ceramides, Mediterranean diet, and incident cardiovascular disease in the PREDIMED Trial. Circulation. 2017;135:2028–2040. [DOI] [PMC free article] [PubMed] [Google Scholar]
- 28. Yu E, Ruiz‐Canela M, Guasch‐Ferré M, Zheng Y, Toledo E, Clish CB, Salas‐Salvadó J, Liang L, Wang DD, Corella D, Fitó M, Gómez‐Gracia E, Lapetra J, Estruch R, Ros E, Cofán M, Arós F, Romaguera D, Serra‐Majem L, Sorlí JV, Hu FB, Martinez‐Gonzalez MA. Increases in plasma tryptophan are inversely associated with incident cardiovascular disease in the Prevención con Dieta Mediterránea (PREDIMED) Study. J Nutr. 2017;147:314–322. [DOI] [PMC free article] [PubMed] [Google Scholar]
- 29. Magnusson M, Lewis GD, Ericson U, Orho‐Melander M, Hedblad B, Engström G, Ostling G, Clish C, Wang TJ, Gerszten RE, Melander O. A diabetes‐predictive amino acid score and future cardiovascular disease. Eur Heart J. 2013;34:1982–1989. [DOI] [PMC free article] [PubMed] [Google Scholar]
- 30. Havulinna AS, Sysi‐Aho M, Hilvo M, Kauhanen D, Hurme R, Ekroos K, Salomaa V, Laaksonen R. Circulating ceramides predict cardiovascular outcomes in the population‐based FINRISK 2002 cohort highlights. Arterioscler Thromb Vasc Biol. 2016;36:2424–2430. [DOI] [PubMed] [Google Scholar]
- 31. Johnson CH, Ivanisevic J, Siuzdak G. Metabolomics: beyond biomarkers and towards mechanisms. Nat Rev Mol Cell Biol. 2016;17:1–9. [DOI] [PMC free article] [PubMed] [Google Scholar]
- 32. Liepinsh E, Makrecka‐Kuka M, Makarova E, Volska K, Svalbe B, Sevostjanovs E, Grinberga S, Kuka J, Dambrova M. Decreased acylcarnitine content improves insulin sensitivity in experimental mice models of insulin resistance. Pharmacol Res. 2016;113:788–795. [DOI] [PubMed] [Google Scholar]
- 33. Newgard CB, An J, Bain JR, Muehlbauer MJ, Stevens RD, Lien LF, Haqq AM, Shah SH, Arlotto M, Slentz CA, Rochon J, Gallup D, Ilkayeva O, Wenner BR, Yancy WS, Eisenson H, Musante G, Surwit RS, Millington DS, Butler MD, Svetkey LP. A branched‐chain amino acid‐related metabolic signature that differentiates obese and lean humans and contributes to insulin resistance. Cell Metab. 2009;9:311–326. [DOI] [PMC free article] [PubMed] [Google Scholar]
- 34. Wang TJ, Larson MG, Vasan RS, Cheng S, Rhee EP, McCabe E, Lewis GD, Fox CS, Jacques PF, Fernandez C, O'Donnell CJ, Carr SA, Mootha VK, Florez JC, Souza A, Melander O, Clish CB, Gerszten RE. Metabolite profiles and the risk of developing diabetes. Nat Med. 2011;17:448–453. [DOI] [PMC free article] [PubMed] [Google Scholar]
- 35. Guasch‐Ferré M, Hruby A, Toledo E, Clish CB, Martínez‐González MA, Salas‐Salvadó J, Hu FB. Metabolomics in prediabetes and diabetes: a systematic review and meta‐analysis. Diabetes Care. 2016;39:833–846. [DOI] [PMC free article] [PubMed] [Google Scholar]
- 36. Gall WE, Beebe K, Lawton KA, Adam KP, Mitchell MW, Nakhle PJ, Ryals JA, Milburn MV, Nannipieri M, Camastra S, Natali A, Ferrannini E. α‐Hydroxybutyrate is an early biomarker of insulin resistance and glucose intolerance in a nondiabetic population. PLoS One. 2010;5:e10883. [DOI] [PMC free article] [PubMed] [Google Scholar]
- 37. Ferrannini E, Natali A, Camastra S, Nannipieri M, Mari A, Adam K‐P, Milburn MV, Kastenmüller G, Adamski J, Tuomi T, Lyssenko V, Groop L, Gall WE. Early metabolic markers of the development of dysglycemia and type 2 diabetes and their physiological significance. Diabetes. 2013;62:1730–1737. [DOI] [PMC free article] [PubMed] [Google Scholar]
- 38. Adams JM, Pratipanawatr T, Berria R, Wang E, DeFronzo RA, Sullards MC, Mandarino LJ. Ceramide content is increased in skeletal muscle from obese insulin‐resistant humans. Diabetes. 2004;53:25–31. [DOI] [PubMed] [Google Scholar]
- 39. Haus JM, Kashyap SR, Kasumov T, Zhang R, Kelly KR, Defronzo RA, Kirwan JP. Plasma ceramides are elevated in obese subjects with type 2 diabetes and correlate with the severity of insulin resistance. Diabetes. 2009;58:337–343. [DOI] [PMC free article] [PubMed] [Google Scholar]
- 40. Willeit P, Freitag DF, Laukkanen JA, Chowdhury S, Gobin R, Mayr M, Di Angelantonio E, Chowdhury R. Asymmetric dimethylarginine and cardiovascular risk: systematic review and meta‐analysis of 22 prospective studies. J Am Heart Assoc. 2015;4:e001833 DOI: 10.1161/JAHA.115.001833. [DOI] [PMC free article] [PubMed] [Google Scholar]
- 41. Rhee EP, Gerszten RE. Metabolomics and cardiovascular biomarker discovery. Clin Chem. 2012;58:139–147. [DOI] [PMC free article] [PubMed] [Google Scholar]
- 42. Klepacki J, Klawitter J, Klawitter J, Karimpour‐fard A, Thurman J, Ingle G, Patel D, Christians U. Amino acids in a targeted versus a non‐targeted metabolomics LC‐MS/MS assay. Are the results consistent? Clin Biochem. 2016;49:955–961. [DOI] [PMC free article] [PubMed] [Google Scholar]
- 43. Hoefer IE, Steffens S, Ala‐Korpela M, Bäck M, Badimon L, Bochaton‐Piallat M‐L, Boulanger CM, Caligiuri G, Dimmeler S, Egido J, Evans PC, Guzik T, Kwak BR, Landmesser U, Mayr M, Monaco C, Pasterkamp G, Tuñón J, Weber C. Novel methodologies for biomarker discovery in atherosclerosis. Eur Heart J. 2015;36:2635–2642. [DOI] [PubMed] [Google Scholar]
- 44. Vinaixa M, Schymanski EL, Neumann S, Navarro M, Salek RM, Yanes O. Mass spectral databases for LC/MS‐ and GC/MS‐based metabolomics: state of the field and future prospects. Trends Analyt Chem. 2016;78:23–35. [Google Scholar]
- 45. Jung JY, Lee H‐S, Kang D‐G, Kim NS, Cha MH, Bang O‐S, Ryu DH, Hwang G‐S. 1H‐NMR‐based metabolomics study of cerebral infarction. Stroke. 2011;42:1282–1288. [DOI] [PubMed] [Google Scholar]
- 46. Chen X, Liu L, Palacios G, Gao J, Zhang N, Li G, Lu J, Song T, Zhang Y, Lv H. Plasma metabolomics reveals biomarkers of the atherosclerosis. J Sep Sci. 2010;33:2776–2783. [DOI] [PubMed] [Google Scholar]
- 47. Kimberly WT, Wang Y, Pham L, Furie KL, Gerszten RE. Metabolite profiling identifies a branched chain amino acid signature in acute cardioembolic stroke. Stroke. 2013;44:1389–1395. [DOI] [PMC free article] [PubMed] [Google Scholar]
- 48. Bachlechner U, Floegel A, Steffen A, Prehn C, Adamski J, Pischon T, Boeing H. Associations of anthropometric markers with serum metabolites using a targeted metabolomics approach: results of the EPIC‐Potsdam study. Nutr Diabetes. 2016;6:e215. [DOI] [PMC free article] [PubMed] [Google Scholar]
- 49. Ho JE, Larson MG, Ghorbani A, Cheng S, Chen M‐H, Keyes M, Rhee EP, Clish CB, Vasan RS, Gerszten RE, Wang TJ. Metabolomic profiles of body mass index in the Framingham Heart Study reveal distinct cardiometabolic phenotypes. PLoS One. 2016;11:e0148361. [DOI] [PMC free article] [PubMed] [Google Scholar]
- 50. Palmer ND, Stevens RD, Antinozzi PA, Anderson A, Bergman RN, Wagenknecht LE, Newgard CB, Bowden DW. Metabolomic profile associated with insulin resistance and conversion to diabetes in the Insulin Resistance Atherosclerosis Study. J Clin Endocrinol Metab. 2015;100:E463–E468. [DOI] [PMC free article] [PubMed] [Google Scholar]
- 51. Gilstrap LG, Wang TJ. Biomarkers and cardiovascular risk assessment for primary prevention: an update. Clin Chem. 2012;58:72–82. [DOI] [PMC free article] [PubMed] [Google Scholar]
- 52. Griffin JL, Atherton H, Shockcor J, Atzori L. Metabolomics as a tool for cardiac research. Nat Rev Cardiol. 2011;8:630–643. [DOI] [PubMed] [Google Scholar]
- 53. Soininen P, Kangas AJ, Würtz P, Suna T, Ala‐Korpela M. Quantitative serum nuclear magnetic resonance metabolomics in cardiovascular epidemiology and genetics. Circ Cardiovasc Genet. 2015;8:192–206. [DOI] [PubMed] [Google Scholar]
- 54. Rankin NJ, Preiss D, Welsh P, Burgess KEV, Nelson SM, Lawlor DA, Sattar N. The emergence of proton nuclear magnetic resonance metabolomics in the cardiovascular arena as viewed from a clinical perspective. Atherosclerosis. 2014;237:287–300. [DOI] [PMC free article] [PubMed] [Google Scholar]